
Web GIS University for Planning Infrastructure
Orbin Papua, Joyce Christian Kumaat, Julyeta Paulina Amelia Runtuwene, and Parabelem Tinno
Dolf Rompas
Universitas Negeri Manado, Sulawesi Utara, Indonesia
Keywords: WebGis, Infrastructure, Waterfall, Survey
Abstract: The purpose of this study is to present Web GIS-based infrastructure resources at the State University of
Manado. This study uses the waterfall method or often called the classic life cycle, this approach is a
systematic approach. Software development begins with the user requirements specifications and then went
through the stages of planning, modeling, construction, and deployment, then topped with complete software
support generated. The research methodology used is the waterfall method has several stages: requirements,
system design, coding and testing, program implementation, and maintenance. The data source in this
research is to conduct a field survey to collect the object of study is all the infrastructure is located on the
campus of the State University of Manado. Mapping in the field using the Global Positioning System (GPS)
in which all the buildings on campus Unima at coordinates, the latitude, and longitude. Furthermore, to make
polygons from each building identified with aerial photographs available in the OpenStreetMap software then
analyze using other software namely QGIS 3.02 Girona Version. The design of the infrastructure on campus
WebGIS using data flow diagrams serve to demonstrate the scope and limitations of a system being modeled,
as well as demonstrate their interaction with the system outside entities. In the data flow diagram shows that
outside entities directly associated with Geographical Information Systems are the location of the building,
then the design has been formed with the geodatabase already arranged later in the design Web GIS Manado
State University. The results showed that there were two main locations from the campus of Manado State
University. The main campus is located in the administrative area of Minahasa Regency precisely in the
district of South Tondano, known as Tataaran Campus and other campuses located in the administrative area
of Tomohon City which is better known as the Faculty of Education. The campus layout area covering an
area of approximately 300 hectares resulted in the spread of lecture buildings spread randomly by following
the contour pattern formed on the land of the University of Manado campus. From the results of the
identification, there are 86 objects in the form of coordinates, forming separate clusters for faculties, head
office, institutions, and dormitories. The exposure of this location shows that it needs to be supported by other
infrastructure such as clean water, electricity, internet and roads that require high costs if not properly
managed. Therefore, it can be concluded from this research that it will help provide information through the
design of campus infrastructure so that it is easier to plan and make decisions towards Unima as a smart
campus.
1 INTRODUCTION
This study focused on the development of a web-
based geographic information system with the object
of research is the campus infrastructure. WebGIS
application development, facilitate campus planning
decisions in the future (Geoda, Suprayogi, and
Hani’ah 2015). The WebGIS application is a system
that can answer the planning needs in organizing
lectures such as the amount of space that students will
use so that planners can find a comparison between
the number of students and the size of the lecture
room used (Ajwaliya, Patel, and Sharma 2017).
Additionally, WebGIS can visualize and describe the
appropriate location within the campus facilities
planning (Bi, Yang, and Ren 2017). WebGIS already
developed in several countries such as China (Qi et
al. 2011), India (Abhilash and Lajish n.d.), Taiwan
330
Papua, O., Kumaat, J., Runtuwene, J. and Rompas, P.
Web GIS University for Planning Infrastructure.
DOI: 10.5220/0009010803300334
In Proceedings of the 7th Engineering International Conference on Education, Concept and Application on Green Technology (EIC 2018), pages 330-334
ISBN: 978-989-758-411-4
Copyright
c
2020 by SCITEPRESS – Science and Technology Publications, Lda. All rights reserved

(Niu 2012); The Czech Republic (Herman and Řezník
2015) and some other country.
Manado State University (Unima) is a university
located in Tondano, North Sulawesi. The campus
region of around 300 Ha is one of the campuses in
Indonesia which has a very large property capacity so
that careful planning is needed if infrastructure
management is to be carried out. Unima has two
campuses, campus Tataaran is administratively
located in the district of Minahasa and Campus
Kaaten in Tomohon City.
The building infrastructure is far apart in Unima
and the area is wide on campus, so it is difficult to
find out the location of the inter-lecture buildings.
Often found where the students are still looking for a
location where they are studying or guests visiting the
campus Unima, so the need for information about the
location of buildings in Unima requires the
availability of a good information system as well, can
provide ease of finding the location of buildings on
the campus of Unima.
Geographic Information System (GIS) based web
can be used to solve the above problems in the search
for the location of Building Unima layout and map
displays as a source of information providers. The
purpose of this study is to present Web GIS-based
infrastructure resources at the State University of
Manado.
2 METHODOLOGY
The system development methodology has
evolved over the years and has adapted to changes in
software project requirements, where each
methodology has strengths and weaknesses that tend
to make it profitable for certain types of projects
(Fanon 2016). Similarly, the evolution in the
complexity and the need for a web application (Fanon
2016), new methodology specifically for web systems
have also been developed (Herman and Řezník 2015),
but the technology and the web have changed the
system needs to quickly generate new project-specific
methodologies are being developed and documented
(Bi et al. 2017).
The new technology has provided a framework
methodology that can be adapted to future web
projects (Fanon 2016). Web GIS is a system that
shows the characteristics of GIS and Web (Ajwaliya
et al. 2017). More specifically, Web GIS mapping and
visualization of geographic information to the web
platform. The method used is using the Waterfall
method (Fanon 2016). The Waterfall method is often
called the classic life cycle, where it describes a
systematic and sequential approach to software
development, starting with the specifications of user
needs and then going through the stages of planning,
modeling, construction, and deployment, and ending
with support for software complete produced (Ananta
and Winiarti 2013);(Nakayama et al. 2017).
This study uses two main data, the data used
consist of primary data (field observations) and
secondary data (literature) (Suharsimi 2010):
1. Primary data that field surveys in several
locations Manado State University building
with the installation of coordinate points of
each building.
2. Secondary data consists of a basic map of the
location of the Manado State University
building (QGIS Bing Maps plugin), building
and road data using OpenStreetMap (OSM).
The stages in data collection techniques consist
of, The first step to do is make a field and then
collecting data on observations made that observation
directly. Direct observation is the direct observation
of the location of Manado State University building,
as well as by using a list of records for the adjustment
of secondary data and then determining the
coordinates with a Global Position System (GPS) on
every building in Manado State University; the
second stage is to carry out documentation, where the
documentation data is carried out in this study with
the image/photographers of the building at Manado
State University, whereas the latter stages carried out
literature studies. At this stage, the authors studied the
theories related to the research to be conducted. In
this case, learn things related to WebGIS.
Data sources in this study are subjects from which
data can be obtained (Suharsimi 2010). In this study,
the data sources are the following: the name and
coordinates of the point of building in Manado State
University by using the Global Positioning System
(GPS), the software used is QGIS 3.02 Girona
Version with basic map support from OpenStreetMap
(Jafari et al. 2014).
Design layout WebGIS Building location in
Manado State University is:
Web GIS University for Planning Infrastructure
331
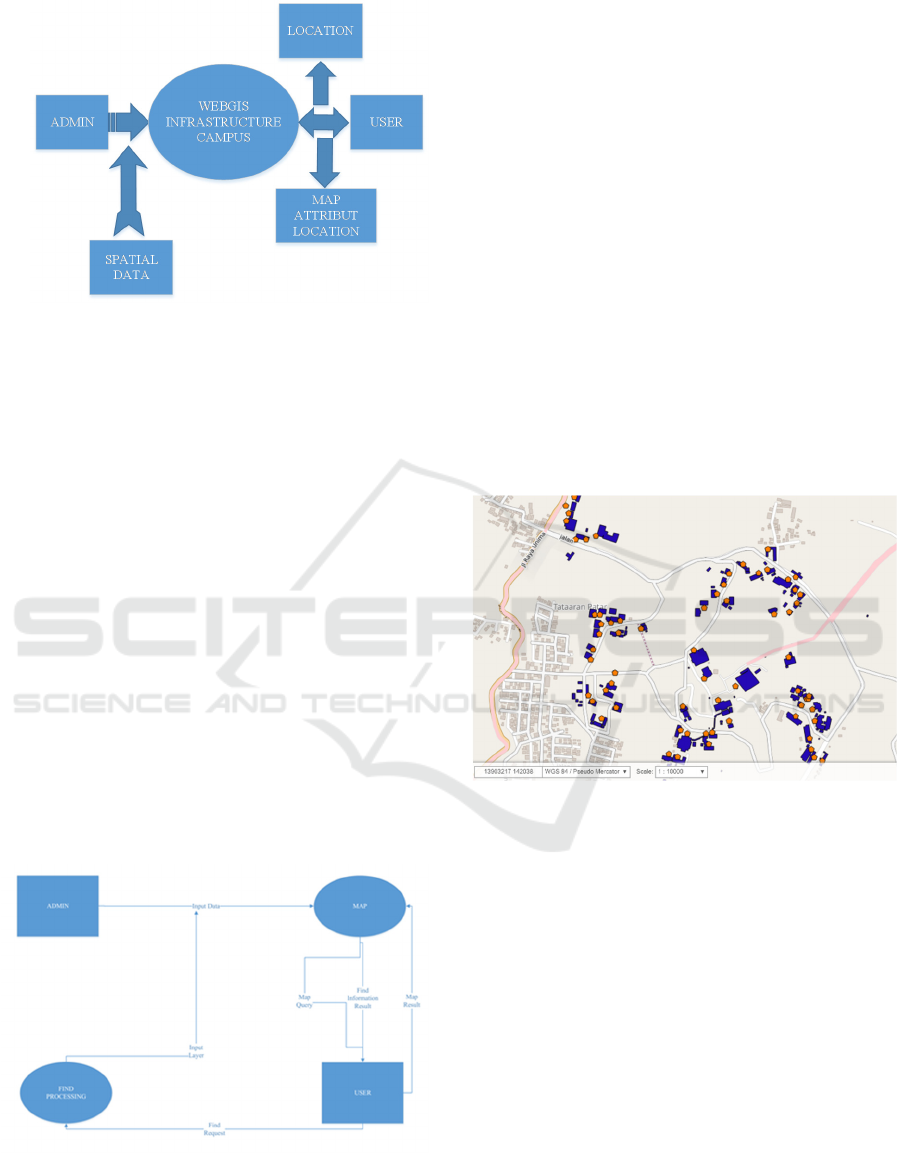
Figure 1: Diagram Context.
Diagram Context, also known as DFD (Data Flow
Diagram) is used to indicate the scope and limitations
of a system being modeled, as well as demonstrate
their interaction with the system outside entities
(Kulkarni et al. 2014). In the DFD of these entities
indicated that beyond that relate directly to the system
is the location of the location of the Geographic
Information Systems Building at the State University
of Manado, the User and Admin.
From the diagram above it (Figure 1) can be
illustrated that the admin includes spatial data and
attributes map the location of the building located in
Manado State University then the system provides
information on spatial data and attribute data to the
admin, while the user can interact with GIS location
of the building in Manado State University with input
is a choice of locations available on the system.
Furthermore, the location of the GIS of the building
in Manado State University will provide output in the
form of map display and area attributes and location
of the building located at Manado State University to
User.
Figure 2: Data Flow Diagram.
DFD in Figure 2 above, describes the process of data
in the system, where there are two external entities,
namely Administrators and Users (Agus et al. 2018);
in this DFD, there are two processes are taking place,
that the map data input process and their attributes
and location of the search process at the building site
Manado State University in accordance with the
inputted data.
The last stage is that all the attributes that have
been arranged into a map are then visualized into the
Qgis Cloud (Landa et al. 2017).
3 RESULTS AND DISCUSSION
3.1 Field Data Collection Process
The process of data collection in this research
field that uses the Global Positioning System (GPS).
There are 86 points in the decision and all the data
scattered Manado State University study site. From
Figure 3 below shows, the observation points are:
Figure 3: GPS Points Unima Campus distribution
infrastructure Tataaran
.
From the results of identification, there are 67 points
of buildings that are used as educational facilities on
the campus of Unima Tataaran. While the other 19
points are located on the Unima Kaaten campus.
EIC 2018 - The 7th Engineering International Conference (EIC), Engineering International Conference on Education, Concept and
Application on Green Technology
332
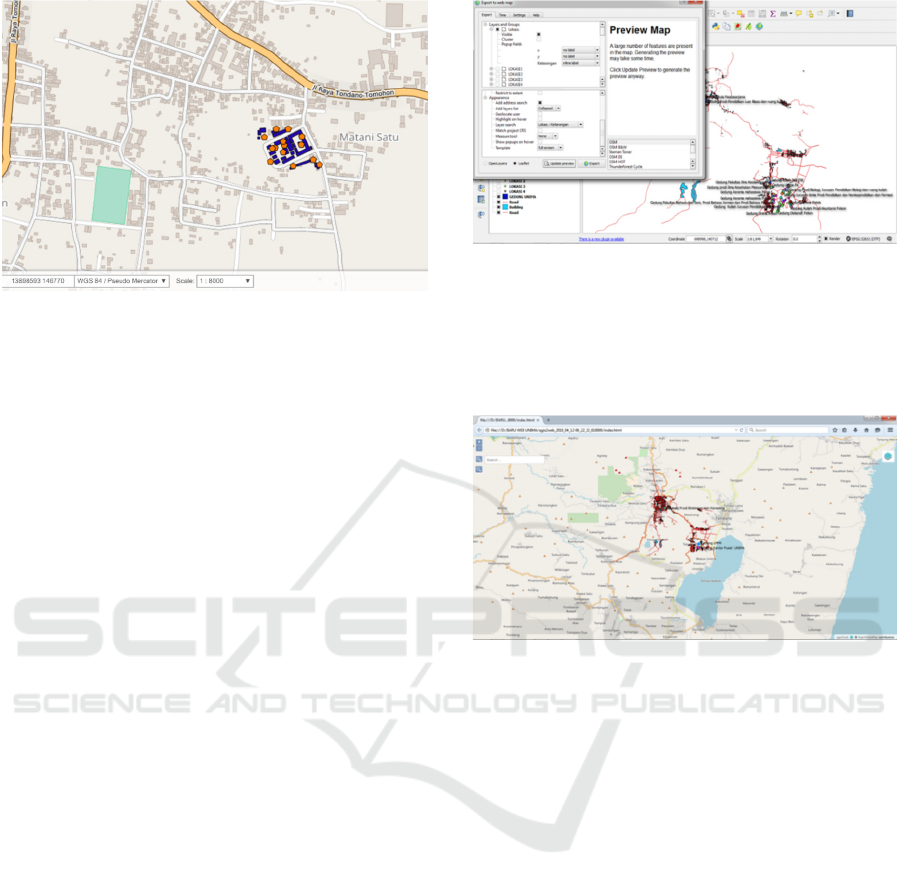
Figure 4. GPS point of infrastructure distribution of Unima
Kaaten Campus.
The main campus Unima has an area of about 300 ha
(Figure 4), the distribution of each faculty which
involves a series of courses and majors have a
flocking pattern as found in the Faculty of Science,
Faculty of Engineering, Faculty of Languages and
Literature and the Faculty of Economics. Whereas
for the Faculty of Social Sciences and the Faculty of
Sports Sciences several study programs are far apart
from their parent faculties, making it difficult to
supervise lecture activities as well as in administering
student administration. Likewise, the Unima campus
in Kaaten which consists of the Faculty of Education
and Postgraduate Programs needs tighter supervision
due to the distance from the main campus in Tataaran.
As for the settlement of the problem conducted by the
rector is the addition of the Internet network and
control all academic activities through rigorous
academic information systems. For that campus
network system planning will be more concerned to
make Unima as a smart and environmentally whole
campus.
3.2 The Design of WebGIS
The design of the WebGis Unima infrastructure is
an important part, where this activity focuses on
visualization of the campus so that it is easier in
planning.
Figure 5: Export to Web Map
Utilizing the facilities provided by the QGIS
software, with the plugin web map data attributes
such as polygon the buildings on Unima campus are
exported to the web map (Figure 5).
Figure 6: Result Export to WebMap
In Figure 6 above shows, the results of a map created
by QGIS has been successfully exported to the web
browser.
3.3 Web Mapping Testing
Web mapping testing is done using the
Mozilla Firefox and Google Chrome web browser
with the Windows operating system on desktop
computers and Android operating systems on mobile
devices, in order to run properly must be provided
connection internet network. Web map testing can be
accessed using the web address
https://qgiscloud.com/orbin/webgis/. Tests carried
out using its web address is accessible then, the map
view is as follows (Figure 7):
Web GIS University for Planning Infrastructure
333

Figure 7. WebGis Campus with QGIS Cloud
4 CONCLUSIONS
This research can be summed up as follows, that
the use of the software in the design of WebGIS is
using Quantum GIS Girona where the software
provides features to support the design QGIS
CLOUD Geographic information system based on
Web.
WebGIS-based Geographic Information System
web at UNIMA will provide information about the
building located at the State University of Manado as
The location of the building, the point coordinates,
names of buildings and map information that can be
accessed by users on the web address
https://qgiscloud.com/orbin / webgis /.
ACKNOWLEDGEMENTS
Thank you to say to Rector and Head Institute of
Research and Community Service Manado State
University in facilitating this research.
REFERENCES
Abhilash, K. G. and V. L. Lajish. n.d. “An Open Source
Web GIS Based Infrastructure and Environmental
Planning for Universities.” pp 2–5.
Agus, F., Ramadiani, W. Silalahi, A. Armanda, and
Kusnandar. 2018. “Mapping Urban Green Open
Space in Bontang City Using QGIS and Cloud
Computing.” in IOP Conference Series: Earth and
Environmental Science. Vol 144 (1), 012032
Ajwaliya, Rajeshkumar J., Shashikant Patel, and
Shashikant A. Sharma. 2017. “Web-GIS Based
Application for Utility Management System.”
Journal of Geomatics Vol 11(1).
Ananta, Priranda Widara and Sri Winiarti. 2013.
“Menggunakan Metode Gap Kompetensi.” Jurnal
Sarjana Teknik Informatika Vol 1, No.2, pp 574–83.
Bi, Tianping, Xuemei Yang, and Meili Ren. 2017. “The
Design and Implementation of Smart Campus
System.” Journal of Computers Vol 12(6), pp 527–
33.
Fanon, Ananda. 2016. “TOWARDS A NEW
METHODOLOGY FOR WEB GIS
DEVELOPMENT.” International Journal of
Software Engineering & Applications (IJSEA) Vol
7(4).
Geoda, Guistia Puspa, Andri Suprayogi, and Hani’ah. 2015.
“Pembuatan Aplikasi Sistem Informasi Geografis
Kampus Universitas Diponegoro Berbasis Android.”
Teknik Geodesi Fakultas Teknik, Unversitas
Diponegoro, Vol 4(April), pp 267–76.
Herman, L. and T. Řezník. 2015. “3D Web Visualization of
Environmental Information - Integration of
Heterogeneous Data Sources When Providing
Navigation and Interaction.” International Archives
of the Photogrammetry, Remote Sensing and Spatial
Information Sciences - ISPRS Archives Vol
40(3W3), pp 479–85.
Jafari, Hamidreza, Sirus Hassanpour, Leila Rahili
KHorasani, and Ahmad Pourahmad. 2014. “The
Application of GIS Io Site Selection and Space-Place
Analysis of Pollution and Air Pollutant Sources in
Metropolitan Kermanshah.” Journal of
Environmental Studies, Vol 40 (1), pp 51-64
Kulkarni, A. T., J. Mohanty, T. I. Eldho, E. P. Rao, and B.
K. Mohan. 2014. “A Web GIS Based Integrated
Flood Assessment Modeling Tool for Coastal Urban
Watersheds.” Computers and Geosciences., Vol 64,
pp 7-14
Landa, M., P. Kavka, L. Strouhal, and J. Cepicky. 2017.
“Building a Complete Free and Open Source GIS
Infrastructure for Hydrological Computing and Data
Publication Using GIS.Lab and Gisquick Platforms.”
in International Archives of the Photogrammetry,
Remote Sensing and Spatial Information Sciences -
ISPRS Archives., Vol 42(4), pp 101-105
Nakayama, Yu, Kazuhiko Nakamura, Hitoshi Saito, and
Rui Fukumoto. 2017. “A Web GIS Framework for
Participatory Sensing Service: An Open Source-
Based Implementation.” Geosciences Vol 7(2), pp
22.
Niu, Jinfang. 2012. “Return to Article D Lib Magazine
An Overview of Web Archiving.”
D-Lib Magazine
Vol 18(3/4), pp 1–9.
Qi, Lili, Chengyou Wang, Wenjun Zhou, and Zhiqiang
Yang. 2011. “Design of Distribution SCADA
System Based on Open Source GIS.” DRPT 2011 -
2011 4th International Conference on Electric
Utility Deregulation and Restructuring and Power
Technologies pp 523–26.
Suharsimi, Arikunto. 2010. Prosedur Penelitian : Suatu
Pendekatan Praktik (Edisi Revisi).
EIC 2018 - The 7th Engineering International Conference (EIC), Engineering International Conference on Education, Concept and
Application on Green Technology
334
