
Evaluation of Acceptance toward Decision Support Systems for New
Student Admission Management
Darmawan Napitupulu
1,3
, Krisna Adiyarta
1
, Santosa Wijayanto
1
and Zulvia Khalid
2
1
Fakultas Teknologi Informasi, Universitas Budi Luhur, Petukangan, Jakarta, Indonesia
2
Fakultas Ekonomi dan Bisnis, Univesitas Budi Luhur, Petukangan, Jakarta, Indonesia
3
Indonesian Institute of Sciences, Tangerang Selatan, Banten, Indonesia
Keywords: Validity, Reliability, Critical Factors, ISO 9001, SMEs
Abstract: To be able to survive amid intense organizational competition, Small Medium Entrepreneurs (SMEs)
require strategies to improve the quality of products/services offered. Quality improvement is clearly needed
so that companies have high competitiveness. Good product/services can be produced by good internal
processes. ISO 9001 Quality Management System is a framework that has been used extensively by SMEs
to ensure the quality of the process. But not a few SMEs have successfully implemented and obtained QMS
certification. Many factors influence the process of implementing ISO 9001 QMS, especially in the context
of SMEs that have many limitations. This study aims to test the validity and reliability of scale for
implementing ISO 9001’s Critical Factors in SMEs level. The method used is a quantitative survey of four
SMEs that have successfully implemented and obtained ISO 9001 certification. Data from the survey were
analysed using the Aiken approach to show the level of validity and reliability. The results showed that of
the 20 items tested, only 19 items were met the criteria. Item of Employee Acceptance was eliminated from
scale because the implementation of ISO 9001 is mandatory for all stakeholders so the factors could be
ignored.
1 INTRODUCTION
The use of Information and Communication
Technology (ICT) today is an inevitable necessity.
Even the use of ICT is one of the opportunities that
can be used by organizations in increasing
competitive advantage. Ray (2007) states that ICT
users can support organizational business processes
and even increase business value. This has also
penetrated into the world of education, including
vocational high schools (SMK). At the vocational
level, there are several activities to support the
learning process, vocational school management or
vocational administration. These activities include:
learning process, student data processing, new
student admission, student data management,
delivery of information to the community, teachers
and students, library management, payment of
school fees, etc. ICT can be used to support these
activities so that the effectiveness and efficiency of
the use of existing resources can be optimized. One
of the uses of ICT is to automate existing business
processes (Wardani, 2017). Based on some
literature, it turns out there are still many SMKs that
have not used ICT optimally. Business processes
that are running are not yet automated, causing
problems such as slow processing, inaccurate
recording, difficulty tracing data, etc. Portraits that
are often found in schools in general are still manual
systems, printed media that is still attached, data
storage is still conventional, that is written on a book
and stored in a large closet that requires a special
room or place (Hartono, 2014; Hasbi, 2015;
Wardani, 2017). This study emphasizes the business
processes of new student admissions, especially in
the Information Technology Vocational High
School. The new student admission system in
vocational schools is still mostly manual where
prospective new students register by writing their
own data on the paper on the registration form
provided. After the form is filled in and then
recapitulated by the school into the computer. The
data collection process for new students also uses
paper and then processed in software such as
Microsoft Excel (Nugroho, 2007; Herdianto, 2014).
Processing of test scores and selection results is
announced through an information board so that
prospective students must be obliged to come to
school. Bina Informatika Vocational Schools, such
Napitupulu, D., Adiyarta, K., Wijayanto, S. and Khalid, Z.
Evaluation of Acceptance toward Decision Support Systems for New Student Admission Management.
DOI: 10.5220/0009491500190023
In Proceedings of the 1st Unimed International Conference on Economics Education and Social Science (UNICEES 2018), pages 19-23
ISBN: 978-989-758-432-9
Copyright
c
2020 by SCITEPRESS – Science and Technology Publications, Lda. All rights reserved
19

as schools, generally select new student admissions
based on students' talents, interests and abilities.
This vocational school offers several departments
that are of interest to prospective students so that it
is expected that prospective students can choose an
appropriate department and are able to take part in
the productive learning process of the chosen
department. Therefore, the process of selecting new
prospective students must be done well, otherwise
losses will occur on both sides of the school and
students themselves. In addition, the limited capacity
of each department, the school is expected to be able
to select prospective students based on the highest
score in each entrance examination. To produce
information quickly, precisely and accurately from
the results of the overall value obtained by
prospective students, of course the school needs an
information technology developed. Decision support
systems have been developed to assist management
in selecting prospective students based on
established criteria. This study aims to evaluate the
extent to which the system can be accepted by users
so that it can eventually be used optimally. This is
because an application of the right information
technology in an organization is not an easy thing, it
often fails because of technical and non-technical
constraints (Saktiyanto, 2016). Therefore, evaluation
of user acceptance is very important to predict the
use of these technologies in the future. According to
Delon & McLean (2003), user acceptance of a
technology is directly proportional to its adoption
rate.
According to Jogiyanto (2007), technology users
will have behavioral interests using technology if
they feel the technology is useful and easy to use.
The technology acceptance model that has been
widely used is the Technology Acceptance Model
(TAM) which identifies two key factors of
individual acceptance of technology namely
perceived usefulness and perceived ease of use. This
study uses the TAM model to determine the level of
user acceptance of the decision support system in the
new student admissions process that has been
developed.
2 METHODS
This research is quantitative descriptive which aims
to describe the extent of acceptance of the decision
support system of new students in Bintaro
Informatics Development Vocational School from
the user's perception. Decision support system
(DSS) was developed to assist schools in selecting
prospective new students who take the entrance
screening test, making it easier for management to
obtain data quickly and accurately in making
decisions.
A total of 24 people were involved in the
research survey including the Principal, Deputy
Principal, Deputy Head of Education, Deputy Head
of Student Schools, Deputy Principal of Facilities
and Infrastructure, Head of Information and
Communication Technology, Head of Arts and
Creative Industries and members of the New Student
Admissions Team which was formed to manage the
running PSB process. This is due to the many
criteria tested which include academic tests, aptitude
tests, psychological test, interview tests and physical
tests. All respondents filled out a questionnaire that
had been tested for validity and reliability.
The distribution process and filling out the
questionnaire takes a long time, namely for 1 month
(July 2018). This is because filling out the
questionnaire must simultaneously use the decision
support system directly so that there is an element of
practice. Previously using DSS, respondents were
given an explanation of how the system works and
what features are included in it. After the respondent
uses the system, a questionnaire can be done. The
questionnaire distributed in this study consisted of a
total of 15 statement items (indicators), including 2
independent variables and 1 dependent variable. The
independent variable used to predict the level of user
acceptance is the perception of benefits consisting of
4 statement items and perceived ease of use as many
as 6 statement items. While the dependent variable
measured is the level of user acceptance which
consists of 5 items (indicators). The assessment
dimension uses a Likert scale, starting from a scale
of 1 = "strongly disagree (SDA) to score 5 ="
strongly agree (SA)". The level of approval of the
benefits and ease of use aspects can predict the level
of user acceptance of the developed DSS. In
addition, it can be evaluated what aspects are still
lacking in the performance of the system so that it
becomes a recommendation for future
improvements.
This study uses the technology acceptance model
(TAM) which aims to predict the level of user
acceptance of technology. The original TAM model
actually consists of five variables: perception of ease
of use, perception of usefulness, attitude towards
use, interest in the use of actual systems and use of
behavior. However, in the literature study
conducted, several studies show that attitude
attitudes variables have not proven to be significant
and are dropped from the TAM model (Venkatesh &
UNICEES 2018 - Unimed International Conference on Economics Education and Social Science
20
Davies, 1996; Venkatesh & Davies, 2000;
Venkatesh et. Al, 2003; Chuttur, 2009). They are
arguing that the role of attitude in explaining
behavioral intention or actual adoption is the
behavior is very limited and is a partial mediator in
the relationship between beliefs and the adoption
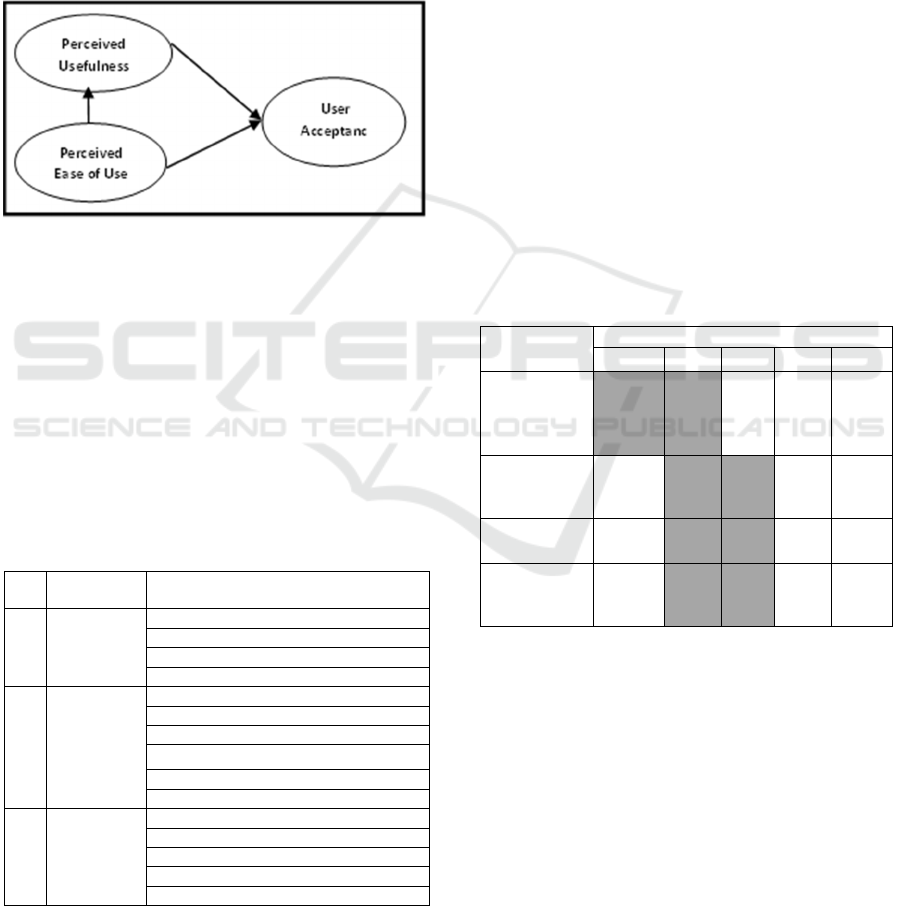
behavior or intention. Several other studies (Gahtani,
2001; Sanjaya 2002) simplify the TAM model by
combining the use behavior variable with actual
system use into a variable, user acceptance. The
operational model in this study can be presented in
Figure 1 as follows:
Figure 1: Growth of ISO 9001 Penetration (ISO, 2014)
The operational table of the research can be seen in
Table 1 where each variable both independent and
bound variables are latent (abstract) so it needs to be
operationalized by adding several items/
measurement indicators. The measurement
instrument in this study consist of perceived
usefulness (6 items/indicators), perceived ease of use
has 6 items/indicators and user acceptance has 3
items/indicators (Davies, 1989) as presented in
Table 1 below:
Table 1: Measurement Instrument
Testing of user acceptance of DSS is analyzed
descriptively with the first two levels based on the
number of frequencies of the respondent's answer
distribution and the second, with a statistical
indicator in the form of the average value of the total
respondents' answers to each variable and item. In
this study it is assumed that the mean value of a
variable exceeds 4 then it can be concluded that the
level of agreement of respondents is assumed to be
high. For example, if the ease of use perception
variable has an average value equal to or greater
than 4 (4), it can be said that the system proved easy
to use by the user. Conversely, if the mean value is
below 4 (<4), the system is assumed to be difficult to
use. Statistical calculations are also carried out not
only for variable levels, but also for each item in the
questionnaire.
3 RESULT & DISCUSSIONS
Based on the results of the questionnaire that has
been processed obtained descriptive statistics that
can be presented in Table 2 as follows:
Table 2: Response Frequency : Perceived Usefulness
SA= Strongly Agree, A=Agree, N=Netral, DA=Disagree,
SDA=Strongly Disagree
Based on Table 2 of the perceived usefulness aspect
that is assessed, the majority of respondents' answers
are neutral and agree. The indicator "accelerating
completion of work" gets the highest percentage of
59% of respondents agree and 33% of respondents
said strongly agree. In addition, if the average value
of each indicator calculated for indicators obtained
for PU1 items, the average score of 4.25, PU2 4.00,
PU3 and PU4 has the same score of 3.92. From the
average scores obtained, almost all get a mean score
of 4.00 so that it can be said that the decision
No Variab
le
Item/Indicator
1. Perceived
Usefulness
Accelerate completion of tasks (PU1)
Improve performance (PU2)
Simplify work (PU3)
Increasing Effectiveness (PU4)
2. Perceived
Ease of Use
Easy to learn (PE1)
Easily calculate participant value (PE2)
Easily get ranking information (PE3)
Easy to understand (PE4)
Skill using (PE5)
Easy to use (PE6)
3. User
Acceptance
Increase frequency (UA1)
Interest in using (UA2)
Real use (UA3)
User satisfaction (UA4)
Motivate others (UA5)
Item/Indicat
or
Response Frequency
SA A N DA SDA
Accelerate
completion
of tasks
(PU1)
33% 59% 8% - -
Improve
performance
(PU2)
17%
43% 50
%
- -
Simplify
work (PU3)
17%
34% 58
%
- -
Increasing
Effectivenes
s (PU4)
18%
33% 58
%
- -
Evaluation of Acceptance toward Decision Support Systems for New Student Admission Management
21
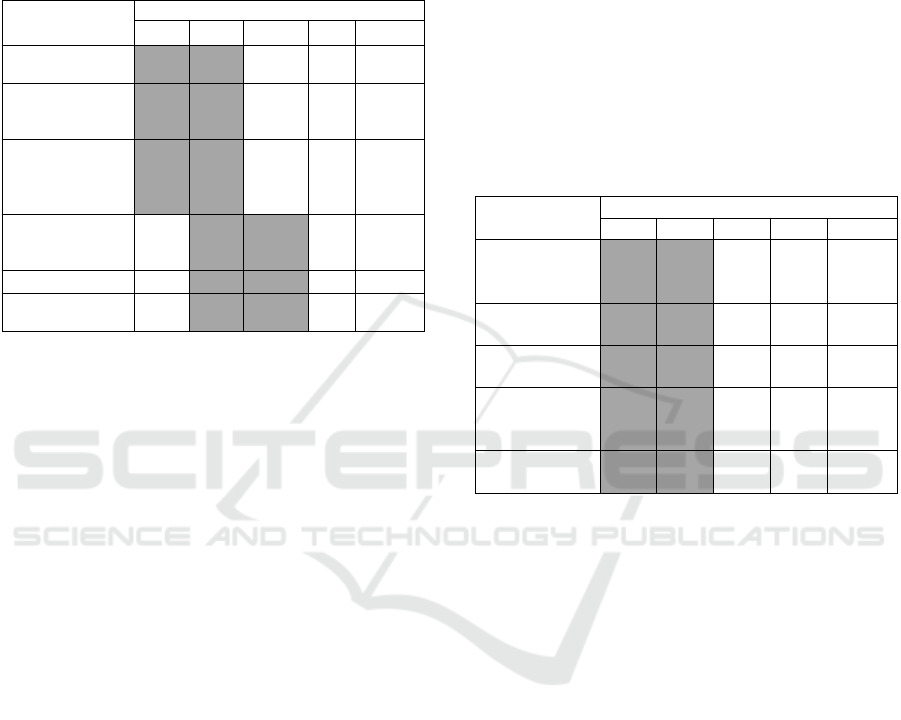
support system developed is considered useful for
users, especially in accelerating task execution,
improving work performance and effectiveness in
helping new student admission activities in school.
The results in terms of perceived ease of use can be
shown in Table 3 below:
Table 3: Response Frequency : Perceived Ease of Use
In Table 3 it can be seen that the majority of
frequency answers are at the agreed level where the
highest agreed frequency is on the indicator "easy to
calculate the value of participants (PE2)" and "easy
to get information (PE3)". When viewed in PE2 and
PE3 items, users find that the decision support
system can provide information quickly and easily
regarding the rank of prospective students who have
taken the exam based on the calculation of the value
criteria tested. Based on the average value
calculated, the PE1 items obtained got a score of
4.17, PE2 & PE3 4.25, PE4 3.92, PE5 & PE6
reaching 3.83. In general, the average score obtained
is 4.00 although there are several indicators that
must be improved. Thus it can be said that the
decision support system can provide ease of use for
users to select prospective new students in the
school environment.
Furthermore, in this section also analysed aspects
of user acceptance which can be presented in Table
4. Based on Table 4 below, it can be shown from the
overall indicators that are assessed, the frequency of
respondents' answers at the level strongly agrees and
agrees is higher than the other alternative answers.
For example, the item "interest in using (UA2)", the
number of respondents who chose a very agreeable
answer reached 50% (12 of 24 respondents) and
agreed also 50%.
There are no other answers besides the two
answers. This means that the interest of respondents
to use the system is very high. The average value
obtained for each item is as follows: UA1 4.42, UA2
4.50, UA3 4.33, UA4 4.33 and UA5 get an average
score of 4.08. From the average score it can be
shown that all items measured have a mean value
above 4 (> 4) so that it can be said that each
indicator shows that user acceptance is also high for
the decision support system that has been developed.
The mean score summarized for each variable that
also shows the same results as the analysis carried
out is for perceived usefulness (4.02), perceived ease
of use (4.04) and user acceptance (4.39). All varaibel
have an average score above the number 4 (<4)
where the variable perceived ease of use has a higher
value than perceived usefulness.
Table 4: Response Frequency : User Acceptance
This shows that the factor of ease of use is
preferred by the user in this case which encourages
high user acceptance. This will certainly greatly
support its adoption in the future.
4 CONCLUSIONS
Based on the research that has been carried out, it
can be concluded the survey results of user
acceptance evaluation that the user considers the
decision support system developed is very useful in
supporting the completion of work more effectively
and efficiently and improving performance,
especially management and the new student
admission team. In terms of ease of use, users are
also perceived to be very good, especially easy to
calculate the value of participants and easily get
information on the rankings of the participants
resulting from the selection. Both of these
independent variables proved to be in line with the
level of user acceptance which was also perceived as
high especially for the interest in using the system.
The evaluation results provide input and
Item/Indicator
Response Frequency
SA A N DA SDA
Easy to learn
(PE1)
33% 50% 17% - -
Easily calculate
participant value
(PE2)
34% 58% 8%
- -
Easily get
ranking
information
(PE3)
34% 58% 8%
- -
Easy to
understand
(PE4)
25%
42% 33%
- -
Skill using (PE5)
17%
50% 33%
- -
Easy to use
(PE6)
17%
50% 33%
- -
Item
Response Frequency
SA A N DA SDA
Increase
frequency
(UA1)
50% 42% 8% - -
Interest in
using (UA2)
50% 50% -
- -
Real use
(UA3)
42% 50% 8%
- -
User
satisfaction
(UA4)
42% 50% 8%
- -
Motivate
others (UA5)
3% 42% 25% -
-
UNICEES 2018 - Unimed International Conference on Economics Education and Social Science
22

recommendations for the school management in
increasing the use of the system in the future.
REFERENCES
Ray, G. W., Muhanna, A., and Barney, J. B. (2007).
Competing With It: The Role Of Shared It-Business
Understanding. Communications Of The Acm, Vol.
50, No. 12, pp. 87-91.
Wardani, E. S., Putranto, H., and Wibawa, A. P. (2017).
Sistem Informasi di SMK dan Upaya Peningkatan
Kinerjanya. JIPI, Vol. 2, No. 1, pp. 15-19.
Hartono, M., Mumpuni, I.D., and Setyowibowo, S. (2014).
Sistem Informasi Akademik Berbasis Web di SMK
Negeri 1 Semboro. J. Din., Vol. 5, No. 1, pp. 52-63.
Hasbi, M. (2015). Perancangan Sistem Informasi
Akademik pada SMK Negeri 2 Simbang Maros. Nalar
Pendidik, Vol. 3, No. 1, pp. 301-305.
Nugroho, K. H. (2007). Sistem Informasi Pendaftaran
Siswa Baru (PSB) di SMK Sakti Gemolong Berbasis
CLient Server. Universitas Sebelas Maret.
Herdianto, R. A. (2014). Analisis dan Pengembangan
Sistem Informasi Penerimaan Siswa Baru Berbasis
Codeigniter PHP Framework di SMK Ma’arif 1
Mungkid.
Saktiyanto, A. H. (2013). Faktor-faktor yang
Mempengaruhi Kegagalan dan Keberhasilan Sistem
Informasi pada Sebuah Perusahaan. Retrieved from:
http://heri49e.blogstudent.mb.ipb.ac.id/2013/11/23/fak
tor-faktor-yang-mempengaruhi-kegagalan-dan-
keberhasilan-sistem-informasi-pada-sebuah-
perusahaan/
Delone, W. H. and Mclean, E. R. (2003). The DeLone and
McLean model of information systems success: a ten-
year update. Journal of Management Information
Systems, Vol. 19, No. 4, pp. 9–30.
Jogiyanto. 2007. Sistem Informasi Keperilakukan. Edisi 1
Yogyakarta : Andi.
Venkatesh, V. and Davis, F.D. (1996), A Model of the
Perceived Ease of Use Development and Test.
Decision Sciences, Vol. 27, No. 3, pp. 451-481.
Venkatesh, V. and Moris, M. (2000). Why Don’t Men
Ever Stop to Ask for Directions? Gender, Social
Influence, and Their Role in Technology Acceptance
and Usage Behavior. MIS Quarterly, Vol. 24, No. 1.
Venkatesh, V., Morris, M., Davis, G., and Davis, F.
(2003). User Acceptance of Information Technology:
Toward a Unified View. MIS Quarterly, Vol. 27, No.
3.
Chuttur, M. (2009). Overview of The Technology
Acceptance Model: Origins, Developments and Future
Directions. Sprouts. Working Papers on Information
Systems, Vol. 9, No. 37.
Gahtani, S. A. (2001). The Applicability of TAM Outside
North America: An Empirical Test in United
Kingdom. Information Resource Management Journal,
pp. 37-46.
Sanjaya, I. (2005). Pengaruh Rasa Manfaat Dan
Kemudahan Terhadap Minat Berperilaku (Behavioral
Intention) Para Mahasiswa Dan Mahasiswi Dalam
Penggunaan Internet. Kinerj, Vol. 9, No. 2, pp. 113-
122.
Davis, F. D. (1989). Perceived Usefulness, Perceived Ease
of Use, and User Acceptance of Information
Technology. MIS Quarterly, Vol. 13, No. 3, pp. 319-
339.
Evaluation of Acceptance toward Decision Support Systems for New Student Admission Management
23
