
Analysis of the Effect of Consumer Price Fluctuations on Inflation in
the City of Medan
Fitrawaty
1
, Ainul Mardiyah
1
, Haikal Rahman
2
and Mohammad Joharis
3
1
Department of Economics, Universitas Negeri Medan, Medan –Indonesia
2
Department of Civil Engineering, Universitas Negeri Medan, Medan –Indonesia
3
Department of Indonesian Language Education, Universitas Negeri Medan, Medan –Indonesia
Keywords: Consumer Price Index, Inflation, Expenditure Groups
Abstract: Inflation as measured by the Consumer Price Index (CPI) in Indonesia is grouped into seven expenditure
groups consisting of: food products; processed food, beverages, cigarettes and tobacco; housing groups for
water, electricity and fuel; clothing groups; health groups; education, recreation and sports groups;
transportation, communication and financial services. Inflation that occurs can come from all expenditure
groups. This research becomes important, so that the policy determination bias relates the prices of all
expenditure groups. This study aims to identify; problems and causes, and the City of Medan inflation model.
The method used is the VECM method, which utilized the assumptions test, such as stationary test, lag length
test, stability test and cointegration test. The results of the study show that in the short term several variables
do not significantly influence the current inflation rate. The causes of inflation are education, recreation and
sports expenditure groups, whereas in the long term inflation contributors in the City of Medan are expenditure
groups in the health sector.
1 INTRODUCTION
The indicator that is often used to measure the
inflation rate is the Consumer Price Index (CPI).
Alterations in CPI from time to time indicate the price
movement of the package of goods and services
consumed by the community. Since July 2008, the
package of goods and services in the CPI hoop has
been carried out on the basis of the 2007 Cost of
Living Survey conducted by the Central Statistics
Agency (BPS). Furthermore, BPS will monitor the
development of prices of these goods and services on
a monthly basis in several cities, in traditional and
modern markets on several types of goods / services
in each city. (BPS, 2018)
Inflation as measured by CPI in Indonesia is
grouped into 7 expenditure groups (based on the
Classification of Individual Consumption by Purpose
- COICOP), comprising the Foodstuff Group;
Processed Food, Beverages and Tobacco Group;
Housing Group; Clothing Group; Health Group;
Education and Sports Group; and Transportation and
Communication Groups. (BI, 2018).
Inflation can be influenced by factors that come
from the supply side (such as the occurrence of many
requests but the offer of goods and services still low/
rare), or shocks (such as increases world oil prices
and crop or flood disturbances). Of the weights in the
CPI hoop, inflation weighted by surprise factors is
represented by a volatile food group. administered
prices (hence commodity prices are determined by the
government) which cover approximately 40% of the
CPI weight. Furlog in Astari (2015) states that price
fluctuations in food commodities can be used as
indicators of inflation because they have the ability to
respond quickly to various economic shocks that
occur, such as increased supply and demand blow. In
Ikhsan 2010, if it were viewed based on aggregation,
inflation rates for volatile food are always above core
inflation and general inflation and move with high
volatility.
Several results of Bank Indonesia's studies stated
that the contribution of volatile foods to inflation in
Indonesia was significant and ranked second after
core inflation. Therefore, it can be said that the high
level of food inflation is a factor driving the high level
of general inflation. In addition, persistent food
Fitrawaty, ., Mardiyah, A., Rahman, H. and Joharis, M.
Analysis of the Effect of Consumer Price Fluctuations on Inflation in the City of Medan.
DOI: 10.5220/0009492900650070
In Proceedings of the 1st Unimed International Conference on Economics Education and Social Science (UNICEES 2018), pages 65-70
ISBN: 978-989-758-432-9
Copyright
c
2020 by SCITEPRESS – Science and Technology Publications, Lda. All rights reserved
65

inflation has an impact on relatively high inflation in
Indonesia (Ikhsan, 2010). Thus, the ability of Bank
Indonesia to control inflation is very limited if there
were very strong shocks as when there was an
increase in fuel prices which caused a surge in
inflation.(BI, 2018). Inflation in North Sumatra
Province has a relatively low level of persistence.
Low inflation persistence indicates that inflation
requires a relatively fast time to return to its natural
value after a shock. The inflation persistence of North
Sumatra Province is affected by the shock that occurs
in the components of administered prices and volatile
foods. Commodity groups that contribute greatly to
inflation persistence are health groups and food
groups (Surya, 2013).
Based on data from the 2012 survey Cost of
Living (CLS) conducted by the Central Bureau of
Statistics, Indonesia's population expenditure on food
consumption reached 31 percent in 2014. With the
number of poor people in Indonesia reaching 27.7
million (10.96 percent) in 2014, hence the increase in
prices on food commodities affects the welfare of all
Indonesian population in general and the poor in
particular. Empirical studies show that the poor at the
national and regional levels are very sensitive and
vulnerable to the increase in food inflation that has
occurred in recent years (Pratikto & Ikhsan, 2015).
Food inflation may come from the demand side if
there is an increase in household income that affects
demand so that it can push up food prices. Since the
price of food is relatively flexible, the increased
movement of the price of food can be an indicator of
increasing demand in general. If this is the problem,
then the increase in food prices should be an early
signal for the central bank to tighten monetary policy
(Soskic, 2015).
This classification of expenses based on COICOP
can be used as an illustration of how the cost of living
in the city of Medan. As one of the big cities in
Indonesia, of course, it needs relatively more
expensive costs than if you lived in the district.
Medan as the provincial capital is the center of
education, tourist destinations, trade, and the center
of government so it is only natural that many people
want to live in Medan. This condition induces an
increase in the cost of living will be higher. Which
expenditure groups from the seven groups that will
give the largest contribution to inflation in the city of
Medan? This discussion is important because it can
serve as the basis of policy making in order of
priority.
2 LITERATURE REVIEW
Generically, the theory of inflation can be categorized
into three theory; the Quantity (Irving Fisher Theory),
Keynes's Theory, and Structuralist Theory. Each
highlights certain aspects of the inflation process and
each is not a complete inflation theory that covers all
the important aspects of this price increase process.
There is no theory that really suits the condition of a
country, so that policy making cannot only refer to
one theory, but a mixture of several theories.
Quantity Theory (Irving Fisher's Theory), This
theory is a theory that is still very useful for analyzing
the causes of the emergence of inflation in this
modern era, especially in developing countries. This
theory highlights the role in the process of inflation
which is caused by two factors: the money supply and
expectations.
Keynesian theory, according to this theory,
inflation occurs because people want to live beyond
the limits of their economic capacity. Thus the public
demand for goods exceeds the amount available. This
happens because people know their desires and make
those desires in the form of effective requests for
goods. In other words, the community succeeded in
obtaining additional funds beyond the limits of their
economic capacity so that these groups of people
could obtain goods that were larger than they should.
The Structuralist Theory believes that inflation
occurs due to an imbalance in the economy.
According to Boediono (1998), this theory can be
called the theory of long-term inflation, because
inflation is associated with structural factors of the
economy that can only change gradually and in the
long run. Most structuralist theory analyzes reflect
cases of inflation in developing countries. There are
economic shocks originating from within the country,
for example crop failure (due to external factors that
are too fast for seasonal changes, natural disasters,
etc.); or matters that are related to foreign relations,
for example deteriorating terms of trade, production
rigidity, foreign debt, and foreign exchange rates, can
cause price fluctuations in the domestic market.
(Utari, et al, 2015).
3 RESEARCH METHOD
This study aims to determine interactional and
dynamic responses between variables, so that the
analytical method which is suitable to resolve the
conducted research by using the Vector
Autoregression (VAR) approach. VAR was first
proposed by Christopher Sims (1980).
UNICEES 2018 - Unimed International Conference on Economics Education and Social Science
66

The stages of analysis to conduct analysis using
VAR can be elaborated as follows. After carrying out
all assumptions; such as stationary test, lag length
test, data stability test, cointegration test, the next step
is estimating the VAR Model. Vector Autoregression
(VAR) is a method that treats all variables
symmetrically without questioning the dependent and
independent variables (Sims in Gujarati 2003: 848).
Analysis of Vector Autoregression (VAR) in this
study was used to analyze the impact of fluctuations
in the consumer price index (CPI), which consists of
several groups of expenditure, namely, food product;
processed food, beverages, cigarettes and tobacco;
housing, water, electricity, gas and fuel; clothing;
health; education, recreation and sports;
transportation, communication and financial services.
From the variables used, the research model can be
formed as follows:
……………………..1
Where
Ln Y = Inflation at year t
t
This Impulse response is one of the important
analyses in the VAR model. Impulse response
analysis is used to determine the response of
endogenous variables in the VAR system to shock
certain variables. The resulting response can be
positive, negative and not responding. Positive
response due to its position above the horizon line and
in the same direction, negative response due to its
position below the horizon line and opposite
direction, while not responding is indicated by a
graph where the response tends to be horizontal near
the horizon line (Widarjono, 2007). Impulse response
analysis is also used to analyze short, medium and
long term to see the shock of one other variable and
how long the influence occurs. Based on the research
observation period for the short term, which is a
period of one year (Q1 / 2005 to Q4 / 2005); medium
term is a five-year period (Q1 / 2006 to Q4 / 2009);
and the long term is a period of more than five years
(Q1 / 2010 to Q4 / 2017).
Test Variance Decomposition (VD), Analysis of
Variance Decomposition (VD) illustrates the relative
importance of each variable in the VAR system for
their shock. Variance decomposition in VAR aims to
analyze how much the contribution of a variable to
another variable. The VD equation can be derived
with the following illustration:
………………………….....2
The values A_0 and A_1 are used to estimate the
future value of X_ (t + 1)
……………….3
This means that the value of VD is always 100
percent, the value of VD is higher explaining the
contribution of variants of one variable transmit to
other transmit variables higher.
4 RESULTS AND DISCUSSIONS
From the results of stationary data testing for all
variables studied, it can be seen that LnX2 and LNY
data are stationary at level 1 (level), while other data
are stationary at the level of first different, namely;
LnX2, LnX3, LnX4, LnX5, LnX6, where the ADF-
test value is greater than the critical level of
confidence (1%, 5%, 10%).
This optimal lag length test is very useful to
eliminate autocorrelation problems (correlation
between period t interrupts with t-1 errors sorted by
time) in the VAR system. Based on the provisions,
the use of optimal lag is three.
Before entering the further analysis stage, the
estimation equation VAR system which has been
formed to be tested is stability.Based on the stability
test results (the VAR model) shows that the modulus
of the entire root unit <1 and is based on image
inverse characteristic roots of AR polynomial it can
be seen that all the root (illustrated by a dot) is in a
circle so it can be concluded that the model
specifications are stable. It can be concluded that the
estimated VAR that will be used for IRF and VD
analysis is stable and valid.
Furthermore, the cointegration test will be carried
out using the Johansen method According to the table
Johansen cointegration test method is known that
there are four cointegrated equations because it has
trace values which are statistically greater than the
critical Johansen value 5%. It can be concluded that
the data is cointegrated or that there is a long-term
relationship between research variables. The
cointegration test results indicate that between LnY,
LnX1, LnX2, LnX3, LnX4, LnX5, LnX6, LnX7
Analysis of the Effect of Consumer Price Fluctuations on Inflation in the City of Medan
67
movements have long-term stability and balance and
similar movements. In other words, in each short-
term period, all variables tend to adjust to each other,
to achieve long-term equilibrium. Because
cointegration occurs, the VAR in difference
estimation cannot be done, otherwise this research
will use VECM estimation.
Vector Error Correction Model (VECM)
After doing several previous tests, it was found that
the data was stationary at the 1st level difference and
cointegration occurred, then the next step was to form
a VECM model. VECM shows short-term and long-
term relationships. In the short term, the variables in
the study will tend to adapt to other variables to form
long-term equilibrium. The following are the results
of estimation of VECM lag 2 based on the LR, FPE,
AIC and HQ criteria in determining the optimal lag:
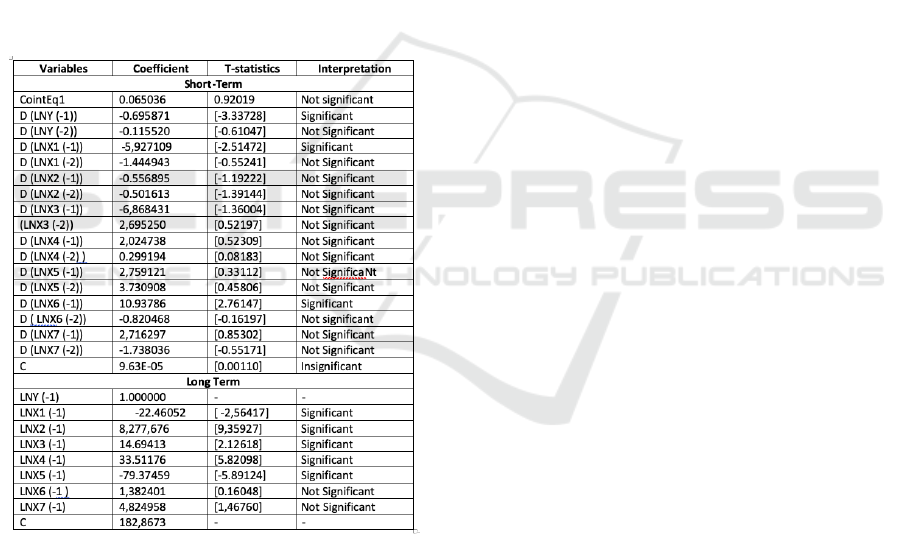
Table 1: VECM Estimation of Short-Term and Long-
Term INF
Source: EViews 10 (Processed)
Results of VECM estimation with Lag-2 Tabel 1.1
for observation periods 2001: 1-2016: 4 , the VECM
model for food, beverages, cigarettes and tobacco;
housing, water, electricity, gas and fuel; clothing,
health, education, recreation and sports and
transportation, communication and financial services
groups.
Short-term inflation model for The City of Medan
D (LNY) = 9.63E-05 - 0.695871 D (LNY (-1)) -
0.115520 D (LNY (-2)) - 5.927109D (LNX1 (-1)) -
1.444943 D (LNX1 (-2)) - 0.556895 D (LNX2 (-1)) -
0.501613 D (LNX2 (-2)) - 6,868431 D (LNX3 (-1)) +
2,695250 D (LNX3 (-2)) + 2,024738 D (LNX4 (-1))
+ 0.299194 D (LNX4 (-2)) +2.759121 D (LN5 (-1))
+ 3.730908 D (LNX5 (-2)) + 10.93786 D (LNX6 (-
1)) - 0.820468 D (LNX6 (-2)) + 2.716297 D (LNX7
(-1)) - 1.738036 D (LNX7 (-2)) + 0.065036 ECT.
While the long-term model for The City of
Medan Inflation Model, can be describes as follows:
LNINF = 182.8673 + 1.000000 LNY (-1) - 22.46052
LNX1 (-1) + 8.277676 LNX2 (-1) + 14.69413 LNX3
(-1) + 33.51176 LNX4 (-1 ) -79.37459 LNX5 (-1) +
1.382401 LNX6 (-1) + 4.824958 LNX7 (-1)
The Largest Causes and Contributors of Inflation
in the short term in The City of Medan
Based on the results presented in Table 1.1 it is known
that in the short term (in 2001: 1 - 2001: 4) most
expenditure groups did not have a significant effect
on the inflation rate at the 5% level, meanwhile, in the
long term (most expenditure groups had a significant
effect on the inflation rate in the field cities such as
processed food, beverages, cigarettes and tobacco;
housing, water, electricity, gas and fuel oil; clothing,
and health, while the education, recreation and sports
and transportation, communication and financial
services has no significant effect on inflation in the
city of Medan.
In the short term (period of one year) is a very
reasonable matter: the increase or decrease in prices
of the expenditure group does not have a significant
effect on the inflation rate in the city of Medan. This
condition occurs because every process in the
economy requires time (time lag) to show its
influence on economic conditions.
In the short term, each expenditure group has a
different influence on inflation, either from the
direction of influence or from the magnitude of its
influence. From the results of the Vector Error
Correction Model (VECM) estimation, it was found
that the biggest contributors to inflation were Ln X6
expenditure groups, notably education, recreation and
sports expenditure groups. Changes in the lifestyle of
the people become more hedonistic (luxurious style),
meaning that people see education not just learning
subjects, but extracurricular school facilities and
activities are also a consideration when parents want
to choose school. The growing number of schools
with various extracurricular activities and facilities,
as evidence of the increasing number of community
requests for schools. Informal activities as a support
for the learning process at school are also growing,
and are in great demand by the community, such as
courses such as tutoring, developing sports courses,
UNICEES 2018 - Unimed International Conference on Economics Education and Social Science
68

art courses and developing children's talents and
personalities. This is a household expenditure post
which also costs quite tremendous. Interest and
change in people's tastes, resulting in large
expenditure items.
Likewise, with recreation that has become a
necessity amid increasingly busy community
activities, from the cheapest suburban recreation to
the city center at an expensive cost, all become the
target of the community, especially on weekends and
holidays. Recreation are not just for the upper middle
class, but also for the lower class, which has followed
the lifestyle of the city.
Increasing public awareness of healthy living,
resulting in sports activities, is also increasingly in
demand. Throughout the age of children, adolescents
and parents, consider exercise absolutely essential.
This condition has caused businesses in the field of
sports to also develop. Community interest in sports,
resulting in people not reluctant to spend a certain
amount of money to be able to follow it.
The Largest Causes and Contributors of Inflation
in the Long-term in The City of Medan
From the estimation results of VECM, in the long-
term expenditure group which is a contributor to
inflation in the city of Medan is an expenditure group
in the health sector. The more advanced a region, the
level of health awareness is increasing.
The large number of subsidies provided by the
government, such as BPJS which provide cheap
services to all levels of society, has resulted in an
increase in public health. Generic drug services also
help alleviate public health expenditures.
Government hospital services like Adam Malik and
Pringadi Hospital are getting better, with more
complete facilities that can meet the needs of the
community so that the level of health is likewise
increasing.
5 CONCLUSIONS
1. The problem of inflation in Medan City is caused
by several expenditure groups. The food
expenditure group turned out to be not the
biggest contributor to inflation in Medan City.
Scarcity of goods and weather factors are still a
major problem for retail traders so that the
buying price of traders becomes expensive.
2. The main causes of inflation in the short term are
education expenditure groups, because those that
include education costs are not only school
tuition fees, but supporting facilities,
increasingly extracurricular activities, and are
quite expensive.
3. The main causes of inflation in the long term are
in the fields of health, recreation and sports. The
shift in people's tastes, a hedonic lifestyle and
luxury, make recreation a necessity. The level of
awareness of healthy lifestyles is also increasing,
so that sports facilities, public open parks, sports
facilities are growing.
4. Some expenditure group variables have no
significant effect on the occurrence of inflation
in the short term. This happens naturally, because
economic symptoms including price increases
require time to show their influence. Conversely,
the seven expenditure groups have a significant
effect on the long term.
REFERENCES
Bernanke, B.S., & Mihov, I. (1998). Measuring Monetary
Policy. The Quarterly Journal of Economics, 113 (3),
869–902. DOI:
https://doi.org/10.1162/003355398555775
Boediono. (1998). Monetary Economics. Yogyakarta:
BPFE.
Dharma S. (2014). Analysis of the role of the regional
inflation monitoring and control team (TPID) on
inflation control in the province of North Sumatra,
Journal of Economics and Finance Vol.
Fitrawaty, (2016). Analysis of Instrument Interdepency of
Monetary Policy through Indonesia's Indonesia's
Economic Growth, Proceedings of AISTEEL, The
First Annual International Seminar, on
Transformative Education and Educational
Leadership, State University of Medan, Indonesia.
Fitrawaty, (2017). Analysis of Shock Inflation through
Indonesia's Economic Growth, Proceedings,
International Conference on Global Education V,
Ekasakti University, Padang - Indonesia, Universiti
Kebangsaan Malaysia, Bangi-Malaysia.
Fitrawaty, 2017, The Analysis of Instrument
Interdependency of Monetary Policy through the
Indonesian of Unemployment, Proceeding UNICEB,
Unimed International Conference on Economics of
Business 2017, State University of Medan, Indonesia.
Furlong, F, & Ingenito, R. (1996). Commodity Prices and
Inflation. Federal Reserve Bank of San Francisco
(FRBSF) Economic Review, 2, 27-4
Analysis of the Effect of Consumer Price Fluctuations on Inflation in the City of Medan
69

Ikhsan, M. (2010). Macro Economic Policy Specifically in
Price Stabilization and Poverty Reduction. Speech
inauguration of Professor of Economics, Faculty of
Economics, University of Indonesia.
Lee, H., & Park, C. (2013). Asian Development Bank
Economics Working Paper Series No.363.
Pratikto, R. & Ikhsan, M. (2015). Inflation and Poverty:
Implications for Monetary Policy. Presented at the
Indonesian Economic Development Academic
Seminar (SAPEI) 2015.
Soskic, d., (2015). Impact of Food Prices Inflation: Case of
Serbia., Economics of Agriculture., UDC:
338,516.49: 336.748.12: 338.439.4 ( 497.11) 1/2015.
Utari.gad, Cristina.rs, Pambudi. S, (2015), Inflation in
Indonesia: Its Characteristics and Control,
Nationality Series No. 23.
UNICEES 2018 - Unimed International Conference on Economics Education and Social Science
70
