
Identification of Variables That Improve the Reveneus of
Entertainment Tax in the City of Batam City with GRDP Price Apply
as Moderating Variable
Haposan Banjarnahor
1
and Syarif Hidayah Lubis
1
1Faculty of Sosial Sciences and Humanities, Universitas Putera Batam, Batam –Indonesia
Keywords: Entertainment Taxpayer, Number of Population, Number of Foreign Tourists, Inflation
Abstract: This study aims to examine and analyze the effect of the number of entertainment taxpayers, the number of
population, the number of foreign tourists and inflation rate on entertainment tax revenues and the Gross
Regional Domestic Product (GRDP) at current market price as a moderating variable. This study uses
quantitative research by obtaining secondary data while the technique of collecting data is documentation
which is recording and copying the data. The population number of this study is obviously unlimited and the
sampling method is non probability sampling. The data observed are based on the publication data in the
year of 2015 to 2017 which comprises of 36 different data. The study applies multiple linear regression test
models. The study found that all independent variables simultaneously have a positive and significant effect
on dependent variable. The study also found that inflation rate is the only variabel that partially does not
have a significant effect on the dependent variable while the GRDP) at current market price can moderate
each variable towards entertainment tax revenues.
1 INTRODUCTION
Regional autonomy provided by the central
government give the independence and flexibility
for local government to govern and manage
community within its administrative area in
accordance with regulations which in the end is
expected to improve people's welfare. This is
indicated by the issuance of Law No. 32 /2004
which was revised into Law No. 23/2014 concerning
Regional Government (Republik Indonesia, 2014).
The municipality of Batam is one of the regions
that is given the autonomy right to manage its own
government affairs even the city itself is assisted by
the Batam Development Agency (BP Batam) as an
extension of the central government to govern the
city. In carrying out regional autonomy or
governance, the municipal government requires
funds for the operations of its activities as adopted in
the budget for regional expenditure (APBD). The
genuine regional income itself is a very potential
financial source and it must be increased to finance
the expenditure or operations of the government.
The role of regional taxes and levies as the main
source of regional income beside the balance funds
obtained from the exploitation of natural resources
will greatly determine the strength of the Regional
Budget (APBD) (Darwin, 2010). With the existence
of these funding sources, regional communities will
also enjoy their development while in the same time
every citizen must be aware that by increasingly
enjoying the results of development the people's
responsibility for taxes in the implementation of
development is even greater (Wardani and Asis,
2017).
The obligation of a country is to serve the needs
of its people as well as the region. To be able to
serve the needs of the people of the region, the
regions need to be given authority both in terms of
government politics and finance to finance their
activities (Darwin, 2010). Therefore, Law No. 33
/2004 concerning Financial Balance between the
Central Government and the Regional Government
and Law No. 28/2009 concerning Regional Taxes
and Regional Retributions as a source of regional
finance even supported by the existence of the MPR
Decree Number XV/MPR/1998.
Banjarnahor, H. and Lubis, S.
Identification of Variables That Improve the Reveneus of Entertainment Tax in the City of Batam City with GRDP Price Apply as Moderating Variable.
DOI: 10.5220/0009500910111019
In Proceedings of the 1st Unimed International Conference on Economics Education and Social Science (UNICEES 2018), pages 1011-1019
ISBN: 978-989-758-432-9
Copyright
c
2020 by SCITEPRESS – Science and Technology Publications, Lda. All rights reserved
1011

The Law No. 33/2004 states that every region
has a regional regulation (Perda) under the central
laws or even bound by the central law (Republik
Indonesia, 2004). The municipal governmeny of
Batam issued Perda No. 15/2001 concerning the
regional tax of the municipal as an alternative
financing for the government to implement regional
autonomy (Pemerintah kota Batam, 2001).
In the tax context, considering that Batam
geographical area is an industrial city where the
majority of the population is industrial workers, it
requires entertainment place and facilites to reflect
their mind. The subject of entertainment tax is an
individual who enjoys entertainment and a business
entity that organizes entertainment. Therefore the
large number of residents both domiciled or regional
and foreign tourists have a contribution in
entertainment tax revenues. Even the municipal
governmet itself wants the city to be placed not only
for industrial side but also for tourist destination so
that the increase in taxpayers, residents and tourists
is a potential object for the municipal government to
increase its local income. The size of the central
tax and regional tax revenues will be largely
determined by the population (Musgrave in Lubis,
2017). (Wardhono, Indrawati and Gema, 2012) In
the results of Musgrave’s research, it was stated that
one of the potential taxes is entertainment tax.
"Taxes that are very potential are derived from the
hotel and restaurant tax, entertainment tax, public
street lighting tax and class C mining tax".
The municipal city of Batam is also an area that
is very close to Singapore and Malaysia. The high
number of tourist visitors outside of the region and
abroad as well as the great number of people
working in the city work requires entertainment
faciliies and the tourism sector is expected to
increase the city genuine income (PAD) from the
entertainment tax sector.
Macroeconomic stability is one of the important
conditions for maintaining sustainable growth and
achievement of development targets so that the
inflation rate and per capita income also bring
contribution in entertainment tax revenues. The
inflation rate is one of the important components in
influencing economic stability since inflation and
income are related to the prices of basic and general
goods. Inflation is a process of increasing prices that
prevail in an economy (Sukirno, 2002). Therefore
the public will be more inclined to choose to
withhold financial expenses even for entertainment
and travel if income and expenses are not balanced.
The following data is the target and realization of
the revenues from the entertainment tax in the
municipal city of Batam for the year of 2015-2017.
Table 1: Target & Realization Revenues of
Municipal City of Batam in 2015-2017
Year Realization Target
2015 14,959,000,000 17,471,447,712
2016 20,645,400,000 19,995,079,994
2017 24,608,000,000 23,806,496,302
Source: Dispenda Kota Batam (2018)
2 THEORICAL FRAMEWORK
Local Tax
The definition of tax according to Rochmat
Sumitro in Darise (2009) is “the contribution of the
people to the state treasury based on the law (which
is forced) by not receiving reciprocal services
(counter-achievements) which can be directly shown
and used to pay for public expenditure” (Darise,
2009). While Darwin in a book entitled “regional tax
and regional retribution (2010)”, proposed the
regional taxes in general are taxes those are
collected by the regions based on tax regulations
stipulated by the regions for the benefit of local
government household financing as public legal
entities (Darwin, 2010).
From the above mentioned definition, it can be
concluded that regional taxes have these elements:
obligatory contributions or coercion to the, indirect
or reciprocal benefit for paying taxes and it used for
public or public purposes.
Entertainment Taxpayer
Darise (2009) defines entertainment as all types of
shows, games, dexterity games, and/or crowds with
any name and form, which is watched or enjoyed by
everyone with a fee, not including the use of
facilities for exercise (Darise, 2009). In the local
government regulation, Perda No. 7/2017 on article
17/2 states that “entertainment taxpayers are
individuals or bodies that organize
entertainment”.The object of entertainment tax is
entities or institution that organizes entertainment
and picks up and or receives fees from the business
(Pemerintah kota Batam, 2017). The Perda No.
7/2017 furthermore states the entertainments ranging
from film show; performances of art, music, dance;
bodybuilding, and the like; exhibition; circus,
acrobatics, and magic; billiard game; bowling game;
horse racing/motorized vehicles; fitness center;
sports match; fashion shows, beauty counters;
discotheques, karaoke, night clubs, and the like;
massage parlor, reflection, steam bath/spa; and
dexterity game (Pemerintah kota Batam, 2017).
UNICEES 2018 - Unimed International Conference on Economics Education and Social Science
1012

Number of Population
Population is a number of legitimate people who
inhabit an area or country and obey the provisions of
that region or country. The amount of regional
genuine income can be influenced by the population,
if the population increases, the income drawn will
also increase (Asmuruf, Rumate and Kawung,
2015).
Foreign Tourists
The word "tourist" comes from Sanskrit "wisata"
which means "travel" which can be equated with the
word "travel" in English. Tourists are the same as
the word "traveler" which is a person who travels
(sihotang, 2015). The large number of tourists both
foreign and domestic tourists who visit tourism
objects (Nugraha, 2014).
Inflation
Inflation is a measure of the economy that gives an
idea of the rising average prices of goods and
services produced in an economic system (Yulianti
and Suratno, 2015).
GRDP at Current Market Price
Measuring the progress of an economy requires the
right measuring instrument, in the form of a measure
of economic growth for instance Gross Domestic
Product (GDP) or at the regional level called Gross
Regional Domestic Product (GRDP) which is the
amount of goods or services produced by an
economy within time of one year and stated in
market prices (Supartoyo, Tatuh and Sendouw,
2013).
3 RESEARCH METHOD
Types and Data Sources
The data used in this study are secondary data on
entertainment tax revenues for 3 different years
with monthly observations (time series) from
January 2015 to December 2017. The data consists
of reports on entertainment tax revenues, the number
of entertainment taxpayers, residents, foreign
tourists, inflation and GRDP at market prices in the
municipal city of Batam.
To test the classic assumption on this secondary
data, the researcher conducted a normality test,
multicollinearity test, and autoclaving test.
a. Normality Test
The normality test aims to test whether in the
regression model, the independent variable and the
dependent variable both have a normal distribution
or not (Ghozali, 2013). Normality testing in this
study uses the Kolmogrov-Smirnov testing method
and histogram diagram. The decision making criteria
are:
1. If the value is sig. or probability> 0.05, then the
data is normally distributed.
2. If the value is sig. or probability <0.05, then the
data is not normally distributed.
It can also be seen on the histogram diagram
where the basis for decision making is that if the
histogram chart is not leaning left and right, the
research data is normally distributed, and vice versa.
b. Multicolliearity Test
The multicollinearity test was conducted with the
aim to find out whether the regression model found a
correlation between the independent variables. To
detect whether a regression model has
multicollinearity, it can be checked b using VIF.
VIF stands for Variance Inflation Factor. VIF value
<10 means that there is no serious multicollinearity
in the regression model.
c. Heterocedasticity Test
Heterocedasticity is a residual variant that is not
constant in regression so that the accuracy of the
predicted results becomes dubious. The model used
is to use a scaterplot graph. Multiple linear
regression models are said to have no
heterocedasticity if the physical residue does not
form a pattern so the data is free from assumptions
about heterocedasticity.
d. Auto Correlation Test
The auto correlation test aims to test whether in the
model, linear regression there is a correlation
between disturbing errors in period t with errors in
period t-1 (before). This problem arises because the
residuals are not free from one observation to
another. Detection of the presence or absence of
autocorrelation in this study is by looking at the
calculated value of Durbin Watson by selecting the
following autocorrelation test:
a. If d <dL, there is autocorrelation
b. If d> dU there is no autocorrelation
If dL <d <dU then the test is not convincing or there
are no definite conclusions.
Multiple Regression Test
To find out the influence of the independent
variables partially and simultaneously has a
significant effect on the dependent variable; the
statistical analysis used is to use multiple regression
analysis. The testing of the moderating variable uses
the residual test, where the multiple regression
Identification of Variables That Improve the Reveneus of Entertainment Tax in the City of Batam City with GRDP Price Apply as
Moderating Variable
1013

equation in model I and residual test in model II,
namely:
Y =
0
+ β
1
X
1
+ β
2
X
2
+ β
3
X
3
+ ε…….
Y = Entertainment Tax Receipt Report
b0 = Intercept
b1=Regression Coefficient Number of entertainment
taxpayers
b2 = Population Regression Coefficient
b3 = Regression coefficient of foreign tourists
b4 = Inflation Regression Coefficient
X1 = Number of entertainment taxpayers
X2 = Number of residents
X3 = Number of foreign tourists
X4 = Inflation
Y = Entertainment tax review report
E = error
Research Hypothesis Test
The method used to test the first hypothesis uses
multiple regression analysis. The first hypothesis is
tested by determining the level of significance with
the simultaneous test (F test and R2 Test) and the
partial test (t- test) as follows:
a. Determination Test (R
2
)
Determination Test (R2) is used to measure the
extent of the ability of the model to explain the
variation of the dependent variable. The coefficient
of determination is between zero and one. A value
close to one means that the independent variables
provide almost all the information needed to predict
variations in the dependent variable. From the above
research using more than 2 variables, then adjusted
R square is used because it is more accurate than R2.
b.Test F Statistic (Simultaneous Significance
Test)
F test aims to determine the effect of independent
variables and the dependent variable simultaneously.
To find out whether there is a significant effect of
each independent variable on a dependent variable.
Significantly free at 0.05, can be concluded
(Ghozali, 2013). Guidelines used to accept or reject
hypotheses, which is: The hypothesis is accepted if
F-count> F-table, or p-value in the sig column.
<level of significant (α) 5%. The hypothesis is
accepted if F-count <F-table, or p-value in the sig
column. > level of significant (α) 5%.
c. Statistical test t (Partial Significance Test)
The t statistical test basically shows how far the
influence of one explanatory variable individually in
explaining the dependent variables (Kuncoro, 2013).
This test is used to determine the effect of the
number of taxpayers, population numbers, number
of foreign tourists, the number of variable inflation
towards variables, namely entertainment tax
receipts. Guidelines used to accept or reject
hypotheses, which is: The hypothesis is accepted if t
count> t-table or p-value in the sig column <level of
significant (α) 5%. The hypothesis is accepted if t
count <t-table or p-value in the sig column. > level
of significant (α) 5%.
d. Moderation Test (Residual Test)
Moderation Test (residual test) is used to test
whether the variable Z (GRDP) is able to moderate
the relationship between variables X to variable Y.
The calculation in this study, first calculated the
correlation coefficient using SPSS 19 with model I
as follows:
Z = α + bıXı + b2X2 + b3X3 + b4X4 + e ... (1)
| e | = α + b5Y .... (2)
4 ANALYSIS
To test the classic assumption on this secondary
data, the researcher conducted a normality test,
multicollinearity test, and autoclaving test.
a. Normality Test
The normality test aims to test whether in the
regression model, the independent variable and the
dependent variable both have a normal distribution
or not (Ghozali, 2013). Normality testing in this
study uses the Kolmogrov-Smirnov testing method
and histogram diagram. The decision making criteria
are:
1. If the value is sig. or probability> 0.05, then
the data is normally distributed.
2. If the value is sig. or probability <0.05, then
the data is not normally distributed.
It can also be seen on the histogram diagram where
the basis for decision making is that if the histogram
chart is not leaning left and right, the research data is
normally distributed, and vice versa.
b. Multicolliearity Test
The multicollinearity test was conducted with the
aim to find out whether the regression model found a
correlation between the independent variables. To
detect whether a regression model has
multicollinearity, it can be checked b using VIF.
VIF stands for Variance Inflation Factor. VIF value
<10 means that there is no serious multicollinearity
in the regression model.
UNICEES 2018 - Unimed International Conference on Economics Education and Social Science
1014

c. Heterocedasticity Test
Heterocedasticity is a residual variant that is not
constant in regression so that the accuracy of the
predicted results becomes dubious. The model used
is to use a scaterplot graph. Multiple linear
regression models are said to have no
heterocedasticity if the physical residue does not
form a pattern so the data is free from assumptions
about heterocedasticity.
d. Auto Correlation Test
The auto correlation test aims to test whether in the
model, linear regression there is a correlation
between disturbing errors in period t with errors in
period t-1 (before). This problem arises because the
residuals are not free from one observation to
another. Detection of the presence or absence of
autocorrelation in this study is by looking at the
calculated value of Durbin Watson by selecting the
following autocorrelation test:
a. If d <dL, there is autocorrelation
b. If d> dU there is no autocorrelation
c. If dL <d <dU then the test is not convincing or
there are no definite conclusions.
Multiple Regression Test
To find out the influence of the independent
variables partially and simultaneously has a
significant effect on the dependent variable; the
statistical analysis used is to use multiple regression
analysis. The testing of the moderating variable uses
the residual test, where the multiple regression
equation.
Research Hypothesis Test
The method used to test the first hypothesis uses
multiple regression analysis. The first hypothesis is
tested by determining the level of significance with
the simultaneous test (F test and R2 Test) and the
partial test (t- test) as follows:
a. Determination Test (R2)
Determination Test (R2) is used to measure the
extent of the ability of the model to explain the
variation of the dependent variable. The coefficient
of determination is between zero and one. A value
close to one means that the independent variables
provide almost all the information needed to predict
variations in the dependent variable. From the above
research using more than 2 variables, then adjusted
R square is used because it is more accurate than R2.
b.Test F Statistic (Simultaneous Significance
Test)
F test aims to determine the effect of independent
variables and the dependent variable simultaneously.
To find out whether there is a significant effect of
each independent variable on a dependent variable.
Significantly free at 0.05, can be concluded
(Ghozali, 2013: 98 ) Guidelines used to accept or
reject hypotheses, which is: The hypothesis is
accepted if F-count> F-table, or p-value in the sig
column. <level of significant (α) 5%. The hypothesis
is accepted if F-count <F-table, or p-value in the sig
column. > level of significant (α) 5%.
c. Statistical test t (Partial Significance Test)
The t statistical test basically shows how far the
influence of one explanatory variable individually in
explaining the dependent variables (Kuncoro, 2013).
This test is used to determine the effect of the
number of taxpayers, population numbers, number
of foreign tourists, the number of variable inflation
towards variables, namely entertainment tax
receipts. Guidelines used to accept or reject
hypotheses, which is: The hypothesis is accepted if t
count> t-table or p-value in the sig column <level of
significant (α) 5%. The hypothesis is accepted if t
count <t-table or p-value in the sig column. > level
of significant (α) 5%.
d. Moderation Test (Residual Test)
Moderation Test (residual test) is used to test
whether the variable Z (GRDP) is able to moderate
the relationship between variables X to variable Y.
The calculation in this study, first calculated the
correlation coefficient using SPSS 19.
5 RESULTS AND DISCUSSION
The result of the study are described as follows:
Classical Assumption Test Results
a. Normality test
The above normality test table found a significance
value of 0.986 so that it can be said explicitly that
the dependent variable has been normally
distributed.
Tabel 2: Normality test
One-Sample Kolmogorov-Smirnov Test
Entertainment
Tax Receipt
N 36
Normal Mean 1702028443
Identification of Variables That Improve the Reveneus of Entertainment Tax in the City of Batam City with GRDP Price Apply as
Moderating Variable
1015
Parameters
a,b
Std. Deviation 254709276.3
Most
Extreme
Differences
Absolute 0.076
Positive 0.076
Negative -0.068
Kolmogorov-Smirnov Z 0.453
Asymp. Sig. (2-tailed) 0.986
a. Test distribution is Normal.
b. Calculated from data.
b. Multicolliearity Test
Table 3: Multicolliearity Test
Coefficients
a
Model
Collinearity Statistics
Tolerance VIF
entertainment
taxpayer
0.944 1.059
number of
population
1.000 1.000
Number of foreign
tourists
0.960 1.042
inflation 0.979 1.022
GRDP prices apply 1.000 1.000
a. Dependent Variable: entertainment tax revenue
Based on the table above, it shows that the tolerance
value of statistics is ≤ 0.10 and VIF ≤ 10. So it can
be concluded that there is no multicolliearity or
correlation between independent variables.
c. Heteroscedasticity
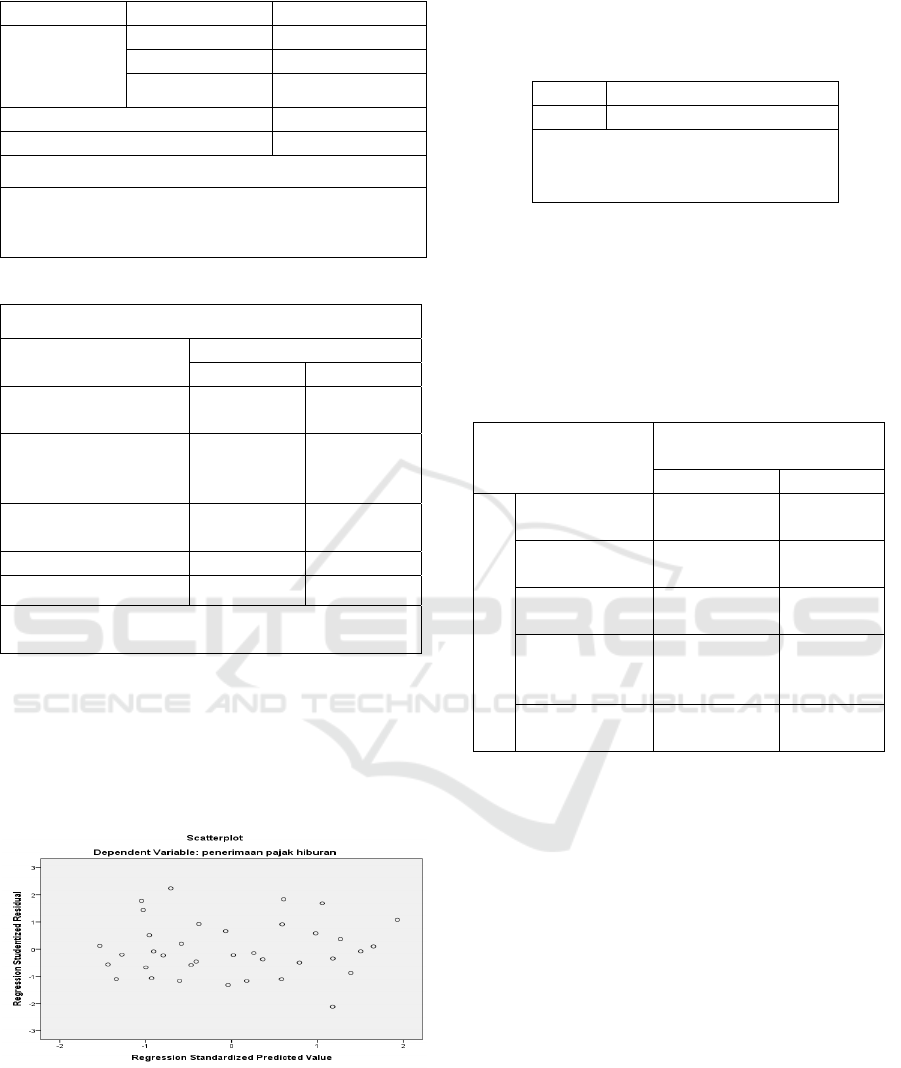
Figure 1: Scatterplot Heteroscedasticity
Based on the scatter plot above it can be seen
that there are spots that spread randomly, do not
form a certain pattern or are irregular so that the
linear regression model can be said to have no
heterocedasticity.
d. Autocorrelation Test
Table 4: Autocorrelation Test
Model Durbin-Watson
1 2.187
b. Dependent Variable:
entertainment tax revenue
In the above test results there is a Durbin-Watson
value of 2.187 while the sig 5% table value with n =
36 and the number k = 5 dU = 1.799 and dL = 1.175
means that in this table d> dU or 2.187> 1.799
means that autocorrelation does not occur.
Multiple Regression Test
Table 5: Multiple Regression Test
Model
Unstandardized
Coefficients
B Std. Error
1
(Constant) -987263383
79806896
77
entertainment
taxpayer
4585907.06
652159.0
92
Number of
population
5204.509 561.447
Number of
foreign
tourists
799.267 1577.955
Inflation -46873988
76185015
.6
a. Dependent Variable: Penerimaan
Based on the equation above, we can explain the
results of multiple linear regression tests as follows:
1. If the taxpayer (X1) experiences an increase of
one taxpayer, entertainment tax revenue (Y) has
increased by Rp. 4,585,907. In other words, if
there is an increase in entertainment tax
revenues, this is due to the increase in taxpayer
objects.
2. If the population (X2) has increased by one
person, then entertainment tax revenue (Y) has
increased by Rp. 5.204 In other words, if there is
an increase in entertainment tax revenues, this is
due to the increase in the number of residents
who enjoy every entertainment held.
3. If foreign tourists (X3) experience a one-person
increase, entertainment tax revenue (Y) will
increase by Rp. 799. In other words, if there is an
increase in entertainment tax revenues, this is
due to the increase in the number of foreign
UNICEES 2018 - Unimed International Conference on Economics Education and Social Science
1016

tourists who come and enjoy every entertainment
held.
4. If inflation (X4) experiences a one percent
increase, entertainment tax revenue (Y) has
decreased by Rp. 46,883,988. In other words, if
there is a decline in entertainment tax revenues,
this is due to rising inflation.
Test of Research Hypothesis
Table 6: Coefficient of Determination
Model Summary
Model R
R
Square
1 .827
a
0.683
a. Predictors: (Constant), (Constant), inflation,
Foreign tourists, entertainment taxpayer, total
population
Based on the table above, the value of the coefficient
(R) is 0.827 which shows the relationship between
the variables that are strong, with the coefficient of
determination (R square) of 0.683 in the medium
category. This value means that the variable number
of taxpayers, population growth, number of vehicles
and inflation can explain the variable of
entertainment tax receipts of 68.3%. While the rest
is influenced by other variables those are not
examined in the study.
Test F (Test Simultaneously)
Table 7: F Test (Test Simultaneously)
ANOVA
a
Model F Sig.
1
Regression 11.332 .000
b
Residual
Total
a. Dependent Variable: entertainment tax
revenue
b. Predictors: (Constant), inflation, Foreign
tourists, entertainment taxpayer, number of
population
In the table above, it can be seen that the
calculated F value is 11.332 with a significance of
0.000. With the use of a significance level (α) of 5%.
Based on the table obtained significant 0,000 <0.05
with a ratio of significant levels (α) of 5% shows
that simultaneously the variable number of
taxpayers, population, number of foreign tourists,
and inflation have a significant effect on
entertainment tax revenue. The results are
strengthened by comparing between F = 11.332
which is far greater than F
table
which is 2.53 where
F
table
is calculated using the provisions of a
significance level of 5%, with df = nk-1 (in this
study df = 36-5-1 = 30) , so that the obtained value
of F
table
is 2.53, then F
count
> F
table
or 11.332> 2.53 so
that it can be concluded that simultaneously all
independent variables have a positive and significant
effect or H
1
is accepted.
T test (Partial Test)
Table 8: T Test (Partial Test)
Coefficients
a
Model
Standardized
Coefficients
t Sig.
Beta
1
(Constant)
-
0.124
0.903
entertainment
taxpayer
0.821 7.032 0.000
Number of
population
0.846 9.270 0.000
Foreign
tourists
0.063 0.507 0.618
inflation -0.078
-
0.615
0.545
Based on the regression table above can be
explained as follows:
1 t
count
value (7,032)> t
table
(2,042) and significant
value (0,000) <0,05, then the number of
taxpayers has a significant effect on
entertainment tax revenue
2 t
count
(9.270)> t
table
(2,042) and significant value
(0,000) <0.05, then the population has a
significant effect on entertainment tax revenue.
3 t
count
(0.507) <t
table
(2,042) and significant value
(0,618)> 0.05, then the number of foreign
tourists does not significantly influence
entertainment tax revenue
Value of t
count
(-0.615) <t
table
(2,042) and
significant value (0,545)> 0.05, then inflation does
not have a significant effect on entertainment tax
revenue.
Moderation Test (Residual Test)
Table 9: Residual Test Model 1
Model Summary
Model R R Square
1 .827
a
.683
a. Predictors: (Constant), (Constant), inflation,
Foreign tourists, entertainment taxpayer, total
populationa. Predictors: (Constant), Inflasi,
WISMAN, WP Hiburan, Jumlah Penduduk
Identification of Variables That Improve the Reveneus of Entertainment Tax in the City of Batam City with GRDP Price Apply as
Moderating Variable
1017

Table 10: Residual Test Model 2
Model Summary
Model R R Square
1 .833
a
.693
a. Predictors: (Constant), PDRB Harga Berlaku,
WISMAN, Inflasi, WP Hiburan, Julmalah Penduduk
The first R Square value is 0.827 or 82.7%
while after the second equation R2 increases to
0.833 or 83.3%. Thus it can be concluded that the
presence of price GDP applies moderating variable
(Z) will be able to strengthen the relationship
between the number of residents, the number of
entertainment taxpayers, inflation, and the number
of foreign tourists to entertainment tax revenues.
Based on the data analysis above, this study
present findings as follows:
1 The results of the partial test shows that the
influence of the number of entertainment
taxpayers has a significant effect on entertainment
tax revenue which is the significant value of
0,000 smaller than α = 0.05. The results are in line
with the study conducted by Iranti Ratna Susanto
which states that the object of entertainment tax
has an effect on entertainment tax revenues. This
is also in accordance with the theory that the more
tax objects, the more revenues.
2 The results of the partial test shows that the
influence number of population has a significant
effect on entertainment tax revenue. This can be
seen with a significant value of 0,000 smaller than
α = 0.05. The results are in line with the cohesive
study which states that population growth has a
significant effect on economic growth in Demak
Regency.
3 The number of foreign tourists has no significant
effect on entertainment tax revenues. A significant
value of 0.618 is greater than the value of α =
0.05. This is because the municipal city of Batam
was originally initiated by as an industrial city, but
lately the government has also initiated to become
a tourist city.
4 Inflation does not have a significant effect on
entertainment tax revenues. A significant value of
0.545 is greater than the value of α = 0.05. This is
because the average inflation is still in the low
category so that inflation does not give a bad
effect to the economy but encourages the economy
to be better. This result is not in line with the
research conducted by Olivia & Ivan Yudianto
which states that inflation has a significant
positive influence.
The results of the analysis of the value of the first R
Square are 0.722 or 72.2% while after the equation
the second R2 has risen to 0.727 or 72.7%. Thus it
can be concluded that the presence of price GDP
applies moderating variable (Z) will be able to
strengthen the relationship between the number of
residents, the number of entertainment taxpayers,
inflation, and the number of foreign tourists to
entertainment tax revenues.
6 CONCLUSIONS
The study concludes that all independent variables
simultaneously have a positive and significant effect
on entertainment tax revenue. Meanwhile the
taxpayers, population and number of foreign tourists
also partially have a significant effect on
entertainment tax revenues but inflation has no
significant influence. The GRDP at current market
price is able to moderate the influence of the
number of taxpayers, population, number of foreign
tourists and inflation on entertainment tax revenues.
REFERENCES
Asmuruf, M. F., Rumate, V. A. and Kawung, G. M. .
(2015) ‘Pengaruh Pendapatan dan Jumlah Penduduk
Terhadap Pendapatan Asli Darah (PAD) Di Kota
Sorong’, Jurnal Berkala Ilmiah Efisiensi, Vol, 15 No.
Darise, N. (2009) Pengelolaan Keuangan Daerah. 2nd edn.
Jakarta: Indeks Permata Puri Media.
Darwin (2010) Pajak Daerah & Retribusi Daerah. Jakarta:
Mitra Wcana Media.
Ghozali, I. (2013) Aplikasi Analisis Multivariate dengan
Program SPSS. Edisi 5. Semarang: BP Undip.
Kuncoro, M. (2013) Metode Riset untuk Bisnis dan
Ekonomi. Jakarta: Erlangga.
Musgrave in Lubis (2017) Faktor-Faktor yang
Mempengaruhi Penerimaan Pajak Parkir Di Kota
Medan dengan PDRB Sebagai Variabel Moderating.
Universitas Sumatera Utara.
Nugraha (2014) Pengaruh Jumlah Kunjungan Wisatawan
Terhadap Pajak Hiburan , Pajak Hotel, Pajak Restoran
dan Pendapatan Asli Daerah Kota Bandung Tahun
2005. Universitas Pendidikan Indonesia.
Pemerintah kota Batam (2001) ‘Perda No. 15 Tahun 2001
Tentang Pajak Daerah Kota Batam’, in.
Pemerintah kota Batam (2017) Peraturan Daerah Kota
Batam No 1 Tahun 2017. Batam.
Republik Indonesia (2004) ‘Undang-undang No. 33 Tahun
2004 Tentang Perimbangan Keuangan Antara
Pemerintah Pusat dan Pemerintah Daerah’, in.
Indonesia.
UNICEES 2018 - Unimed International Conference on Economics Education and Social Science
1018

Republik Indonesia (2014) ‘Undang-Undang No. 23
Tahun 2014 Tentang Pemerintahan Daerah’, in.
sihotang, Y. (2015) ‘Kaitan Jumlah Wisatawan Terhadap
Pendapatan Asli Daerah Provinsi DKI Jakarta Tahun
2009-2013’, Jurnal Riset Akuntansi Universitas
Komputer Indonesia, Volume VII.
Sukirno, S. (2002) Makro Ekonomi Teori Pengantar.
Supartoyo, Y. H., Tatuh, J. and Sendouw, R. H. E. (2013)
‘The Economic Growth and The Regional
Charactheristic: The Case of Indonesia’, Sekolah
Pasca sarjana Institut Pertanian Bogor. JEL
Classification: O47, C23, R11.
Wardani, D. K. and Asis, M. R. (2017) ‘Pengaruh
Pengetahuan Wajib Pajak, Kesadaran Wajib Pajak,
Dan Program Samsat CornerTerhadap Kepatuhan
Wajib Pajak Kendaraan Bermotor’, Jurnal Akuntansi,
5(1), p. 15. doi: 10.24964/ja.v5i1.253.
Wardhono, A., Indrawati, Y. and Gema, C. (2012) ‘Kajian
Pemetaan Dan Optimalisasi Potensi Pajak Dalam
Rangka Meningkatkan Pendapatan Asli Daerah (Pad)
Di Kabupaten Jember’, VII(2), pp. 69–76.
Yulianti, E. B. and Suratno (2015) ‘Return on Equity ,
Debt to Equity Ratio, Price Earning Ratio, Assets
Growth, Inflasi dan Return Saham Perusahaan
Property dan Real Estate’, Jurnal Riset Akuntansi dan
Perpajakan JRAP, Vol. 2, No.
Identification of Variables That Improve the Reveneus of Entertainment Tax in the City of Batam City with GRDP Price Apply as
Moderating Variable
1019
