
The Effect of Compensation, Competency and Job Satisfaction
toward Performance of Lecture in Wiralodra Universiti of
Indramayu
Sumardi Hr
1
, R. Luddin
1
and Wibowo
1
1
Faculty of Pascasarjana, Universitas Negeri Jakarta, Jakarta- Indonesia
Keywords: Compensation, Competency, Job Satisfaction, Job Performance
Abstract: To be able to survive amid intense organizational competition, Small Medium Entrepreneurs (SMEs)
The
performance of UNWIR lecturers has not been fully in line with the expectations. Achievement
of lecturer performance at UNWIR is quite good category. This study aims to determine the
effects resulting from compensation, competence and job satisfaction on the performance of
UNWIR lecturers and compensation, competence on job satisfaction. The method used in this
study is quantitative associative that 104 respondents of UNWIR lecturers are assigned. The data
was collected by using performance appraisal instrument by chairman of UNWIR and lecturer
response instrument relating to the compensation, competence and job satisfaction of UNWIR
lecturer. Data processing were analyzed using path analysis by IBM SPSS 24 software. The
result showed that performance appraisal of lecturers of UNWIR by chairman of UNWIR is quite
less / low category, response of lecturer on compensation received is sufficient and the
competency assessment of each lecturer are respectively in the good category, the perceived job
satisfaction Lecturers are in the category of satisfaction and overall there is a significant
relationship between compensation, competence and job satisfaction on performance and there is
a relationship between compensation and competence on job satisfaction.
1 INTRODUCTION
Wiralodra University of Indramayu (UNWIR) is a
university located in the district of Indramayu,
which consists of eight faculties undergraduate level
with thirteen study programs and one postgraduate
faculty (UNWIR, 2015). UNWIR has been
established since 1985 and of course there are many
challenges that have been faced for 30 years.
However, even so, the advancement of UNWIR still
has to be improved. One of the contributing factors
is the performance of the lecturer. Lecturers are
professional educationist and scientists who have the
main task of remodelling, establishing, and
publicizing technology and art science through
teaching, exploration, and community service
society. Lecturers are professional workers at the
college level selected in accordance with the laws
and regulations. Lecturers play a role that functions
to enhance decency, as well as an agent of learning,
development of science technology and art, and
community service in order to improve the quality of
national education. The achievements of UNWIR
lecturers indicate that lecturers are still lacking in
exploring research and community service, lecturers
tend to be active with activities that are not
associated to their main tasks and functions, and
they are generally apathetic. This condition will
have a negative impact on the continuity of the
university. Therefore, the factors that cause these
complications need to be analyzed. The phenomena
mentioned above are a manifestation of the behavior
of Unwir lecturers' low performance. In essence, the
integrity of Unwir relies on achievement of the
lecturers. Therefore, university executives and
institutes have to more consider and figure out the
wishes of the lecturers. Based on the problems as
described above, the low performance of UNWIR
lecturers is important to be examined in more detail
and comprehensively.
Many factors are thought to affect the
performance of UNWIR Lecturers, including;
compensation, career development, work
Hr, S., Luddin, R. and Wibowo, .
The Effect of Compensation, Competency and Job Satisfaction toward Performance of Lecture in Wiralodra Universiti of Indramayu.
DOI: 10.5220/0009506607890797
In Proceedings of the 1st Unimed International Conference on Economics Education and Social Science (UNICEES 2018), pages 789-797
ISBN: 978-989-758-432-9
Copyright
c
2020 by SCITEPRESS – Science and Technology Publications, Lda. All rights reser ved
789

environment, competition and job satisfaction.
This is confirmed by research conducted by
Muguongo, Muguna and Murithi (2015), this study
it can be argued that if teachers are compensated
well, they will be encouraged, assured and will have
positive feelings towards their job and this would
result to job satisfaction (Muguongo, muguna, &
Murithi, 2015).
Research conducted by Samson, Waiganjo and
Koima (2015) : Regression results showed that the
work life balance factors significantly influenced
employees‟ performance and (β = -0.203; p value =
0.012 and t value = -2.532) and thus the null
hypothesis was rejected. The implication of this is
that work/family and work- extracurricular activities
must be strategically integrated into the work place
environments to boost performance in the
employees. Ignoring these factors will lead to a
broad emotional and behavioural deficiency thus
affecting the general performance of the employees
(Samson, Waiganjo, & Koima, 2015)
Research conducted by Agustina Rantesalu et.al.
which states that: competence has a positive and
significant effect on employee performance, It can
be proved by the standardized regression weight
estimate of 0,351 and the probability value of 0.018
< 0,05 (Rantesalu, Mus, & Mapparenta, 2016);
research by Fadalah (2015): The literature
confirms that satisfied employees do perform better
and contribute to the overall success of an
organizations. On the other hand, employees who
are not satisfied do not perform well and become a
barrier to successs. The research suggests that this is
a global phenomenon and by focusing on improving
satisfaction and performance, organizations can be
more successful (Fadlallh, 2015).
2 THEORICAL FRAMEWORKS
2.1 The Employees Performance
The performance is basically what the employees do
and did not do. The performance of employees is
affecting the amount of contribution they contribute
to the organization, among others, including: : the
output quantity, the quality of the output, the output
time period, presence at work and their cooperation
(Pace & Faules, 2006). The opinion emphasizes that
there are five aspects that require to be done by
employees in carrying out their main job and
function which consist of:1) Employees commit to
the organization in the form of output quantities. 2)
Employees commit to the organization in the form
of output quality. 3) Employees commit to the
organization in the form of time spent.4) Attendance
at work. 5) The attitude of cooperation between
fellow employees and obeying the leadership.
According to Pace and Faule (Pace & Faules, 2006)
says that: Performance a functional task related to
the ability of somebody to finish their work,
especially in the completion of the technical aspects
of the work, handlng interpersonal tasks with other
members, including addressing conflict, time
management, empowering others, work in a group
and work independently. They stated that
performance of employees has seven aspects to
comprise: 1) the completion of tasks in the technical
aspects. 2) Completing the work with fellow
employees. 3) Resolving conflicts that occur
between fellow employees. 4) Get the job done
effectively. 5) Able to finish the job by empowering
others. 6) Able to finish the work in a group. 7) Able
to finish the work independently.
According to Colquitt, et al., stating Formal
performance is described as the value of the set of
employee behaviors that support, both positively and
negatively in order to achieve organizational goals
(Colquitt, Lepine, & Wesson, 2015). According to
George and Jones, argued that Performance is the
result of an assessment of a person's behavior, which
is related to the determination of how well a person
has done his job or done his job (George & Jones,
2008).
Based on these definitions, employee
performance is the level of achievement or the
execution of the duties of an employee in
performancing their duties and responsibilities as
functional workers (George & Jones, 2008). This
means that Performance is the result of a specific job
function or activity for a period of time. From that
understanding, there are three aspects that need to be
understood by any leader of an organization,
namely: 1) the clarity of tasks that are the
responsibility of employees .2) the clarity of the
expected results by the organization and 3) time
required to finish the job.
Based on the opinions of experts above, it can be
synthesized that employee performance is the
achievement of functional duties of employees
during a certain period of time both in qualitative as
well as quantitative, in accordance of their authority
and responsibility, as motives and opportunities in
order to realize the goals, objectives, vision and
mission of the organization legally, does not violate
the law and in accordance with the moral or ethical
values. The indicators are: objectives, standards,
feedback, means, motive, opportunity. As for
performance indicators according to Wibowo
UNICEES 2018 - Unimed International Conference on Economics Education and Social Science
790

(Wibowo, 2016) is : Goals; Standard; Feedback; The
Tools or Means; Competence; Motives and
Opportunities.
2.2 Compensation
Someone who working is contributing time, mind,
and energy to the organization and as his
achievements, the organization must provide a
proper compensation or rewards for meeting the
needs of self and family life of their employees.
Compensation played an important role because in
general the employees want the magnitude of the
compensation given by the company in proportion to
the workload, as it also expects to guarantees
welfare for himself and his family while they were
still active work and after they reach retirement.
With a balanced compensation, employees ' welfare
will be fulfilled and expected employee will get job
satisfaction so that the employee's performance will
be high. With regard to that Ivancevich stated that:
"Compensation is the Human Resources
Management function that deals with every type of
reward individuals receive in exchange for
performing organization tasks" (Ivancevich,
Konopaske, & Matteso, 2011). It means
compensation in return from work that has been
done by employees given by the company as form of
recognition of the work done by employees.
It is also said by Milkovich that "Compensation
is any income in the form of money, goods directly
or indirectly received by employees in return for
services rendered to the company" (Milkovich,
Newman, & Milkovich, 2011). This statement have
meaning that income in the form of money that
employee received in return for services rendered on
the company and all the income in the form of direct
and indirect goods as rewards that employees
received the services given to the employee.
Based on the opinions of experts above, it can be
synthesized that compensation is the cons
achievement from all forms of reward in the form of
money, goods directly and indirectly promised will
be received by an employee as retribution over
perceived task in order to achieve goals, with
indicators; salary, wages, incentives, direct goods
and allowances. The indicators of compensation
(Mathis & Jackson, 2006):
Direct income consists of: base salary (wages
and salaries) and the income is not fixed (bonus,
incentives, perks and daham option).
2.3 Competences
Competences derive from the word meaning skills,
capabilities and authorities. Etymologically,
competence is defined as the dimension of behavior
skill or excellence leader or someone on staff that
has the skill (Sutrisno, 2014). Opinion above means
that an employee must have a proficiency of
employees in carrying out the task, the ability of
employees to complete tasks, and skills of
employees in completing his responsibilities.
Spencer and Spencer (Jr. & Spencer, 1993)
competency is defined as "an underlying
characteristic's of an individual which is causally
related to criterion-referenced or superior and
effective performance in a job or situation ".
Underlying competencies means a part of of a
person personality who is quite deep and relatively
settled can predict behavior in a variety of situations
and tasks. Casually related means that competence
can cause or predict a person's behavior or
performance.
Competence is the ability to execute or do a job
or task that is based upon skills and knowledge as
well as supported by the attitude of work required by
the job. Thus the competency demonstrated skill or
knowledge is characterized by prefosionalisme in a
particular field as something that is paramount, as
the pre-eminent that field (Wibowo, 2016).Opinion
above means (1) the ability to carry out work that is
grounded with a skill that is supported by the
attitude of work to suit the job and (2) the ability to
carry out work which is based on with the
knowledge that is supported by the attitude of work
to suit the job.
Competence is a fundamental characteristic of
someone who lets them provide superior
performance in a job, role or a particular situation.
Skills are the things that people can do well;
knowledge is a person knownledge about a topic.
Social role is the demonstrated image of a person in
advance of the public. Social role representing what
people deem is important. Social roles reflect that
person's values (Sutrisno, 2014).
The aspects contained in the concept of
competency as follows (Sutrisno, 2014):
1. Knowledge. Namely, in the field of cognitive
awareness.
2. Comprehension, i.e. the depth of the cognitive
and affective, owned by individuals.
3. Skill is something that is owned by the
individual to perform the task or the job that
charged him.
4. Values which is a standard of behavior that had
been believed to be psychologically and have
fused in a person.
The Effect of Compensation, Competency and Job Satisfaction toward Performance of Lecture in Wiralodra Universiti of Indramayu
791

5. Attitude, feeling (happy, likes dislikes) or a
reaction to a stimulus which is dating from the
outside.
6. Interest, i.e. the tendency of a person to perform
an act.
Based on the experts’ opinions, it can be synthesized
that the employee competency are characteristic of
the knowledge, skills, competences and skills.
Employee in performing the duties and
responsibilities effectively characterized by quality
improvement professional in an occupation, with
indicators: characteristics of knowledge belonging to
employees, employee skill characteristics, carry out
tasks effectively, responsibility responsibility,
quality improvement professional. Competence
indicator (Wibowo, 2016):
1. The characteristics of individual knowledge
2. Characteristics of individual skills
3. Carry out tasks effectively
4. Individuals are responsible for effectively
5. Improvement of the quality of professional
work
2.4 Job Satisfaction
Every individual who works surely expect
satisfaction from their workplace. Satisfaction is a
relative and subjective, meaning that each individual
has a measure of satisfaction. Complacency is a
condition that is not fixed, but always evolves
according to the needs a boost from within and from
outside of the respective individuals. According to
Robibins in Wibowo said that job satisfaction as a
general is an attitude towards the work of someone,
that shows the difference between the numbers of
awards received workers and the amount they
believe should they receive (Wibowo, 2016).
Opinion above has a meaning that job satisfaction is
the attitude of a person towards his distinction in the
real results.
The same views were expressed by Gibson, et.al,
describe that job satisfaction is the attitude which
belonged to workers about their jobs (16). It is as a
result of their perception of the work.
Whereas Newstrom defines that: "Job
satisfaction is a collection of pleasant or unpleasant
feelings and emotions with which employees view
their work. Job satisfaction is the affective attitude
of a feeling about joy or dislike relative to something
" (Newstrom, 2014). Job satisfaction is an affective
attitude feelings about joy or dislike relative to
something. Job satisfaction is an indicator of
individual behavior in the freedom of Association, in
addition to other indicators such as stress,
motivation, decision making processes, and
capabilities.
According to Colcuitt, Lepin, and Wesson
expressed Job satisfaction is a pleasant emotional
state of the job appraisal (Colquitt, Lepine, &
Wesson, 2015). That means, job satisfaction is a
pleasant emotional state to the assessment of their
work. In this case, one person's assessment toward
one job or work experience, or in other words how
our feelings about the job and what he thought about
the job, employees who have high work have the
feeling that positive when thinking about their job or
being part of a group in doing its job, while
employees who work low satisfaction have negative
feelings when thinking about the job.
Based on the experts opinions above, it can be
synthesized that job satisfaction is a set of feelings
(emotions) that owned the worker as a result of the
evaluation and the context it works against job
characteristics work surroundings shows the
difference of the number of awards received by the
number they are supposed to receive, with
indicators: feeling the delightful employees, quality
supervision, relationship with colleagues,
opportunities of promotion.
Indicators of job satisfaction are (Colquitt,
Lepine, & Wesson, 2015):
1. The work itself, the work itself which includes
responsibility, interest and growth
2. Quality of supervision, which includes technical
help and social support.
3. Relationship with co-worker, which includes
social harmony and respect.
4. Promotion opportunities, chances for futher
advancement.
Pay, in the form adequacy of pay and a feeling
of Justice toward those other (perceived equity vis-ả-
vis other).
3 RESEARCH METHOD
The research method used was assosiatif quantitative
methods. Because the free variables with variable
between bound there are variable between
(intervening), then the data analysis techniques using
path analysis. This research is using statistical
calculation by MS-EXCEL and IBM SPSS 24
Software.
This research on population is 141 lecture. Any
sample using Slovin formulation.
UNICEES 2018 - Unimed International Conference on Economics Education and Social Science
792
n
N
1N.e
141
1 1410.05
141
1.3525
104.25 104 lecture
This research involves five variables, four variables
can act as a free variable, and one variable as
variable. The variable compensation (X1),
competence of the lecturers (X2) is an exogenous
variable; while a lecturer job satisfaction variables
(X3) can act as exogenous variable or endogenous
depends on the structure of the path or anything to
do. Variable performance lecturer (Y) Act as
endogenus variable. The proposed relationship
structure model included into the recursive model
completely, because endogenous variables
influenced by variables earlier in the causal
sequence. Exogenous variables are the variables that
can only act as free variables; While the variable is a
variable that can be endogenus as variables bound at
least, relies on a free variable. Constellation research
path analysis (path) is described as the following
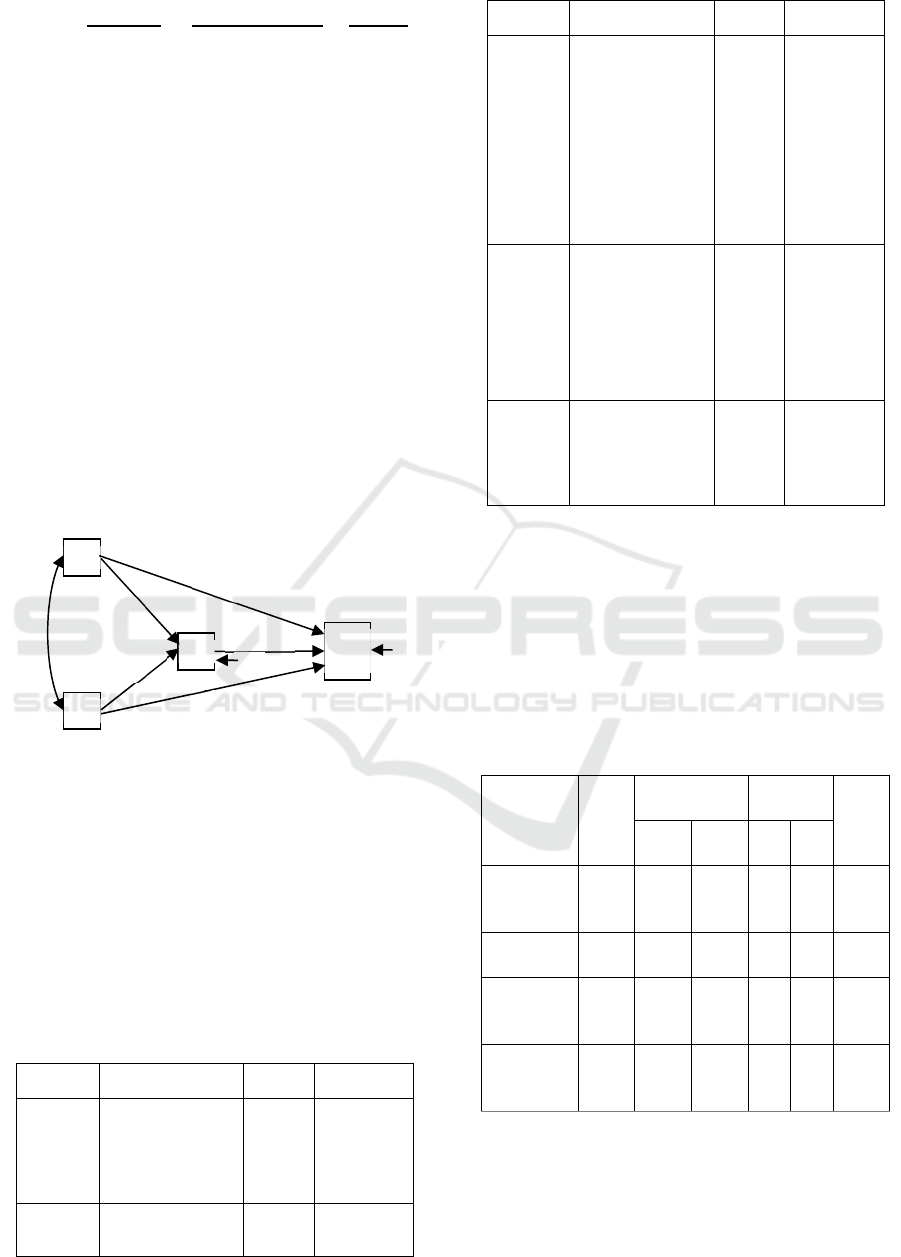
Figure 1.
Figure1: The Constellation Research
This research was carried out in University
Wiralodra. The research subject as a lecturers
lecturers with the number of 141 people scattered in
8 faculties and one Post Graduate.
This research has two types of variables, namely:
Bound variable (performance of UNWIR lecturers);
Intervening variables (job satisfaction of UNWIR
Lecturers) and variables (Compensation, Lecturers
empowerment and competence of UNWIR
lecturers).
Table 1: Variable of Research
Vari
abel
Indicator Scale reference
Compens
ation (X
1
)
1. base salary,
2. wages,
3. incentives,
4. the goods
directly, and
5. allowances.
Likert Robert L.
mathis dan
John H.
Jacson(2006
)
Lecturers
Compens
ation (X
2
)
1. characteristics of
Lecturer of
UNWIR
Test
and
micro
Wibowo
(2013)
Vari
abel
Indicator Scale reference
knowledge,
2
. characteristics of
lecturer skills
UNWIR,
3. carry out tasks
effectively,
4
. Lecturer
responsible
UNWIR,
5. quality
improvement
p
rofessional.
teachin
g
Lecturers
job
satisfactio
n (X
3
)
1. feeling the
delightful UNWIR
lecturer,
2
. the quality of
supervision,
3. relationship with
colleagues,
4
. promotional
opportunities
Likert Colquitt,Jas
on
A.,Jeffery
A.LePine
and Michael
J.Wesson
(2011)
Performa
nce
Lecture
(Y)
1. purpose,
2. standard,
3. feedback,
4. means,
5. motive,
6. opportunities.
Score
1-5
Wibowo
(2015)
4 ANALYSIS
4.1 Description of Respondents and Variables
The respondents in this study consists of 3 graduates
(2.89%) lecturers, 92 people (88.46%) master's
degree graduates and 9 people (8.65%) are Doctoral
graduates.
4.2 Quality Test Data
Table 2: Validity variable
Variable
R
critic
al
R
count
Scor
e
Exp.
R
below
R
upper
Mi
n
Ma
x
Lecturer
performan
ce
0.349 0.392 0.782 60 119 Valid
Compensati
on
0.381 0.350 0.465 50 99 Valid
Lecturer
competenci
es
0.355 0.562 0.777 50
10
4
Valid
Lecturer
competenci
es
0.349 0.368 0.616 25 78 Valid
4.3 Classic Assumtion Test
1) Test Normality Results
This normality test aims to study whether the
distribution of selected samples that derived from a
population that distribute normally or not. Test study
on normallitas using IBM SPSS software 24
β
γ
β
γ
2
β
Β
Β
The Effect of Compensation, Competency and Job Satisfaction toward Performance of Lecture in Wiralodra Universiti of Indramayu
793
assistance. Data distribution is said to be normal
when the significance value (komogorof- Smirnova)
> 0.05
Table 3: Test Normality Results
Tests of Normality
Kolmogorov-Smirnov
a
Shapiro-Wilk
Statistic Df Sig. Statistic Df Sig.
X1 .068 104 .200
*
.988 104 .493
X2 .069 104 .200
*
.988 104 .452
X3 .071 104 .200
*
.962 104 .005
Y .067 104 .200
*
.987 104 .406
*. This is a lower bound of the true significance.
a. Lilliefors Significance Correction
Based on the results of test of normality as stated in
Table 3 above, it can be concluded that all variables
distribute normally because the value significance of
> 0.05. So the terms of (assuming) path analysis of
error normality equation regression estimates are
met.
2) Test results of homogeneity
Homogeneity data means that data has a variation or
diversity of equal value or statistically the same. So
the emphasis of homogeneity data is contained on
the diversity of the variance or the standard
deviation of the data. Homogeneity data is a
requirement which is recommended to be tested
statistically.
This research uses the formulation of its
homogeneity of variance test with Fmaks Hartley
Table 4 : Calculation of variance homogeneity tests
Group
N
Db S
2
X1 104 103 135.6698
X2 104 103 122.1792
X3 104 103 126.5586
Y 104 103 153.5906
𝐹
153.5906
122.1792
1.2570
Because the Fmaks is less than Ftabel, then the fifth
distribution of samples have the same variance or
homogeneous.
3) Test result Linierity
This test aims to find out whether two variables have
a linear relationship or not significantly. The
following table 5 presents the results of a test of
linieritas by using IBM SPSS software 24 assistance.
Table 5 : Summary Of Linieritas Test Result
NO
.
Group F
table
F
count
Summary
1 X
1
to Y 0.99 1.39 Linier
3 X
2
to Y 1.22 1.39 Linier
4 X
3
ke Y 1.32 1.39 Linier
5 X
1
ke X
3
1.09 1.39 Linier
6 X
2
ke X
3
1.20 1.39 Linier
Based on the results of linieritas tests like in
table 5, then it appears that the linieritas test for the
entire F
o
< F
critical
. That means, the entire regression
line equation in the model are linear.
4.4 Discussion Hipothesis
To test the hypothesis the researcher used Packages
Program (Software) IBM SPSS 24, while also
testing the hypothesis of the study.
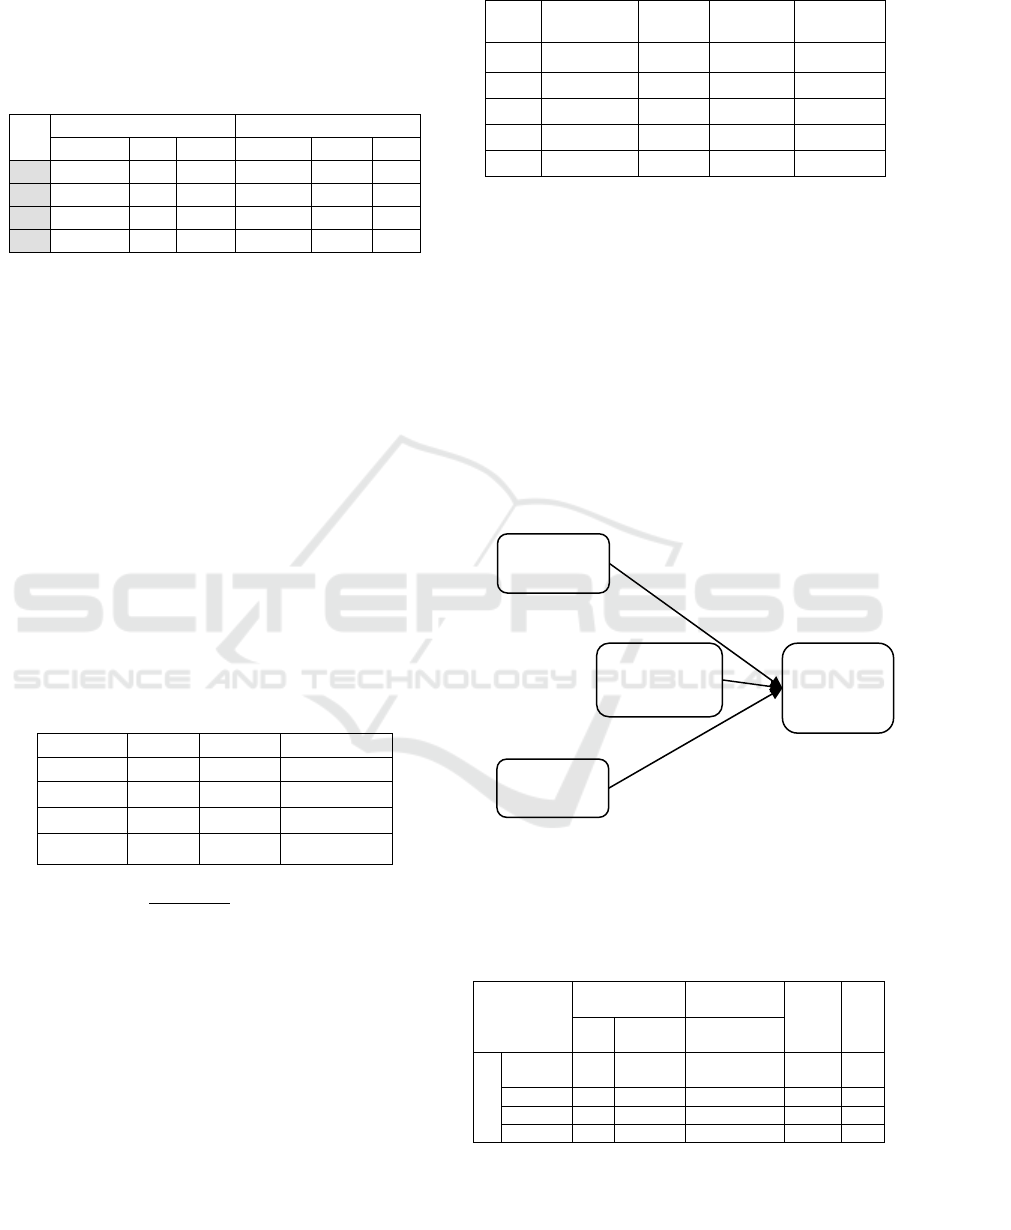
1) Calculation of the coefficient on line on
Structural Sub 1
Causal relationships between variables in sub
structural 1 consists of one endogenous variable,
namely the performance of (Y) and the four
variables exogenous namely compensation (X
1
),
competence (X
3
) and job satisfaction (X
3
).
Figure 2: Causal relationships on Structural Sub 1
The results of the data processing by using the
assistance software IBM SPSS 24.
Table 6 : The value of the path coefficient and the
value of structural Sub 1
Coefficients
a
Model
Unstandardized
Coefficients
Standardized
Coefficients
t Sig.B
Std.
Erro
r
Beta
1 (Constan
t)
-
.130
1.485
-.088 .930
T_X1 .422 .085 .407 4.973 .000
T_X2 .269 .080 .272 3.357 .001
T_X3 .315 .060 .317 5.234 .000
a. Dependent Variable: T_Y
Based on the results of sub structural 1 path
analysis as seen in Table 6, obtained value:
P
y
3
Job
Satisfaction
(X
3
)
P
y
Employee
Performanc
e (Y)
Compensati
on (X
1
)
Competence
(X
2
)
P
y
2
UNICEES 2018 - Unimed International Conference on Economics Education and Social Science
794
P
y1
= β
y1
= 0.407; [t = 4.973]
P
y2
= β
y2
= 0.272; [t = 3.357]
P
y3
= β
y3
= 0.317; [t = 5.234]
Table 7: R
2
value of structural sub 1
Model Summary
Model R
R
S
q
uare
Adjusted R
S
q
uare
Std. Error of
the Estimate
1 .961
a
.923 .920 2.82303
a. Predictors: (Constant), T_X3, T_X2, T_X1
Table 7 roves that compensation, competence
and job satisfaction of UNWIR lecturers together
contribute to the performance of UNWIR lecturers
by 0.923 or 92.3%. It means that the variants of
compensation competence and job satisfaction of
UNWIR lecturers together can explain 92.3% of the
variants of UNWIR Lecturer performance.
2) Calculation of the coefficient on line on
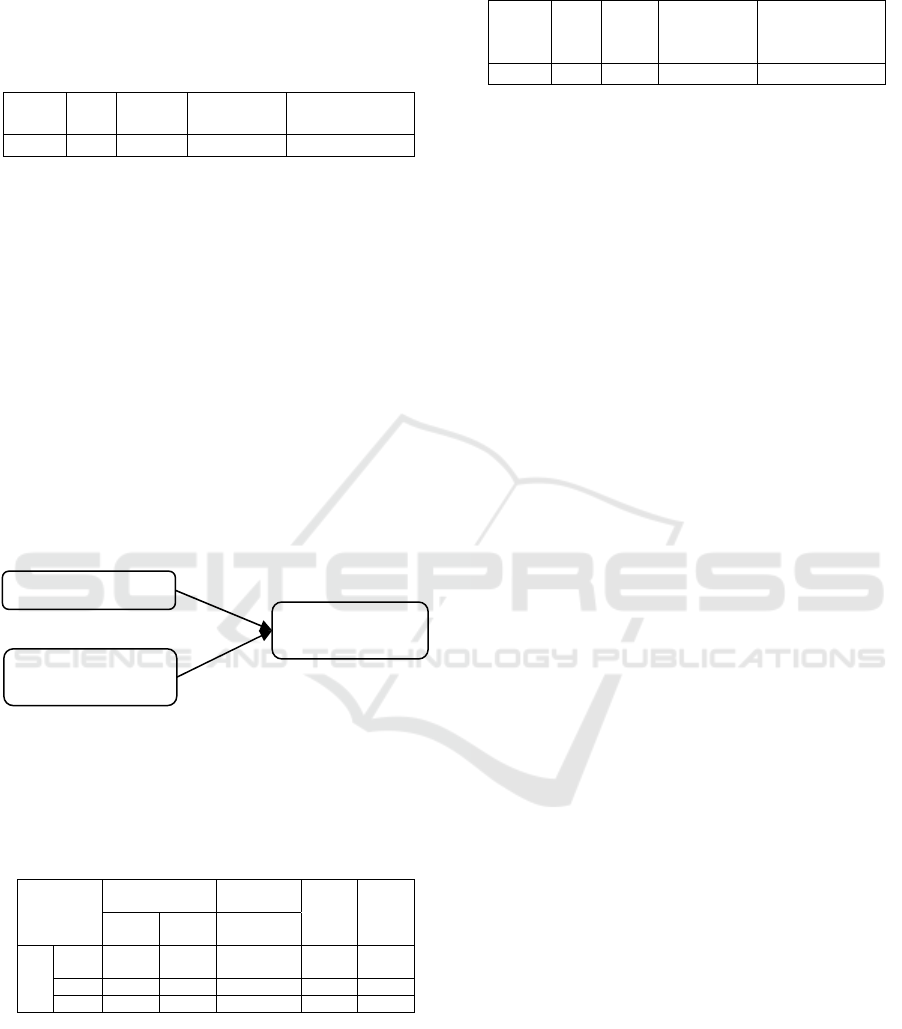
Structural Sub 2
Causal relationships between variables in sub
structural 2 consists of one endogenous variable
which is job satisfaction (X
3
) and three variables
exogenous namely compensation (X
1
) and
competence (X
2
).
Figure 3: Causal relationships on Structural Sub 2
The results of the data processing by using the
assistance software IBM SPSS 24.
Table 8 : The value of the path coefficient and the
value of structural Sub 1
Coefficients
a
Model
Unstandardized
Coefficients
Standardized
Coefficients
t Si
g
.B
Std.
Erro
r
Beta
1 (Const
ant
)
3.857 2.427
1.589 .115
T
_
X1 .497 .132 .475 3.778 .000
T
_
X2 .428 .126 .429 3.407 .001
a. De
p
endent Variable: T
_
X3
Based on the results of path analysis structural
sub 2 as shown in the equation above, each of the
retrieved value:
P
31
= β
31
= 0.475 [t = 3.778]
P
32
= β
32
= 0.429 [t = 3.407]
Table 9 : R
2
value of structural sub 1
Model Summar
y
Model R
R
Squar
e
Adjusted R
S
q
uare
Std. Error of
the Estimate
1 .888
a
.789 .785 4.67189
a. Predictors: (Constant), T_X2, T_X1
Table 9 roves that compensation and
competence together contribute to the performance
of UNWIR lecturers by 0.789 or 78.9%. It means
that the variants of compensation and competence
and together can explain 78.9% of the variants of job
satisfaction of UNWIR lecturers.
3) calculation of indirect effects
a) The indirect effect of compensation on the
performance of UNWIR lecturers is the direct
effect of compensation on job satisfaction
(compensation ⇒ UNWIR lecturers' job
satisfaction) of 0.475 plus the direct effect of
UNWIR lecturers' job satisfaction on the
performance of UNWIR lecturers (UNWIR
lecturers' job satisfaction ⇒ performance of
UNWIR lecturers) of 0.317. So, the indirect
effect of compensation on the performance of
UNWIR lecturers = 0.475 X 0.317 = 0.150.
b) The indirect influence of competence on the
performance of UNWIR lecturers is the direct
influence of competence on job satisfaction
(competency ⇒ UNWIR lecturer job
satisfaction) of 0.429 plus direct influence of
UNWIR lecturers' job satisfaction on the
performance of UNWIR lecturers (UNWIR
lecturers' job satisfaction ⇒ performance of
UNWIR lecturers) of 0.317. So, the indirect
influence of empowerment on the performance
of UNWIR lecturers = 0.429 X 0.317 = 0.136.
5 RESULTS
The results of the research are:
a. Based on the results of calculations in Table 6,
the Py1 path coefficient value is 0.407 with
tvalue=4.973 at α = 0.05 while ttable = 1.66.
Thus tvalue=4.973 > ttable=1.66, means that H0
is rejected, then the path coefficient is
significant. Based on these findings it can be
interpreted that compensation has a positive
direct effect on the performance of UNWIR
lecturers.
b. Based on the results of calculations in Table 6,
the Py2 path coefficient value is 0.272 with
tvalue=3.357 at α = 0.05 while ttable = 1.66.
P
32
Employee Job
Satisfaction (X
3
)
P
31
Compensation(X
1
)
Employee
Competence (X
2
)
The Effect of Compensation, Competency and Job Satisfaction toward Performance of Lecture in Wiralodra Universiti of Indramayu
795

Thus tvalue=3.357 > ttable=1.66, means that H0
is rejected, then the path coefficient is
significant. Based on these findings it can be
interpreted that competences has a positive
direct effect on the performance of UNWIR
lecturers.
c. Based on the results of calculations in Table 6,
the Py3 path coefficient value is 0.317 with
tvalue=5.234 at α = 0.05 while ttable = 1.66.
Thus tvalue=5.234 > ttable=1.66, means that H0
is rejected, then the path coefficient is
significant. Based on these findings it can be
interpreted that job satisfaction has a positive
direct effect on the performance of UNWIR
lecturers.
d. Based on the results of calculations in Table 8,
the P41 path coefficient value is 0.475 with
tvalue=3.778 at α = 0.05 while ttable = 1.66.
Thus tvalue=3.778 > ttable=1.66, means that H0
is rejected, then the path coefficient is
significant. Based on these findings it can be
interpreted that compensation has a positive
direct effect on the UNWIR lecturers' job
satisfaction.
e. Based on the results of calculations in Table 8,
the P42 path coefficient value is 0.429 with
tvalue=3.407 at α = 0.05 while ttable = 1.66.
Thus tvalue=3.407 > ttable=1.66, means that H0
is rejected, then the path coefficient is
significant. Based on these findings it can be
interpreted that competences has a positive
direct effect on the UNWIR lecturers' job
satisfaction.
f. The indirect effect of compensation on the
performance of UNWIR lecturers is the direct
effect of compensation on job satisfaction
(compensation ⇒ UNWIR lecturers' job
satisfaction) of 0.475 plus the direct effect of
UNWIR lecturers' job satisfaction on the
performance of UNWIR lecturers (UNWIR
lecturers' job satisfaction) of 0.317. So, the
indirect effect of compensation on the
performance of UNWIR lecturers = 0.475 X
0.317 = 0.150 .
g. The indirect influence of competence on the
performance of UNWIR lecturers is the direct
influence of competence on job satisfaction
(competency ⇒ UNWIR lecturer job
satisfaction) of 0.429 plus direct influence of
UNWIR lecturers' job satisfaction on the
performance of UNWIR lecturers (UNWIR
lecturers' job satisfaction) UNWIR lecturers'
performance of 0.317 So, the indirect influence
of empowerment on the performance of
UNWIR lecturers = 0.429 X 0.317 = 0.136.
6 CONCLUSIONS
This study contributes to critical factors in
implementing ISO 9001 in SMEs. The results of the
validity and reliability test show that there are 19
critical factors that meet the minimum criteria or
requirements. Other contributions are the use of
Delphi techniques and Aiken's approach in testing
the validity and reliability that had not previously
been used especially in critical factors studies on the
application of ISO 9001 in SMEs. Further research
is in the form of elaborating operational definitions
and measurement indicators because critical factors
are generally still latent so that instruments can be
used to evaluate the success rate of SMEs in
implementing ISO 9001.
REFERENCES
Awan, A. G., & Asghar, I. (2014). Impact Of Employee
Job Satisfaction On Their Performance: A Case Study
Of Banking Sector In Muzaffargarh District, Pakistan.
Global Journal of Human Resource Management, 71-
94.
Bakan, I., Buyukbese, T., Ersahan, B., & Sezer, B. (2014,
rch). Effects of Job Satisfaction on Job Performance
and Occupational. International Journal of
Management & Information Technology, 9(1), 1427-
1480.
Colquitt, J. A., Lepine, J. A., & Wesson, M. (2015).
ORGANIZATIONAL BEHAVIOR: IMPROVING
PERFORMANCE AND COMMITMENT. New York:
McGraw-Hill Education.
Dharmanegara, I. B., Sitiari, N. W., & Wirayudha, I. D.
(2016). Job Competency and Work Environment: the
effect on Job Satisfaction and Job Performance among
SMEs Worker. IOSR Journal of Business and
Management, 18(1), 19-26.
Fadlallh, A. W. (2015). Impact of Job Satisfaction on
Employees Performance an Application on Faculty of
Science and Humanity Studies University of Salman
Bin Abdul-Aziz-Al Aflaj. International Journal of
Innovation and Research in Educational Sciences, 26-
32.
George, J. M., & Jones, G. R. (2008). Understanding and
Managing Organization Behavior. New jersey:
Pearson Prentice Hall.
Gibson, J. L., Ivancevich, J. M., & Konopaske, R. (2011).
Organizational Behavior Structur Processes. United
States: MacGraw-Hill.
UNICEES 2018 - Unimed International Conference on Economics Education and Social Science
796

Ivancevich, J. M., Konopaske, R., & Matteso, M. T.
(2011). Organizational behavior and management.
Boston: McGraw Hill.
Jr., L. M., & Spencer, S. M. (1993). Competence at work:
models for superior performance. New York: John
Wiley & Sons,inc.
Khalid, K., Salim, H. M., & Loke, S.-P. (2011). The
Impact of Rewards and Motivation on Job Satisfaction
in Water. International Conference on Financial
Management and Economics, 11, 35-41.
Lotunani, A., Idrus, M., E.Afnan, & Setiawan, M. (2014.).
The Effect of Competence on Commitment,
Performance and Satisfaction with Reward as a
Moderating Variable (A Study on Designing Work
plans in Kendari City Government, Southeast
Sulawesi). International Journal of Business and
Management Invention, 3(2), 18-25.
Mathis, R. L., & Jackson, J. H. (2006). Manajemen
Sumber Daya Manusia. (D. Angelica, Ed.) Jakarta:
Salemba Empat.
Milkovich, G. T., Newman, J. M., & Milkovich, C.
(2011). Compensation. New York: McGraw Hill.
Muguongo, M. M., muguna, A. T., & Murithi, D. K.
(2015). Effects of “Compensation on Job Satisfaction
Among Secondary School Teachers in Maara Sub –
County of Tharaka Nithi County, Kenya. Journal of
Human Resource Management, 3(6).
Newstrom, J. W. (2014). Organizational Behavior :
Human Behavior at Work 14th Edition. Boston:
McGraw-Hill.
Pace, R. W., & Faules, D. F. (2006). Komunikasi
Organisasi Strategi Meningkatkan Kinerja
Perusahaan. (M. P. Deddy Mulyana, Ed.) Bandung:
PT Remaja Rosdakarya.
Rantesalu, A., Mus, A. R., & Mapparenta, Z. A. (2016).
The Effect of Competence, Motivation and
Organizational Culture on Employee Performance: the
Mediating Role of Organizational Commitment.
journal of Research in Business and Managent, 08-14.
Samson, G. N., Waiganjo, M., & Koima, J. (2015). Effect
of Workplace Environment on the Performance of
Commercial Banks Employees in Nakuru Town.
International Journal of Manajerial Studies and
research (IJMSR), 3(12), 76-89.
Sopiah. (2013). The Effect of Compensation toward Job
Satisfaction and Job Performance of Outsourcing
Employees of Syariah Banks in Malang Indonesai.
International Journal of Learning & Development .
Sutrisno. (2014). Manajemen Sumber Daya Manusia.
Jakarta: Kencana Prenada Media Grup.
Trivellas, P., Akrivouli, Z., Tsifora, E., & Tsoutsa, P.
(2014). The impact of knowledge sharing culture on
job satisfaction in accounting firms. The mediating
effect of general competencies. The Economies of
Balkan and Eastern Europe Countries in the changed
world, 238-247.
UNWIR. (2015). BAAK. Indramayu: UNWIR.
Wibowo. (2016). Manajemen Kinerja. Jakarta: Rajawali
pers.
The Effect of Compensation, Competency and Job Satisfaction toward Performance of Lecture in Wiralodra Universiti of Indramayu
797
