
Performance Analysis of PV System on Real Time Sun Tracking
Structure for Grid Connection in Southern Algeria
Messaouda Khennane Benbitour
1
, Sliman Boughali
2
, Djamal Bechki
2
, Ali Malek
3
, Boubaker
Azoui
4
, Layachi Zaghba
1
, Amor Fezzani
1
, Idriss Hadj Mahammed
1
, Samir Hamid Oudjana
1
1
Applied Renewable Energy Research Unit, URAER, Renewable Energy Development Center, CDER, 47133,
Ghardaia, Algeria
2
Kasdi Merbah University, Ouargla,
1
Institute of Problem Solving, Algeria
3
Renewable Energy Development Center, CDER, Algeria
4
Université Batna 2 University, Algeria
Keywords: PV performance, inverter, sun tracking, modeling
Abstract: In this study, we analyze the experimental annual energetic performance of a photovoltaic system mounted
on a solar tracking structure. This equipment had been acquired by the Renewable Energy Applied Research
Unit (REARU) of Ghardaia. The pv field is constituted by a monocrystalline module (specification in
appendix) with a peak power of 2.25 kW, and an inverter Fronius IG15 power of 1.3 kW. The annual energy
produced by the system is 3.61 MWh and injected in the internal power grid of REARU, whereas its energy
calculated for the same period is 3.79 MWh, the annual produced energy of a same system with a fixed
angle is 2.13MWh. The performance ratio (PR) of the system is at its minimum in January with 0.44 and its
maximum in April with 0.88. Implantation site characteristics are : Latitude 32.4°, Longitude 3.80° and
Altitude 468.4 m, located in the desert at 600 km south of Algiers. We begin by the presentation of each part
of the system, and after that, the modeling of each sub-system. Performance indexes of the photovoltaic
system connected to the power grid (PVSGC), especially the PR are measured, and also the impact of losses
on energy production. All results obtained during the analyze period are presented and discussed, followed
by conclusions and specific recommendations for this system type and its environment.
1 INTRODUCTION
Nowadays, renewable energy became more and
more attractive and environment protection became
a recurrent theme.
Algeria is a country with a large number of
sunny days. The Algerian land is mainly is arid and
semi-arid, where the huge demand of electricity in
the warm season. To meet this demand, it is
recommended to inject renewable energy production
in the power grid.
In Algeria, most of electrical energy production
comes from fossil energy – petrol and natural gas.
The rest comes from renewable energy, mainly
made up of hydraulic and photovoltaic energy.
Thanks to its geographical position, Algeria is
one of the largest potential solar sites in the world.
Solar irradiation on the main part of the territory
exceeds 2000 h per year and 3900 h on the
Highlands and Sahara.
Daily energy received on a 1m2 horizontal area
is 5 kWh on the main part of the national territory,
comprised of 1700 kWh/m2/year in the North and
2263 kWh/m2/year in the South. "Renewable
Energy Portal"
The aim of the renewable energy development
national program (2015-2030) is to reach 27% of
national energy production from renewable one and
37% of installed capacity in 2030. The volume of
natural gas saved by renewable energy production of
Benbitour, M., Boughali, S., Bechki, D., Malek, A., Azoui, B., Zaghba, L., Fezzani, A., Mahammed, I. and Oudjana, S.
Performance Analysis of PV System on Real Time Sun Tracking Structure for Grid Connection in Southern Algeria.
DOI: 10.5220/0009775904090418
In Proceedings of the 1st International Conference of Computer Science and Renewable Energies (ICCSRE 2018), pages 409-418
ISBN: 978-989-758-431-2
Copyright
c
2020 by SCITEPRESS – Science and Technology Publications, Lda. All rights reserved
409

22000 MW is approximately 300 Billion m3,
equivalent to 8 times consumption volumes of 2014
year. "Renewable Energy Portal"
(FİLİK et al., 2017) have analyzed the
comparison of the solar tracking photovoltaic (PV)
system and the same solar fixed photovoltaic system
in Eskisehir region (Central Anatolia), for the period
between July to October 2016. The result is the
tracking system provides nearly 33% higher
electricity generation than the fixed one.
(KIVRAK et al. , 2012), they evaluate the
performance between the system PV with reel time
sun tracker and another one with fixed tilted in
Denizli, Turkey. For the two months May and June
the energy generated by the subtracting is nearly
64% when it is compared with fixed PV system.
When a tracker is used a system that is set up in the
area of 1000m² needs only 600m².
( Roshan et al ., 2015), report the performance of
two identical PV systems, one at a fixed latitude tilt
and the other on a two axis tracker. From August
2012 to March 2013 the tracker panel generates
21.2% more electricity than the fixed one, in India.
(De Simon Martin et al.,2014), have analyzed
the performance of three reel PV systems, fixed,
horizontal axis tracking and dual axis mount
tracking located in the same geographical area in
Spain.
(Bazyari et al., 2014), they study the effect of
the single axis and the two axes to the fixed one in
Qeshm Island of Iran in the summer of 2011. The
results of analyses show that the energy received by
the single axis system is 35% greater than energy
received by the fixed system, while the dual axis
received 4% more energy compared to the one axis
system. They conclude that the single axis tracker is
benefit to the Qeshm Island of Iran. Sharma et al.
[6], they analyze the performance of a 190kW PV
system in Khatkar-Kalan India, The performance
ratio of the PV system is 74% which is higher than
those in Greece, Poland and Germany but lower than
that in Ireland.
(Russin et al., 2013), they study performance of
PV systems from April 2012 to March 2013, in
Malaysia; the performance ratio for mono crystalline
was 77% while for polycrystalline was found to be
80%.
Performance study of a photovoltaic system
depends directly on the installation site, weather
conditions and environment. The region of Ghardaïa
has a very high solar energy potential which led us
to consider the production of electrical energy by
photovoltaic means. On the other hand the
geography of the site (rocky) imposes temperature
picks between day and night during the winters and
summer, as well as the peaks of wind speed in
autumn and spring (sand wind), which affects the
production of the systems.
To the best of our knowledge we have not found
a study of the performance of photovoltaic systems
with real time solar tracking, injecting the
production in the Sonelgaz grid, in our region.
In this column, the performance study of the first
2.25kWp PV system connected to the grid, mounted
on the real time solar tracking, located in the
Saharan climate. The system is installed in the site
named Noumirat Ghardaïa located 600km south of
Algiers.
2 PRESENTATION AND
MODELING OF THE SYSTEM
The solar panel is mounted on a real solar
tracker (figure 1), the Degger tracker 3000NT (the
characteristics of the 3000NT are in the appendix),
equipped with two circuits based on photo diode,
one fixed at the highest point of the panel for
horizontal scanning and the other fixed on the lateral
side for vertical scanning in order to track the focal
point of the power of the sun and positioning the
photovoltaic field always perpendicular to the solar
ray. The photovoltaic field has a power of 2.25kWp,
and is composed of 15 black mono-crystalline
modules (the module’s characteristics are quoted in
appendix), are connected in a single branch. The
IG15 Fronius inverter connected to the grid, has a
power of 1.3kW (the characteristics are in
appendix).
For the simulation of the system mounted
on fixed annual fixed angle structure facing south,
consisting of 15 modules. Black mono-crystalline
and an IG15 Fronius inverter, we proceeded to the
capture of weather data of the site on a horizontal
plane.
Figure: 1. Photovoltaic system mounted on the
sun tracker
ICCSRE 2018 - International Conference of Computer Science and Renewable Energies
410

The system is equipped with a meteorological
station that monitors the meteorological parameters of the
site (temperature, global irradiation on the module plan);
as well as an input and output electrical data acquisition
chain of the inverter (current and voltage of the DC input,
and current and voltage of the AC output). All
meteorological and electrical data is captured at a pace of
10 minutes and stored on a micro computer. These data
allowed us to monitor and analyze the performance of the
PVSGC. The system is in total sales mode; during the first
year (May 2016 to May 2017) of operation, all the energy
produced (3.614MWh) is injected into the internal grid of
the REARU, helping to reduce the unit electricity bill.
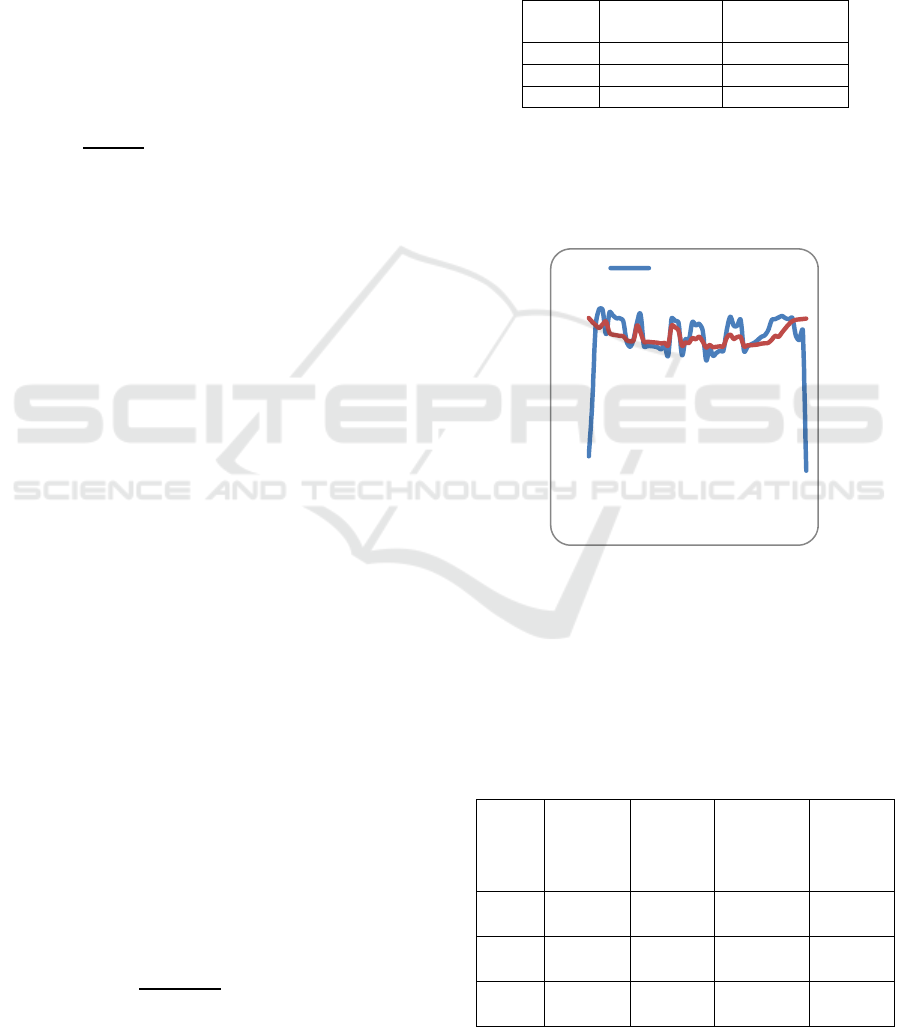
FIG. 2 represents the daily irradiation on the
modules plan with real time solar tracking and on the
modules plan without solar tracking and the ambient
temperature during all the day of February 08, 2017. The
maximum powers are reached between 9h and 16h, for the
tracker 1152W / m², while for the fixed 785.67W / m². At
the beginning of the day, at 7:30, the ambient temperature
is 10.6 ° C and at the end of the day, at 16:00 the
temperature reaches 19.7 ° C.
Figure: 2. The daily irradiation with sun tracking
and fixed slope, and the ambient temperature of the site,
08.Fubrary.2017 .
FIG. 3 shows the different parts of the
photovoltaic system connected to the grid in total sales
mode of the energy produced:
- The photovoltaic field consisting of
photovoltaic modules connected in parallel series in order
to obtain the voltage and the current in adequacy with the
inverter. A photovoltaic field is characterized by its
efficiency, and either its peak power or its surface.
- The inverter is the driver element of the
system; it transforms the continuous input energy into
output alternative energy injected into the grid. An
inverter is characterized by its power rating and its load
yield.
- The load for our case is the electrical grid,
which is characterized by its voltage 220V and a
frequency of 50Hz.
Figure: 3. Power plant grid-connected PVSGC
2.1. Photovoltaic Field Modelling
The most likely photovoltaic cell equivalent mathematical
model is the one composed of 5 parameters with only one
probe, the equivalent system is presented on figure 4.
Figure:4.Photovoltaic cell model
The expression of the current is (Ali et al, 2002), (Koussa
et al, 2012), (Habbati et al, 2013), (Azzedine et al, 2016),
(Attou et al, 2015), (Miric et Nedeljkavic, 2015), (Amrani
et DDib, 2016), (Ozcelik et Serdar, 2016), (Sarothi et Pal2,
2017) :
(1)
I
L
: photo generated current or photocurrent; I
0
: saturation
current of the diode; K: Boltzmann's constant (K=1.38*10
-
23
J/°K); e: electron charge ,(e=1.6 10
-19
C); m: ideality
factor of the diode (m=1-1.3); T: junction temperature
(°K); R
s
: series resistance due to the resistivity of grid,
(Ω); R
sh
: shunt resistance due to a leakage current, (Ω).
Neglecting the effect of different resistances (very high
Rsh, very small Rs), le
electric current is
expressed by :
(2)
Sh
SS
L
R
IRV
mKT
IRVq
III
1exp
0
1exp
0
KT
qV
III
L
Performance Analysis of PV System on Real Time Sun Tracking Structure for Grid Connection in Southern Algeria
411
As example if I
0
= 10
–12
A.cm
–2,
kT/q = 0,025 V, and Isc
= 4 x 10
–2
A.cm
–2
, Voc = 0,6 V
2.2 Photovoltaic Field Yield
We introduce the photovoltaic field yield model thanks to
the measures taken of the field PV. It is function of the
maximum power of the field PV P
max
, the received
irradiation on the surface of the field PV G, and the total
field surface PV Apv, following the formula (Koussa et al,
2012) :
∗
(3)
On the other hand, the commonly used relationship to
measure the photovoltaic field yield is function of the
reference temperature T
ref
= 25°, the junction temperature
TC and the coefficient of temperature is ( Macagnan et
Lorenzo, 1992) :
th
1β∗
TcTref
(4)
Where
: is the reference efficiency of the PV field (given at
standard conditions);
∗l
(5)
0.95, returns linked to losses in the PV
field (diodes, cables ...)
0.085∗0.950.08075 (6)
The literature about systems PV studies shows that the
parameter β range of values is :
β0.0025K
-1
and β0.008K
-1
.β0.0043K
-1
.
The equation of the cell internal temperature is function of
ambient temperature Nominative Operating Cell
Temperature (NOCT) (Koussa et al, 2012) and (Poggi,
2007) is :
∗ (7)
The figure 5 graphs the yield evolution during the day of
08/02/2017, and shows clearly the temperature effect on
the yield. Indeed, the theoretical field PV yield perfectly
fits the real field PV yield as long as the junction
temperature is high, that is, between 7:40 AM (sunrise) to
6:20 PM (sunset). The following tab reports it clearly :
Table 1:
Time Real yield PV Theoretical
Yield PV
07 :40 0.0139 0.1467
13 :20 0.1188 0.1215
18 :20 0 0.1472
We deduce that the theoretical yield of the
equation (4) perfectly describe the evolution of system PV
during the day.
Figure: 5. Evolution of theoretical and experimental
efficiencies during the day 08.Fubrary.2017.
On the Figure 6 is reported the irradiation and the junction
temperature of the stationary modules, and the irradiation
and junction temperature of the modules mounted on solar
tracker.
Table 2:
T
ime
S
tationary
I
rradiatio
n
[W/m²]
S
tationary
T
c [°]
T
racker
Irradiatio
n [W/m²]
T
racker
Tc [°]
07 :40 15.36 11.013 183.85 17.31
13 :20 785.67 46.28 1152.49 58.53
18 :20 11.69 18.48 19.16 18.137
PVefficiency
Time
RealPVefficiency
ICCSRE 2018 - International Conference of Computer Science and Renewable Energies
412
The cumulated irradiation received by the stationary field
PV is 4.42 (kWh/m
2
), and the cumulated irradiation
received by the solar tracking field PV is 7.95 (kWh/m
2
),
that is, double for the day partially covered 08/02/2017.
Figure: 6. Evolution of the irradiation and the junction cell
temperature on the fixed slope and real time sun tracking,
during the day on 08.Fubrary.2017.
After the modelling of the photovoltaic field described by
its yield, its peak power and its solar irradiation collecting
surface, we focus now on the inverter modelling, which is
the photovoltaic systems’ core.
2.3 Inverter Modelling
The Inverter is completely defined by its instant yield,
which is function of the power determined by the charge.
The Inverter yield is defined as follows (Poggi, 2007) ,
( Macagnan et Lorenzo, 1992) , (Schmid et Shmidt, 1991):
/
(8)
Where the denominator represents inverter losses:
(9)
According to ref. [20], the power loss is given by:
(10)
Where
: is a constant on-load loss, it is independent of the
power demand, : is a constant which expresses the
resistive losses of the inverter, p : the inverter nominal
power, Then the efficiency becomes:
⁄
(11)
Specific constants P
0
and k of the inverter are expressed
function of inverter yields at 10/100
(
87%)and 100/100 of its nominal charge
93.5%
).
So:
9 , and
1 (12)
In this case
0.01439 , and 0.0055129 .
The correlation coefficient is 99.7%, so the calculated
values and the measured values are identical.
The type of the inverter is limiting so the output power
cannot exceed the inverter nominal power. So we can
instantly measure the output power and calculate the
system production.
then,
11
0_/__0
^2_0_/_0_01
(13)
On the figure 7, is reported the efficiency of the
inverter according to the DC voltage. In the beginning of
the day when the DC voltage is 212.6V , the efficiency is
22%, and when DC voltage is 272V the efficiency
becomes 94% for the day, but at 16:30 (h) the efficiency
decrease to off the inverter.
Figure: 7. Inverter efficiency [%], according to the in
voltage DC [V], during the day on 08.Fubrary.2017.
Temperature'°c)
Irradiation(W/m²)
Time
Irrfixe(W/m²)
Inverterefficiency
IninverterDC[V]
Efficiency
Performance Analysis of PV System on Real Time Sun Tracking Structure for Grid Connection in Southern Algeria
413

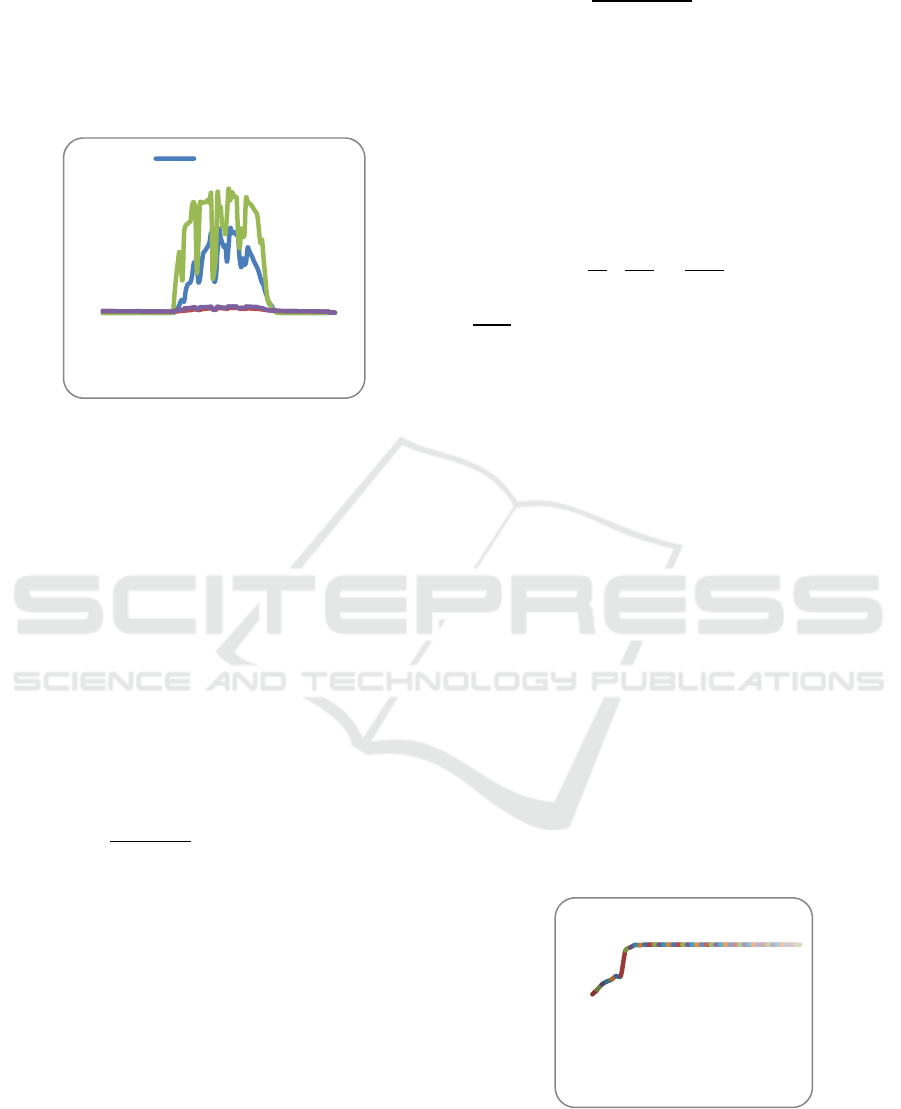
The figure 8 shows the instant yields evolution on typical
days of all months of the year, between May 2016 and
April 2017. As soon as the sunrise, and when the input
voltage DC reaches the start value of the inverter, the yield
range of values is about 94% from 9:00 AM to 4:00 PM,
and can rise depending on seasons.
Figure: 8 Yield performances for each typical day of each
month of the year
The Figure 9 shows the monthly average value of the
yield. The yield is higher in cold period, because the
temperatures of warm periods lower the yield.
The yearly average yield of the inverter is 93.33%.
Figure 9: Average monthly efficiency of the inverter
3 STUDY OF THE SYSTEM
PERFORMANCES
To conduct the study of the energy performances of
PVSCG, the evolution of the predicted and real energy
produced by horizontal fixed slope and real sun tracking
system are measured.
3.1 Comparison between Sun Tracking
System and Horizontal Fixed Slope
Figure 10, we report all real values of daily month average
irradiation on the surface of PV modules of horizontal
fixed slope and on the surface of PV modules of sun
tracking system.
The table 3: reports all specific values of the energy:
Epv fixe Epv sun tracking
January(low
alues)
4.42kWh/m² 7.954kWh/m²
June(high values) 6.635kWh/m² 10.265kWh/m²
The sun-tracking configuration is capable to provide
significant increase in the energy production over
horizontal fixed system of equivalent characteristics.
The annual daily average horizontal fixed slope irradiation
is (5.6215kWh/m²), and the annual daily average sun
tracking is (9.227kWh/m²). The energy produced by
system fixed on sun tracking structure is higher than one
fixed on horizontal fixed slope structure, by 64%.
Figure: 11 Daily month average of real DC energy and
predicted DC energy of PVSGC, and predicted Ep fixe.
Efficiency
Time
January
Febrary
March
April
May
June
July
Month
Everage monthly
efficiency
Energy(kWh)
Month
predictedEPfixe
ICCSRE 2018 - International Conference of Computer Science and Renewable Energies
414

In figure 12, the monthly energy produced by the
real PV system with the intelligent control of
DEGERtraker, and the monthly energy injected to the
network. The report between the Epv and the Eac is equal
to (93%), so this is the inverter efficiency.
Figure12 Monthly energy produced by PV field Epv;
monthly energy injected into the power grid Eac.
3.2 Performance of the System
For normal operation, the change in the production
of electric energy from a PV system follows the change in
the sunshine. A detailed study of parameters that describe
clearly and precisely how the various components of the
system for the duration of the study is necessary. For this,
the normalized performance parameters (standard IEC
61724) (IEC, 1998) are used to define the overall
performance of the system in terms of energy production,
solar resource and the overall effect of the system losses.
The normalized performance parameters were established
to provide the necessary information on the design of the
PV system, the evaluation of their performance. They are
normalized to compare the performance of PV systems,
according to the geographical location, technology and
design. These parameters (Haeberlin and Beutler, 1995);
(Marrion et al, 2005), are (Schmid et Shmidt, 1991), (
Hadj Arab et al, 2005), (Haeberlin. et Beutler, 1995),
(Marion et Hayden , 2005):
‐ Array yield Y
A,
Fig: 13, it is a system
productivity in a period of time (day, week,
month, year…). This parameter is defined as a
ratio of the energy produced by PVSGC plants
in a period of time t to the installed PV power.
,
,
(14)
Figure : 13 Array yield Ya.
‐ Field Yield YF, Fig:14, defined as the ratio of
the useful energy generated by the system in a
period of time with a rated power installed.
Gnom
f
P
tEGPV
Y
,
,
(15)
Figure: 14 Normalized final productivity of PV generator
‐ Reference Yield Y
R
, Fig:15, is the ratio of solar
irradiance received by the PV array to the solar
irradiance at the standard conditions.
Y
,
(16)
Figure : 15 Normalized reference productivity
‐ Performance ratio PR, Fig:16, defined as the
global efficiency of the system. It is determined
Monthlyenergy(kWh)
Month
Epvmonth
Month
Ya
Month
Yf
Month
Yr
Performance Analysis of PV System on Real Time Sun Tracking Structure for Grid Connection in Southern Algeria
415

by the ratio of the final yield to the reference
yield. This parameter is independent of the PV
plant size and its emplacement. Also, it is used
to compare the behavior.
Pr
(17)
Figure:16: Pr performance index
PR is therefore an estimate of all the losses that
distinguishes the real system without theoretical loss
system. We find that this PVSGC system gives very
satisfactory results. Based on the Fig. 16, the average
yearly value of Pr is 80%, for the installed system.
In the table 4, is recorded the PV module efficiency,
the inverter efficiency and the performance index Pr, for
installed PV systems all around the world. The parameters
of our PV system are as well as other systems.
Table 4: Comparison with other installed systems in the
world.
Country
pv
(%)
inverter
(%)
Pr Reference
Spain 13.7 89.5 0.69
(Miguel et al,
2002)
Italy 3.7 90-91 0.66
(Dunlop et al,
1997)
Brazil 3.7 91 0.5-0.81
(Ruther et
Dacoregio,
2000)
Ireland 7.5-10 87 0.6-0.62
[27] (Mondol
et al, 2006)
Malaysia 10.11 95.15 0.77
(Farhoodnes
et al, 2015)
North
Algeria
7-10 87-96
0.62-
0.82
(Cherfa et al,
2015)
South
Algeria
11-15 92-94
0.44-
0.88
Present
system
4 CONCLUSION
The first PV plant connected to the grid based on
polycrystalline modules, installed in the Algerian Sahara,
has been investigated during the period of May 2016 to
May 2017, all energy generated was fed into the low
voltage net work supply to the URAER building. During
this period are measured and analyzed daily and monthly
parameters of system, thanks to real time climatic and
performance measurements for all 5 minutes. The average
annual Daily energy of 9.89kWh is injected on the grid.
The annual daily average horizontal fixed slope
irradiation is (5.6215kWh/m²), and the annual daily
average sun tracking is (9.227kWh/m²). The energy
produced by system fixed on sun tracking structure is
higher than one fixed on horizontal fixed slope structure
by 64%.
PR is therefore an estimate of all the losses that
distinguishes the real system without theoretical loss
system. We find that this PVSGC system gives very
satisfactory results compared to PV systems installed all
around the world. The average yearly value of Pr is 80%,
for the installed system.
ACKNOWLEDGMENT
This project was financially supported by the Directorate
General for Scientific Research and Technological
Development - Algerian Ministry of Higher Education and
Scientific Research.
REFERENCES
T. Filik , Ü. Başaran Filik «Efficiency analysis of the solar
tracking pv systems in eskişehir region », Anadolu
University Journal of Science and Technology A-
Applied Sciences and Engineering; 2017 - Volume:
18 Number: 1
Sinan Kivrak, Mustafa Gunduzalp, Furkan Dincer
«Theoretical and experimental performance
investigation of a two axis solar tracker under the
climatic condition of Denizli », Turkey; (Electrical
Review), ISSN 0033-2097, R. 88 NR 2/2012
Roshan R. Rao, H. R. Swetha, J. Srinivasan and Sheela K.
Ramasesha; «Comparison of performance of solar
photovoltaics on dual axis tracker with fixed axis at
13N latitude » ; CURRENT SCIENCE, VOL. 108,
NO. 11, 10 JUNE 2015
Miguel de Simón-Martín, Cristina Alonso-Tristán,
Montserrat Díez-Mediavilla, « Performance Indicators
Month
Prreel
ICCSRE 2018 - International Conference of Computer Science and Renewable Energies
416

for Sun-Tracking Systems: A Case Study in Spain » ;
Energy and Power Engineering, 2014, 6, 292-302
Shahriar Bazyari, Reza Keypour, Shahrokh Farhangi,
Amir Ghaedi, Khashayar Bazyari; «A Study on the
Effects of Solar Tracking Systems on the Performance
of Photovoltaic Power Plants» Journal of Power and
Energy Engineering, 2014, 2, 718-728
Vikrant Sharma, S.S. Chandel, « Performance analysis of
a 190 kWp grid interactive solar photovoltaic power
plant in India », Energy 55 (2013) 476e485
M. Z. Russin, Z. M. Zain, A. M. Omar, F. Sulaiman, S.
Shaari ; « Two-Year Performance Monitoring of
AmorphousSilicon Grid-Connected Photovoltaic
System»; 2013 IEEE Conference on Systems, Process
& Control (ICSPC2013), 13 - 15 December 2013
Ali H. Abdullah, Adel A. Ghoneim, Ahmad Y. Al-Hasan,
« Assessment of grid-connected photovoltaic systems
in the Kuwaiti climate», Renewable Energy 26 (2002)
189–199.
M.Koussa, M.Haddadi, D.Saheb, A.Malek, S.Hadji :
«Sun tracking mechanism effects on flat plate
photovoltaic system performances for different step
time and main parameters affecting the obtained gains:
case of North Africa and Mediterranean site», Energy
Procedia 18 ( 2012 ) 817 – 838.
A. Habbati Bellia,1 Y. Ramdani,1F. Moulay,1K. Medles:
«1IRRADIANCE AND TEMPERATURE IMPACT
ON PHOTOVOLTAIC POWER BY DESIGN OF
EXPERIMENTS», Rev. Roum. Sci. Techn. –
Électrotechn. et Énerg., 58, 3, p. 284–294, Bucarest,
2013
A. H. A. Azzeddine, M. Tioursi, D.-E. Chaouch, B.
Khiari: «An offline trained artificial neural network to
predict a photovoltaic panel maximum power point»,
Rev. Roum. Sci. Techn.– Électrotechn. et Énerg.Vol.
61, 3, pp. 255–257, Bucarest, 2016
A. Attou, A. Massoum, M. Chadli: « Comparison study of
two tracking methods for photovoltaic systems», Rev.
Roum. Sci. Techn. – Électrotechn. et Énerg., 60, 2, p.
205–214, Bucarest, 2015
S. Mirić, M. Nedeljković : « The solar photovoltaic panel
simulator», Rev. Roum. Sci. Techn. – Électrotechn. et
Énerg., 60, 3, p. 273–281, Bucarest, 2015
M. N.AMRANI, A .DIB : « Direct power control for a
photovoltaic conversion chain connected to a grid »,
Rev. Roum. Sci. Techn.– Électrotechn. et Énerg. Vol.
61, 4, pp. 378–382, Bucarest, 2016
Z. Amokrane, M. Haddadi, N. Ould cherchali: « Nouveau
procédé de traçage de la caractéristique des
générateurs photovoltaïques dans les conditions de
fonctionnement réelles», Rev. Roum. Sci. Techn.–
Électrotechn. et Énerg. Vol. 62, 3, pp. 276–281,
Bucarest, 2017
M. A. Ozcelik, A. Serdar Yilmaz : « Modification of the
incremental conductance algorithm in grid connected
photovoltaic systems », Rev. Roum. Sci. Techn.–
Électrotechn. et Énerg. Vol.
61, 2, pp. 164–168,
Bucarest, 2016
P. Sarothi Sikder, N. Pal2: « Incremental conductance
based maximum power point tracking controller using
different buck-boost converter for solar photovoltaic
system», Rev. Roum. Sci. Techn.– Électrotechn. et
Énerg. Vol. 62, 3, pp. 269–275, Bucarest, 2017
Macagnan M.H., Lorenzo E., (1992), «On the optimal size
of inverters for grid connected PV systems». 11th E.C.
Photovoltaic Solar Energy Conference, Montreux,
1167-1170.
Poggi P., «intégration des systemes energetiques a
sources renouvelables dans les reseaux electriques
insulaires», universite de corse pasquale paoli,
Discipline : ÉnergÉtique et GÉnie des ProcÉdÉs,15
Décembre 2007
Schmid J., H. Schmidt. H., (1991), «Inverters for
Photovoltaic Systems”, 5th Contractor's Meeting of
the EC Photovoltaic Demonstration Projects», Ispra,
Italie, 122-132.
A. Hadj Arab
, F.Cherfa
, A.Chouder
and F. Chenlo,
«Grid-connected photovoltaic system at CDER,
Algeria», 20th European Photovoltaic Solar Energy
Conference, 6-10 June 2005, Barcelona, Spain.
Haeberlin H. et Beutler Ch., (1995), «Normalized
Representation of Energy and Power for Analysis of
Performance and On-line Error Detection in PV
Systems», 13th European Photovoltaic Solar Energy
Conference, Nice, October 23-27.
Marion B., Hayden H., (2005), «Performance Parameters
for Grid-Connected PV Systems», 31
st
IEEE
Photovoltaic Specialists Conference and Exhibition -
Lake Buena Vista, Florida.
AD.Miguel and Al., «Performance analysis of a grid-
connected PV system in rural site in the Northwest of
Spain». World Renew able Energy Congress VII 2002,
Cologne, Germany
EW. Dunlop and Al., «Electrical characterization and
analysis of operating conditions of amorphous silicon
building integrated photovoltaic modules». In: 14th
European PV solar energy conference 1997,
Barcelona, Spain. p. 2037– 41.
R. Ruther, MM. Dacoregio, «Performance assessment of a
2 kWp grid-connected, building integrated, amorphous
silicon photovoltaic installation in Brazil». Prog.
Photovoltaic’s: Res Appl 2000; 8:257–66.
J.D. Mondol and Al., « Long-term performance analysis of
a grid connected photovoltaic system in Northern
Ireland». Energy Conversion and Management Vol.47
(2006) 2925–2947
M. Farhoodnes, 1A. Mohamed, T.Khatib, W. Elmenreich
« Performance evaluation and characterization of 3-
kWp grid connected photovoltaic system based on
tropical field experimental results: new results and
comparative study», Renewable and Sustainable
Energy Reviews 42 (2015) 1047-1054.
Cherfa, F., Hadj Arab, A., Oussaid, R., Abdeladim, K.,
Bouchakour, S.
«Performance analysis of the mini-grid connected
photovoltaic system at Algiers»
(2015) Energy Procedia, 83, pp. 226-236.
Performance Analysis of PV System on Real Time Sun Tracking Structure for Grid Connection in Southern Algeria
417

ANNEXES :
Table 1 Module Performance under standard test
conditions (STC): SW150
Maximum power Pmax 150W
Open circuit voltage Uoc 22.5V
Maximum power
point voltage
Umpp 18.3V
Short circuit current Isc 8.81A
Maximum power
point current
Impp 8.27A
Table 2 Inverter Fronius IG15 :
Specifications Input:
IG15 :
Recommended connection power 1300 – 2000 Wp
MPP voltage range 150 – 400 V
Max input voltage at (STC) 500V
Max input current 10.75 A
Output characteristics:
IG15 :
Rated output power 1.3kW
Max output power 1.5kW
Rated network voltage 230V +10 / -15%
Nominal output current 5.7A
Rated frequency 50 +/- 0.2 Hz
Distortion < 3%
Power factor 1
maximum efficiency 94.2 %
Euro yield 91.4 %
ICCSRE 2018 - International Conference of Computer Science and Renewable Energies
418
