
Visualization of Air Quality Conditions in Medan City
Azhari
1,2
, Lukman Hakim
1,2
and Fathurrahman
1,2
1
Department of Physics, Faculty of Mathematics and Natural Sciences, Universitas Sumatera Utara, Medan, Indonesia
2
Integrated Research Laboratory, Universitas Sumatera Utara, Medan, Indonesia
Keywords: Visualization, Air Quality.
Abstract: Visualization of urban air pollution requires massive data processing because it has to create a map of air
pollution in either two dimensions or three dimensions and we have to deal with geographical data, that is,
GIS data. Weather data are multivariate and contain plane vectors formed by wind speed and direction.
Several tools are used to detect air quality. Data points are marked with location and time using on-board
GPS. Periodically, measurements are uploaded to the server, processed and then published on the Sensor
Map portal. With a sufficient number of nodes and diverse mobility patterns, a detailed picture of air quality
over a large area will be obtained at low temperatures. The purpose of this study is to determine the
visualization of air quality conditions in the city of Medan using pollutant sensors based on regional
mapping of Medan. With this research, it is expected that a tool that can read the data of pollutant conditions
in Medan will be obtained. This research method begins with hardware design using CO gas sensors namely
TGS 822, SHT31 temperature and humidity, GPS sensor, and SPS 30 sensor as particulate sensors. The
device is then connected to Bluetooth so that it is connected to a PC and can be read in realtime.The tool can
be used on cars with 9V power source. The tool is then used to detect pollution at several sample points that
represent the city of Medan as a whole. The results of the reading of pollutant values are then processed and
used to visualize the condition of air quality in the city of Medan. Based on the results of calibration testing
and measurement of ambient air quality in the city of Medan, obtained air quality data in the field city
during the test time has an AQI value ranging from 30 to 90 which shows that the air quality in Medan is
still relatively moderate.
1 INTRODUCTION
In 2012 WHO reported that around 7 million deaths
or 1/8 global deaths were caused by air pollution.
The highest fatalities are in low to middle income
countries namely in the Southeast Asian region with
a total of 1.69 million deaths due to air pollution
(WHO, 2014). Several countries and big cities have
implemented various policies to reduce the impact of
this air pollution (Smedley Team. 2017). Some of the
studies that have been conducted include the first
research that has designed a gas emission test device
in real time and was monitored via the web (Smedley
Team, 2017; Fikri, 2013; Rochmana et al., 2016).
Based on the Decree of the Minister of Health of
the Republic of Indonesia number 1407 of 2002
concerning Guidelines for Controlling the Impact of
Air Pollution, air pollution can be defined by the
entry or inclusion of substances, energy, and/or other
components into the air by human activities, so that
air quality drops to a certain level causing or affect
human health (Kadir, 2013). Increased industrial
development and increasing population will produce
a quantity of types of transportation that have an
influence on air quality in an urban setting (Mukono,
2011).
The air quality index is generally calculated based
on five main pollutants, namely surface
oxidants/ozone, particulate matter, carbon monoxide
(CO), sulfur dioxide (SO) and nitrogen dioxide (NO).
However, at present the calculation of the air quality
index uses two parameters namely NO and SO The
NO parameter represents emissions from motor
vehicles that use gasoline, and SO represents
emissions from industry and diesel vehicles that use
diesel fuel and other sulfur-containing fuels (Ministry
of Environment and Forestry, 2018). Carbon
monoxide (CO) is a pollutant. Based on estimates,
the amount of CO in Indonesia is estimated at close
to 60 million tons/year. One-eighth of this amount
comes from motorized vehicles that use gasoline and
a third come from stationary sources. Even though
112
Azhari, ., Hakim, L. and Fathurrahman, .
Visualization of Air Quality Conditions in the City of Medan.
DOI: 10.5220/0010137200002775
In Proceedings of the 1st International MIPAnet Conference on Science and Mathematics (IMC-SciMath 2019), pages 112-116
ISBN: 978-989-758-556-2
Copyright
c
2022 by SCITEPRESS – Science and Technology Publications, Lda. All rights reserved
carbon monoxide is a flammable gas and very
poisonous to humans. In the World Health
Organization report, WHO is estimated that at least
one type of air pollution in large cities has exceeded
the tolerance limit of air pollution (The World Bank,
1994).
There is a very strong need we have to make
urban air pollution maps that can be efficiently and
easily used to help city officials to provide citizens
with a pleasant and safe urban environment: The
World Health Organization (WHO) states that 2.4
million people die every year from causes that are
directly linked to air pollution and we still remember
terrible memories of the Great Smog of 1952 in
London, England (Qu et al., 2007; Völgyesi et al.,
2008). Atmospheric particulate matter is a criterion
commonly used to evaluate air quality (Park et al.,
2011; Janssen et al., 2013). The level of adverse
health effects depends on the size and composition of
the particles (Zirui et al., 2015). PM2.5 and PM10 are
defined as particles with a diameter of 2.5 μm or less
and 10 μm or less, respectively; this parameter is
usually measured using the air quality index (AQI).
AQI is calculated from particle concentrations at the
monitoring station expressed as micrograms per
cubic meter (Popeet al., 2002). According to
technical regulations on the ambient air quality index
(on trial) (Air Quality Index, 2019), the air pollution
index for PM2.5 is divided into six levels, namely, 0-
50, 51-100, 101-150, 101-150, 151-200, 201-300,
and greater than 300. With this level, we can identify
the severity of air pollution.
2 RESEARCH METHOD
2.1 Tool Design and Manufacturing
2.1.1 Block Diagram
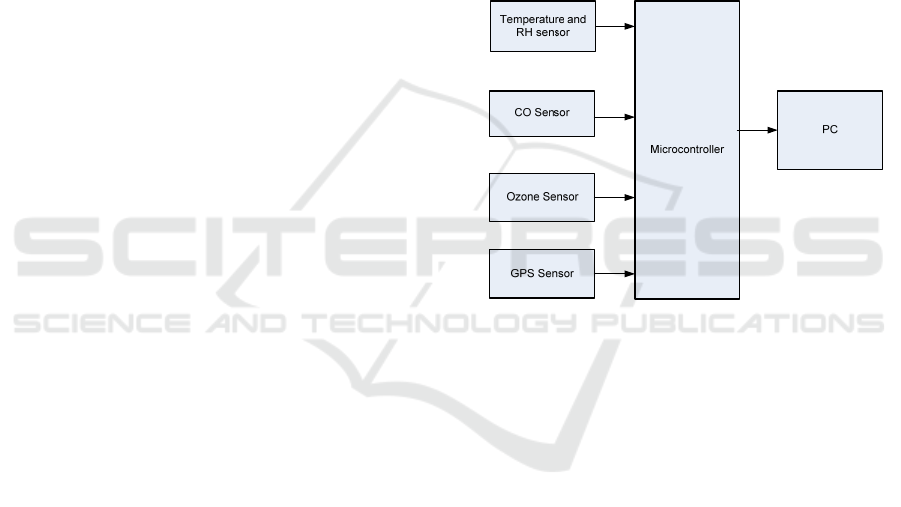
The hardware design of the air quality monitoring
system consists of Arduino Uno microcontroller,
TGS 822 sensor, MQ-135 sensor, SHT-31, GPS,
Ozone Sensor, and Arduino Uno. In general, system
hardware design is as follows:
1. The MQ-135 sensor is a sensor that will detect
carbon dioxide gas which is represented as a
CO
2
gas sensor. This sensor output in the form
of analog voltage.
2. The TGS 822 sensor is a sensor that will detect
carbon monoxide gas which is represented as a
CO gas sensor. This sensor output in the form of
analog voltage.
3. The SHT-31 sensor is a sensor that will detect
temperature and humidity.
4. GPS sensor is a sensor that will detect the
location/position of the sensor against latitude
and longitude.
5. Ozone Sensor is a sensor that will detect ozone
gas. This sensor output in the form of analog
voltage.
6. Arduino Uno Microcontroller which functions
as a control center for all sensors.
Arduino microcontroller is the main component
that functions as a data processing center that will be
processed before sending to the viewer (PC) via
bluetooth. PC functions as a viewer of data obtained
from the sensor so that it can be directly seen
visually.
Figure 1. System work block diagram
2.1.2 Arduino Uno Microcontroller Circuit
Arduino is an electronic kit or open source
electronic circuit board in which there are main
components, namely a microcontroller chip with
AVR type from Atmel company. The Arduino
programming language is C language. But this
language has made it easier to use simple functions
so that beginners can learn it quite easily.
Visualization of Air Quality Conditions in the City of Medan
113
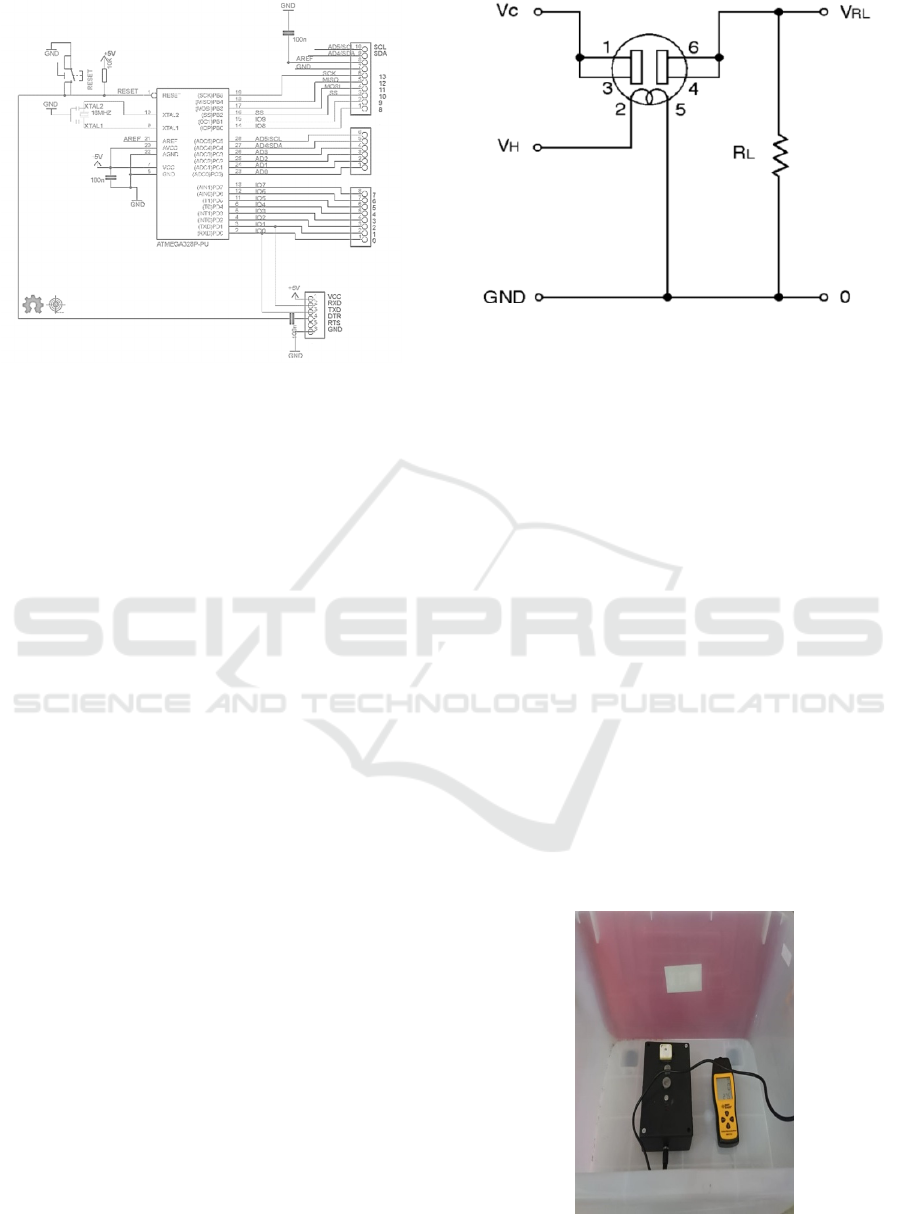
Figure 2. Arduino Uno Microcontroller Schematic
(Source: www.electroschematics.com)
The vehicle exhaust emission measurement tool
uses Arduino Uno which uses the ATmega 328
microcontroller as the central working controller of
all design tools, including reading sensor
measurement results and changing sensor
measurement results to digital because the sensor
output is analog. From figure 2, Arduino Uno
microcontroller is programmed using the Arduino
IDE software which is sent through a computer USB
port. The power supply used is 9V connected at 30
(VIN) and 29 (GND).
2.1.3
TGS Sensor Circuit 822
The sensing element of Figaro gas sensors is a tin
dioxide (SnO
2
) semiconductor which has low
conductivity in clean air. In the presence of a
detectable gas, the sensor's conductivity increases
depending on the gas concentration in the air. A
simple electrical circuit can convert the change in
conductivity to an output signal which corresponds
to the gas concentration. TGS 822 has high
sensitivity to the vapors of organic solvents as well
as other volatile vapors. It also has sensitivity to a
variety of combustible gases such as carbon
monoxide, making it a good general purpose sensor.
Figure 3. TGS Sensor Circuit 822 (Source:
www.researchgate.net/figure)
The structure of the sensor is shown in Figure 3.
TGS 822 is the main transducer used in this circuit,
which is a gas sensor. This sensor has a resistance
value of Rs that will change when exposed to gas
and also has a heater that is used to clean the sensor
room from outside air contamination.
2.2 Design and Manufacture of
Software
Software design is needed because in order to run
the Arduino Uno system the ATMega328P
microcontroller chip will be filled with the desired
command program.
3 RESULT AND DISCUSSION
a. Ambien CO Test Equipment Calibration
Results
Tool calibration is done using the CO meter shown
as shown in the following test:
Figure 4. Tool calibration process
IMC-SciMath 2019 - The International MIPAnet Conference on Science and Mathematics (IMC-SciMath)
114

The test is carried out in a closed container for 10
minutes. After that given the smoke coming from
burning paper then a fan will make the smoke spread
evenly in the container so that it triggers the sensor
to detect the smoke content in the air inside the
container. Standard tools and tools for CO sensor
design are Sensor TGS 822. After processing the
data, the graph is obtained as figure 5.
Figure 5. CO calibration regression graph with the TGS
822 sensor
In Figure 5 the test results using the TGS 822 sensor
compared with the CO meter tool obtained a
regression equation y = 0,0003x
2
- 0.3104 + 104
with a value of R
2
= 0.9997. A large R
2
value
indicates a strong correlation between the data from
the CO meter with the TGS 822 sensor.
Tool testing is done by attaching the tool to
the hood and connected to the 9V power source in
the car. Tests carried out in the afternoon during
rush hour (between 16:00 to 18:00) and carried out
observations along the road. The reading results can
be seen in realtime via a PC by connecting via a
Bluetooth network. The sensor voltage source is 9V
power that is owned by the car. The data collected
included temperature and humidity, latitude and
longitude, and CO content in ambient air. This can
be seen in Figure 6.
Figure 6. Reading of the ambient CO value via a PC
One of the sampling locations is the Medan Johor
area, Jl. Eka Rasmi and Jl. Karya Jaya. The results
of the reading can be seen in Figure 7.
Figure 7. Graph of CO Ambient
From the graph shown in Figure 7 it can be seen that
the air on Jl. Eka rasmi has a lower ambient CO
value compared to the CO value from Jl. Karya Jaya.
This is because Jl. Karya Jaya has a larger vehicle
volume because it connects several roads including
works of love, devoted work, eka rasmi, iridescent
and eka surya. While Jl. Eka Rasmi has a smaller
volume of vehicles because it is a branch road from
the victorious works and tourist works. Next is to do
an Air Quality Index (AQI) calculation which can be
determined using the following formula:
𝐼
𝐼
𝐼
𝑋
𝑋
𝑋𝑥 𝑋𝑏
𝐼𝑏
Real ambient concentration (ppm). Real AQI figures
I = Air Pollution Standards Index calculated
Ia = Air Pollution Standards Index upper limit
Ib = Air Pollution Standards Index lower limit
Xa = Ambient upper limit
Xb = Ambien lower limit
Xx = Real ambient level measurement results.
Figure 8. Graph of ambient air in some area in Medan
Visualization of Air Quality Conditions in the City of Medan
115

Measurement of the air quality index in the city
of Medan and surrounding areas in October or
during testing showed values between 30 to 90
shown in the graph in Figure 8. From the graph it
can be seen that the Medan city area, Medan
Sunggal, and Delitua have almost the same value in
various points and is an area that has the highest
AQI value (the lowest air quality) compared to the
other three. While Labuhandeli is the area with the
lowest AQI value so that the air quality is still better
compared to other places. But overall these values
indicate that air quality in the city of Medan and its
surroundings is still classified in the medium
category.
4 CONCLUSIONS
After testing and analyzing the data obtained,
conclusions can be drawn including:
a. The tool can measure ambient air quality with
sensor.
b. Based on the results of sensor testing and testing
of measuring devices, the measurement of
ambient quality air in Medan works well.
c. The Air Quality Index in the city of Medan and
its surroundings shows a value between 30 to
90.
ACKNOWLEDGEMENTS
The authors acknowledge the financial support of
this research by Universitas Sumatera Utara in
accordance with the USU Talent Research
implementation contract for fiscal year 2019
Number: 4167 / UN5.1.R / PPM / 2019 dated 1
April 2019.
REFERENCES
WHO, 2014. Air Pollution.
http://www.who.int/topics/air_pol lution/en/
Smedley Team. 2017. The way the biggest cities in the
world fight the smog. Jakarta : BBC News.
Ansar Suyuti. Web-Based Gas Emission Level Monitoring
of Diesel Power Plant using Multi-Sensors,
International Journal of Engineering and Innovative
Technology (IJEIT)
Fikri, Y. 2013. Atmega 8535 Microcontroller Based Air
Quality Monitoring System with TCP/IP
Communication Protocol, Semarang: Electrical
Engineering, Universitas Diponegoro.
Diyah Amiati Rochmana, Sumardi, and Budi Setiyono.
2016. Wireless data acquisition for TCP/IP-based air
quality monitoring systems. Transient, Vol.5., No.2,
Juni 2016, ISSN : 2302-9927, 106.
Kadir, A. (2013). A Practical Guide Learning
Microcontroller Applications and Programming Using
Arduino. Yogyakarta: Andi Publisher.
Mukono, H.J. 2011. Health Aspects of Air Pollution.
Unair Publishing and Printing Center: Surabaya.
Data and Information Center of the Ministry of
Environment and Forestry. 2018. Environmental
quality index 2017. Jakarta: Ministry of Environment
and Forestry.
The World Bank Country Studi. 1994. Indonesia
Environment and Development. Washington DC, p
67-93
H. Qu, W. Chan, A. Xu, S. Member, and K. Chung,
“Visual Analysis of the Air Pollution Problem in Hong
Kong,” IEEE Trans. Vis. Comput. Graph., vol. 13, no.
6, pp. 1408–1415, 2007.
P. Völgyesi, A. Nádas, X. Koutsoukos, and Á. Lédeczi,
“Air Quality Monitoring with SensorMap,” pp. 529–
530, 2008.
J. W. Park, C. H. Yun, H. S. Jung, Y. Woo, and L. E. E.
Corresponding, “Visualization of Urban Air Pollution
with Cloud Computing,” 2011 IEEE World Congr.
Serv., pp. 578–583, 2011.
Janssen, N.A.H.; Fischer, P.; Marra, M.; Ameling, C.;
Cassee, F.R. Short-term effects of PM2.5, PM10 and
PM2.5´10 on daily mortality in the Netherlands. Sci.
Total Environ. 2013, 463, 20–26. [CrossRef]
[PubMed]
Zirui, L.; Bo, H.; Dongsheng, J.; Yonghong, W.;
Mingxing, W.; Yuesi, W. Diurnal and seasonal
variation of the PM2.5 apparent particle density in
Beijing, China. Atmos. Environ. 2015, 120, 328–338.
Pope, C.A.; Burnett, R.T.; Thun, M.J.; Calle, E.E.;
Krewski, D.; Ito, K.; Thurston, G.D. Lung cancer,
cardiopulmonary mortality, and long-term exposure to
fine particulate air pollution. Jama-J. Am. Med. Assoc.
2002, 287, 1132–1141. [CrossRef
Revised Air Quality Standards for Particle Pollution and
Updates to the Air Quality Index (AQI). Available
online:
http://www.epa.gov/airquality/particlepollution/2012/decfs
standards.pdf [accessed on 25 February 2019]
IMC-SciMath 2019 - The International MIPAnet Conference on Science and Mathematics (IMC-SciMath)
116
