
Analysis on the Effect of Subsea Buoy to the Tension of Spread
Mooring System
Murdjito, Madea Eka Silfiani and Eko Budi Djatmiko
Department of Ocean Engineering, Institut Teknologi Sepuluh Nopember, Surabaya, Indonesia
Keywords: FSO, Spread Mooring, Subsea Buoy, Tension.
Abstract: The problem that might occur in floating structures with mooring systems is clashing between mooring lines
with subsea equipment, for example pipelines. Addition of subsea buoys on the mooring line can lift the
mooring line so that it can avoid clashing. The addition of the subsea buoy can affect tension on the mooring
line. This research discusses the effects of subsea buoy to the tension of mooring line with a variation position
of subsea buoy. Variations on the position of one subsea buoy is arranged at the distance of 605 m, 577.5 m,
550 m, 522.5 m from anchor and two subsea buoys at the distance 605 m and 467.5 m from the anchor. The
analysis was carried out on stand alone and offloading conditions with wave directions 0°, 45°, 90°, 135°,
180°. The results after the addition of subsea buoys it has a smaller tension on the mooring line. The result of
the variation of subsea buoy position, the optimum position to get the smallest tension value is when the
variation of two subsea buoys with a distance of 605 m and 467.5 m from the anchor. From the results of the
analysis there is also no clashing between the mooring line and pipeline.
1 INTRODUCTION
Natuna is an area at the northern end of the Karimata
Strait. This area is one of the largest oil and gas
reserves in the world. Natuna is an area where there
are many offshore structure for oil and gas
exploration, either fix structure or floating structure.
At present, the development of offshore structure
design technology is continuing to explore oil and gas
in the Natuna area. One of them is the construction of
Floating Storage and Offloading (FSO).
Floating Storage Offloading (FSO) is a floating
structure in the form of a ship which serves to store
hydrocarbons and transfer to vessels or barges. In its
operation the FSO structure is movement caused by
environmental loads, such as waves, wind and
currents. So that the mooring system is needed on the
FSO structure. The purpose of this mooring system is
to limit movement and keep the FSO in place.
One type of mooring system that is usually used
is spread mooring. The mooring system consists of
several mooring lines that spread and are moored to
the seabed using anchors. This system does not allow
the ship to move or spin to reach a position where
environmental effects such as wind, current, and
waves are relatively small.
The construction of mooring systems there are
many factors that must be considered, one of the
distance between the mooring line and the mooring
line or with other subsea equipment. Clashing
between the mooring line and the pipe is one of the
problems that can be found. The addition of the
subsea buoy on the mooring line can avoid clashing
between the mooring line and the pipe, because the
subsea buoy can lift the mooring line so that clashing
does not occur. Addition of the subsea buoy can affect
the tension on the mooring line. This research
discusses the effect of adding subsea buoys to the
tension of mooring line with a variation of one subsea
buoy with four variations of position and two subsea
buoys.
2 LITERATURE REVIEW
Many studies and research analyze variations in
mooring system designs, such as subsea buoy
analysis on mooring systems. Examples of numerical
analysis on hybrid mooring systems with clump
weights and buoys by Yuan Z.M. et al. (2014) which
analyzed the type of new mooring line, hybrid
mooring system with clump weigth and buoys
(HMSWB). In this study Yuan Z.M only analyzed the
236
Murdjito, ., Silfiani, M. and Djatmiko, E.
Analysis on the Effect of Subsea Buoy to the Tension of Spread Mooring System.
DOI: 10.5220/0010141902360244
In Proceedings of the 7th International Seminar on Ocean and Coastal Engineering, Environmental and Natural Disaster Management (ISOCEEN 2019), pages 236-244
ISBN: 978-989-758-516-6
Copyright
c
2021 by SCITEPRESS – Science and Technology Publications, Lda. All rights reserved

effect of buoys on (HMSWB) because previously the
influence of the clump weight was discussed by Ji
C.Y. et al. (2011). This study concluded that installed
buoys can reduce tension on the mooring line.
Sundaravadivelu (1991) has a study that the
increase in submerged buoy net bouyancy can reduce
the excurce of the buoy. The buoys used in the study
were single point subsurface mooring. Fitria, Favi
Ainin (2018) conducted a research on adding clump
buoys to mooring systems which aimed to see the
effect of adding clump buoys to mooring line tension
and avoiding the potential for clashing between
mooring lines. The results of the study that the
addition of a clump buoy on the mooring line can
reduce tension and also clashing between the mooring
lines. Mavrakos (1997) analyzed the effect of adding
submerged buoys in the deep sea and has variations
in the number, size, and position of the submerged
buoy. The next analysis is the effect of adding
submerged buoy to the tension and dry length on a
single point mooring mooring system (Suseprasetyo,
2013). This analysis get the results of the submerged
buoy displacement in proportion to the amount of dry
length and the farther position of the submerged buoy
from fairlead has smaller tension.
3 OBJECTIVES AND SCOPE OF
STUDY
The objective of this research is to comprehend how
the subsea buoy in the mooring system affects the
tension of mooring line. The responses which to be
analysed are tension of mooring line, maximum
offset, and clashing between mooring line and
pipeline. The scope of study and boundaries of this
research are as follows.
- The mooring system used is spread mooring.
- FSO is analyzed in full load and ballast condition.
- Environmental data uses data in Natuna.
- Collinear environmental loading conditions.
- Variation of one subsea buoy at a distance of 605
m, 577.5 m, 550 m, 522.5 m from the anchor.
- Variation of two subsea buoys at a distance of 605
m and 467.5 m from the anchor.
- The size of the subsea buoy is fixed.
- Dynamic analysis using time domain method.
4 METHODOLOGY
The flow and procedure of this research was
conducted in stages as follows.
- Structural data uses Belida FSO data which is a
conversion from tankers, shuttle tanker data, &
environmental data using data in Natuna.
- Modelling FSO & shuttle tanker
- Model validation is to ensure the modeling is
accordance with the original structure. Validation
by comparing the hydrostatic data from the
software with the original hydrostatic data. Model
validation using reference from ABS (2018).
- Mooring system modeling, which uses a spread
mooring type with eight mooring lines and 45 ° &
60° angle configurations.
- The mooring line analysis conducted in this
study is the analysis of tension, offset, and
clereance between the mooring line and pipeline.
- Analyzes were performed without subsea buoys
and with subsea buoys.
5 RESULTS AND DISCUSSION
5.1 Structur Modeling
FSO modeling uses software by entering FSO
coordinates.
Table 1: FSO Data.
Parameter Unit
Value
Full load Ballast
LOA m 244.60 244.60
LPP m 233.00 233.00
Breadth m 42.20 42.20
Depth m 22.20 22.20
Dra
ft
m 15.50 7.00
KG m 13.71 10.08
Displacemen
t
Ton 12588.60 58833.87
Table 2: Shuttle tanker Data.
Paramete
r
Uni
t
Value
LOA m 240.50
LPP m 230.00
Breadth m 42.00
Depth m 21.20
Dra
ft
m 14.85
KG m 12.48
Displacemen
t
Ton 118643.87
Analysis on the Effect of Subsea Buoy to the Tension of Spread Mooring System
237
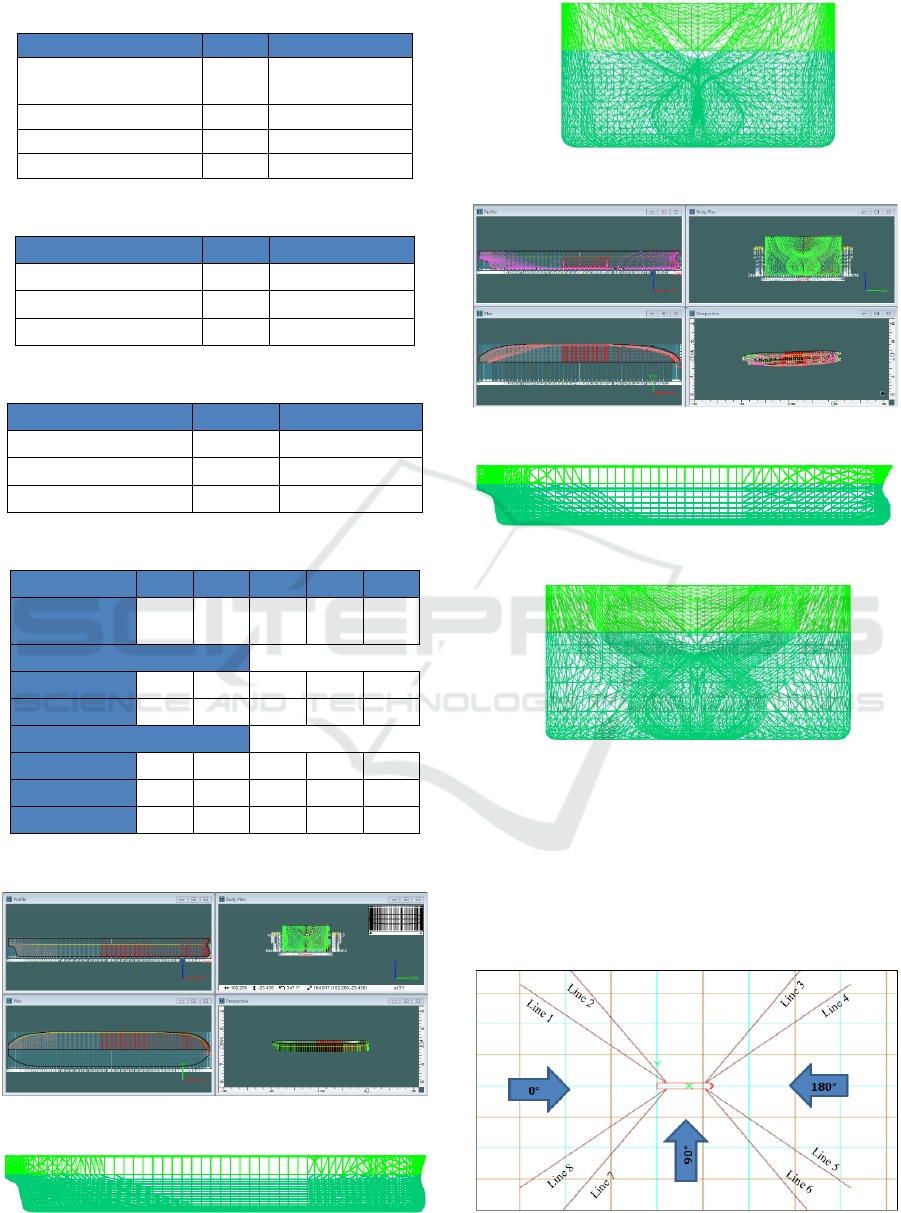
Table 3: Mooring Line Data.
Paramete
r
Uni
t
Value
T
y
pe -
Chain, R4
Studless
Len
g
th o
f
chain m 914
Size m
m
87 mm dia
MBL mT 783.35
Table 4: Mooring Hawser Data.
Paramete
r
Uni
t
Value
T
y
pe - Rope/N
y
lon
Size m
m
96 dia
MBL mT 154.076
Table 5: Subsea Buoy Data.
Paramete
r
Uni
t
Value
Wei
g
h
t
k
g
5600
Tin
gg
i m 4.6
Diamete
r
m 2.8
Table 6: Environment Data.
Direction NE E SE S SW
Wind Speed
(m/s)
18 11 10 13 13
Wave Data
Hs 4.4 2.0 1.8 2.0 2.0
Tp 9.9 8.6 8.5 8.6 8.6
Current Speed (m/s)
Surface 0.89 0.80 0.62 0.62 0.76
30 m 0.69 0.62 0.48 0.48 0.67
3 m 0.45 0.41 0.35 0.35 0.43
This is modelling of FSO & shuttle tanker.
Figure 1: Modeling FSO with Maxsurf.
Figure 2: Side view FSO with Moses.
Figure 3: Front view FSO with Moses.
Figure 4: Modeling shuttle tanker with Maxsurf.
Figure 5: Side view shuttle tanker with Moses.
Figure 6: Front view shuttle tanker with Moses.
Mooring systems were modeling by software and
modeled in 6 variations in two conditions, stand alone
and offloading. The Variations were mooring line
without subsea buoy, mooring line with one of subsea
buoy at a distance from the anchor 605 m, 557.5 m,
550 m, 522.5 m, and mooring line with two subsea
buoy at a distance from the anchor 605 m and 476.5m.
Figure 7: Stand alone conditions.
ISOCEEN 2019 - The 7th International Seminar on Ocean and Coastal Engineering, Environmental and Natural Disaster Management
238
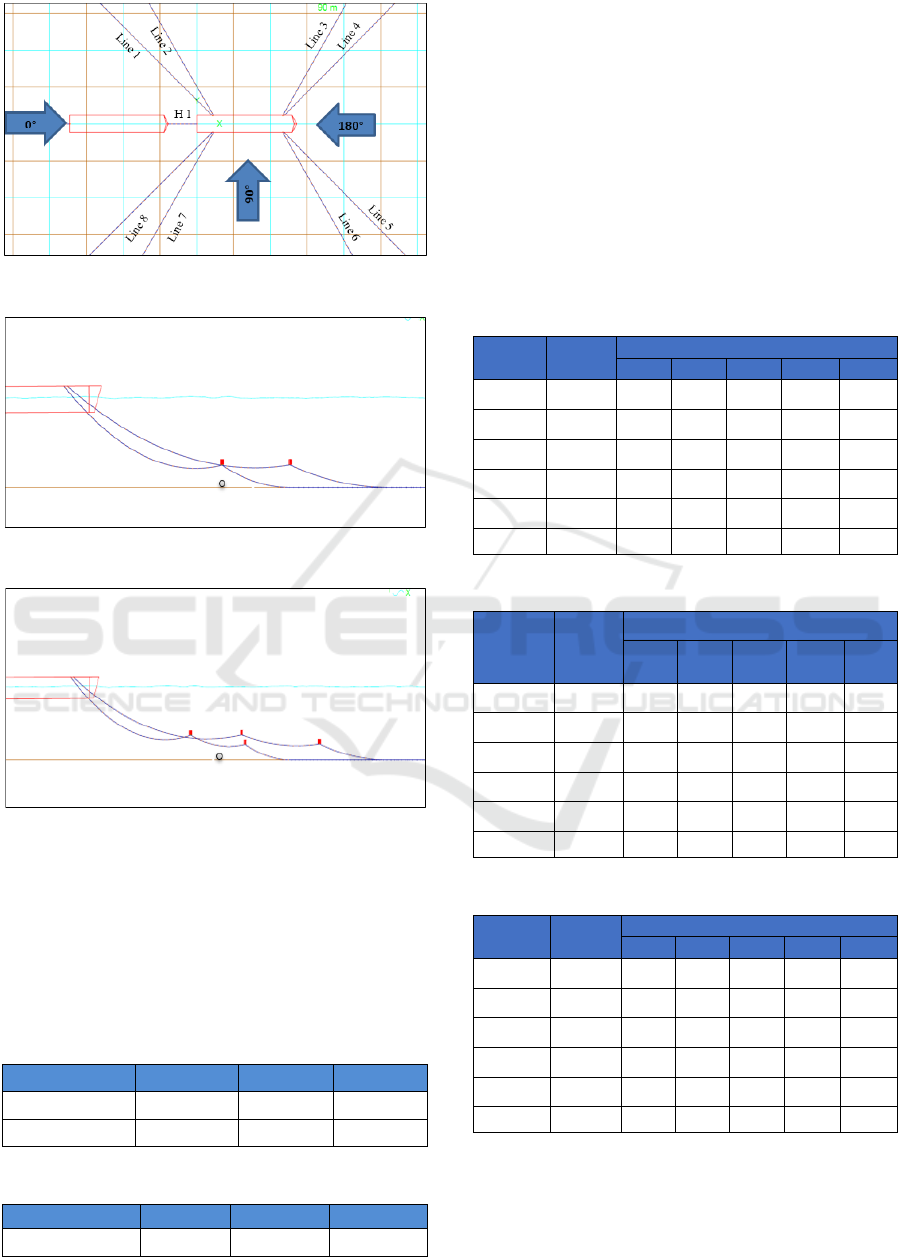
Figure 8: Offloading conditions.
Figure 9: Mooring Line with one Subsea Buoy.
Figure 10: Mooring Line with two Subsea Buoy.
5.2 Model Validation
The model was validated based on the ABS
(American Bureau of Shipping) MODU (Mobile
Offshore Drilling Unit) rules, the difference of
displacement modeling not exceed 2%.
Table 7: FSO Validation.
Loa
d
Data MOSES Validasi
F
ull Load 128588.6 128561 0.02%
Ballas
t
58796.11 57589.1 2.00%
Table 8: Shuttle Tanker Validation.
Loa
d
Data MOSES Validasi
Full Load 118644 118787 0.12%
5.3 Responses Amplitude Operator
Analysis
RAO (Response Amplitude Operator) analysis is
performed motion characteristics of FSO and shuttle
tanker. This analysis carried out when free floating
and moored condition in 6 degrees of freedom,
namely surge, sway, heave, roll, pitch and yaw. The
following is RAO of FSO and shuttle tanker during
full load and ballast conditions.
1. RAOs Free Floating Condition
Table 9: Max. RAO FSO Full Load Condition.
Motio
n
Unit
RAO Max.
0° 45° 90° 135° 180°
Surge m/m 0.97 0.69 0.00 0.69 0.97
Sway m/m 0.00 0.70 0.99 0.70 0.00
Heave m/m 1.00 1.00 1.45 1.00 1.00
Roll deg/m 0.01 1.60 2.21 1.59 0.01
Pitch deg/m 0.79 0.97 0.37 0.93 0.79
Yaw de
g
/
m
0.00 0.30 0.03 0.32 0.00
Table 10: Max. RAO FSO Ballast Condition.
Motion Unit
RAO Max.
0° 45° 90° 135°
180
°
Surge m/m 0.98 0.69 0.00 0.69 0.98
Sway m/m 0.00 0.70 0.99 0.70 0.00
Heave m/m 1.00 1.00 1.09 1.00 1.00
Roll deg/m 0.00 2.20 4.65 2.31 0.00
Pitch deg/m 0.73 0.78 0.12 0.77 0.73
Yaw de
g
/
m
0.00 0.32 0.04 0.33 0.00
Table 11: Max. RAO shuttle tanker Full Load Condition.
Motion Unit
RAO Max.
0° 45° 90° 135° 180°
Surge m/m 0.97 0.68 0.00 0.68 0.97
Sway m/m 0.00 0.70 0.99 0.70 0.00
Heave m/m 1.00 1.00 0.45 1.00 1.00
Roll deg/m 0.01 1.94 2.69 1.92 0.01
Pitch deg/m 0.85 1.01 0.36 0.88 0.88
Yaw de
g
/
m
0.00 0.31 0.05 0.32 0.00
5.4 Mooring Line Tension Analysis
Analysis of the mooring line tension was carried out
without subsea buoys and with subsea buoys in two
Analysis on the Effect of Subsea Buoy to the Tension of Spread Mooring System
239
conditions, namely stand alone conditions and
offloading conditions. Mooring line 6 has the largest
tension value compared to the mooring line 3, 4, 5
which has been added to the subsea buoy. So that a
comparative analysis of the position of the subsea
buoy is carried out on the mooring line 6.
1. Stand Alone Condition
For analysis of tension on the mooring line carried out
with conditions without subsea buoy, one subsea
buoy with four variations of position and two subsea
buoys in five of wave directions, namely, 0 °, 45 °, 90
°, 135 °, 180 °.
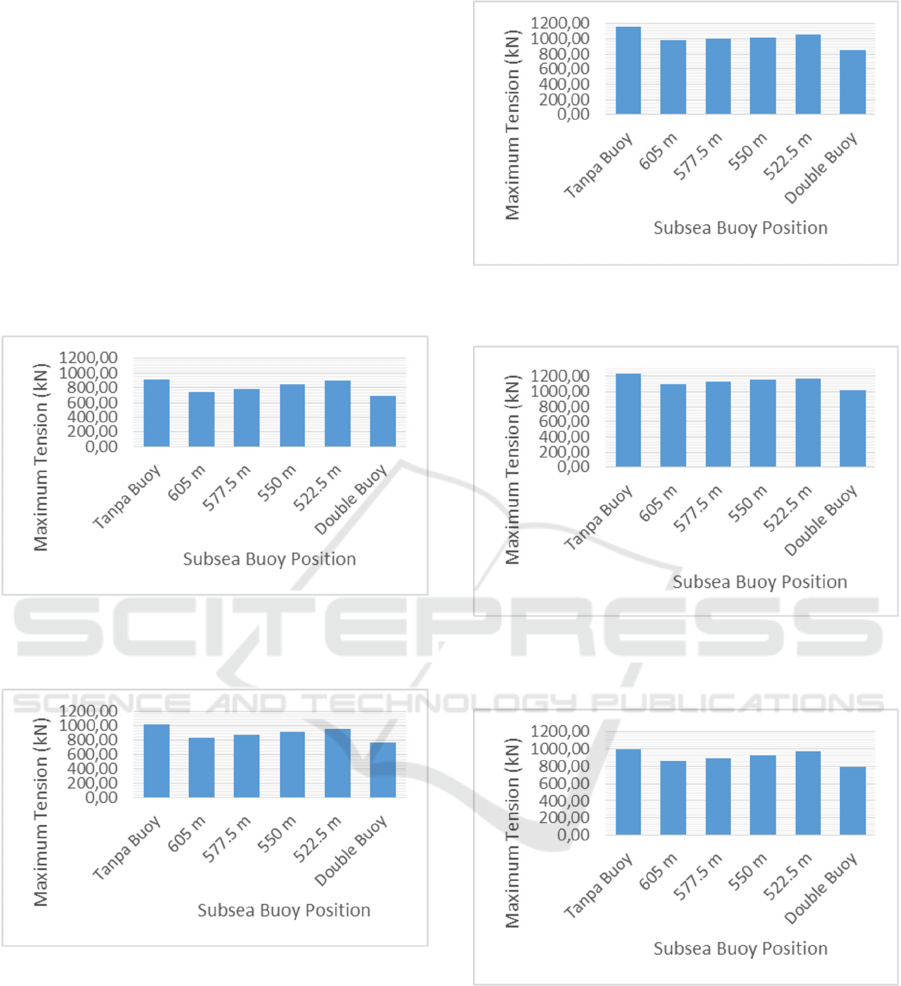
a. Wave Direction 0°
Figure 11: Max. Tension 0°.
b. Wave Direction 45°
Figure 12: Max. Tension 45°.
c. Wave Direction 90°
Figure 13: Max. Tension 90°.
d. Wave Direction 135°
Figure 14: Max. Tension 135°.
e. Wave Direction 180°
Figure 15: Max. Tension 180°.
From Figure 11 until Figure 15 indicates that the
largest mooring line tension on the mooring line
without subsea buoys. The mooring line with the
subsea buoy from the smallest to the largest is the
mooring line with two subsea buoys, the mooring line
with one subsea buoy with a distance of 605 m, 577.5
m, 550 m, 522.5 m from the anchor.
ISOCEEN 2019 - The 7th International Seminar on Ocean and Coastal Engineering, Environmental and Natural Disaster Management
240

2. Offloading Condition
For analysis of tension on the mooring line carried out
with conditions without subsea buoy, one subsea
buoy with four variations of position and two subsea
buoys in five of wave directions, namely, 0 °, 45 °, 90
°, 135 °, 180 °.
a. Wave Direction 0°
Figure 16: Max. Tension 0°.
b. Wave Direction 45°
Figure 17: Max. Tension 45°.
c. Wave Direction 90°
Figure 18: Max. Tension 90°.
d. Wave Direction 135°
Figure 19: Max. Tension 135°.
e. Wave Direction 180°
Figure 20: Max. Tension 180°.
From Figure 16 until Figure 20 indicates that the
largest mooring line tension on the mooring line
without subsea buoys. The mooring line with the
subsea buoy from the smallest to the largest is the
mooring line with two subsea buoys, the mooring line
with one subsea buoy with a distance of 605 m, 577.5
m, 550 m, 522.5 m from the anchor.
5.5 Offset Analysis
Stand alone and offloading condition are used in the
analysis.
1. Stand Alone Condition.
This analysis was carried out with 5 load directions
include 0
o
, 45
o
, 90
o
, 135
o
and 180
o
.
Analysis on the Effect of Subsea Buoy to the Tension of Spread Mooring System
241
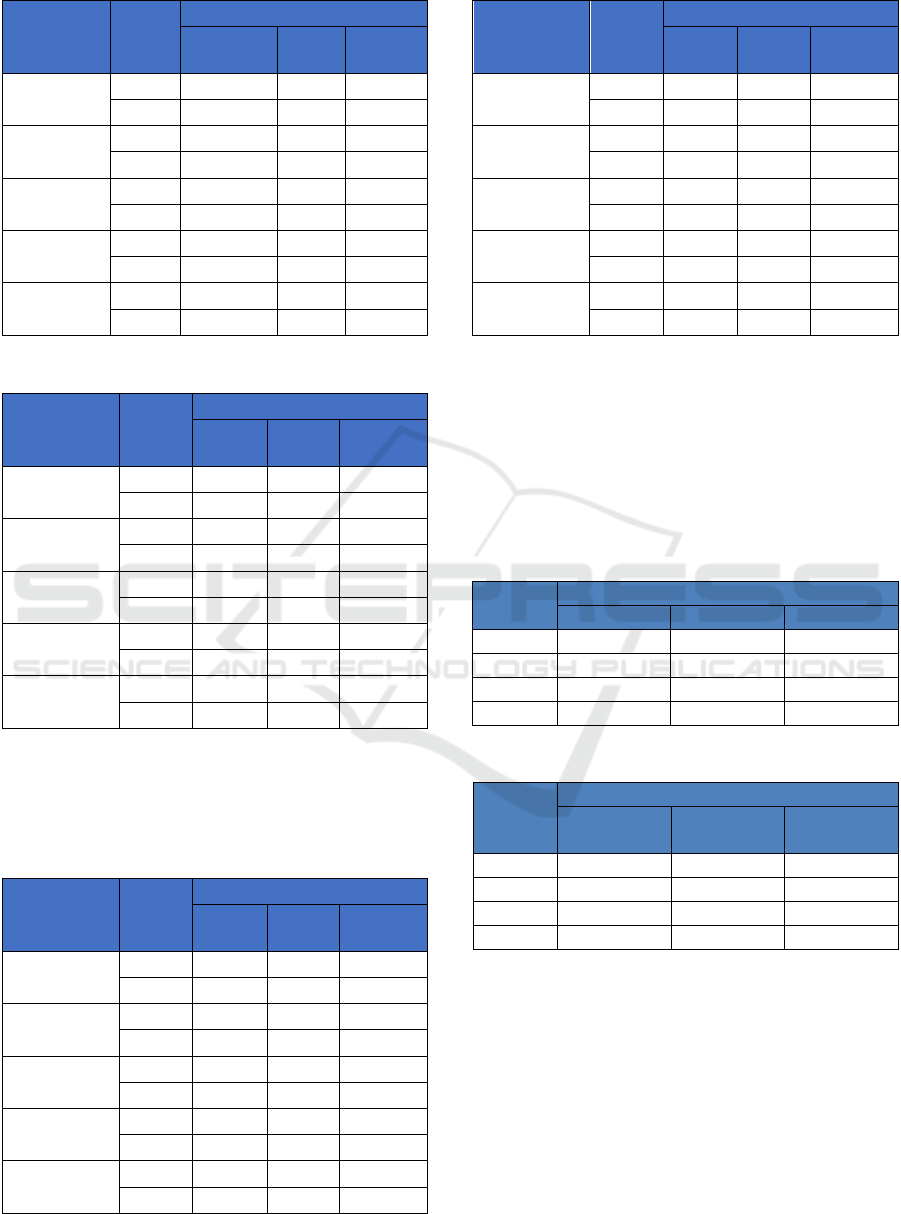
Table 12: Max. Offset Stand Alone Condition.
Wave
Directions
Offset
x & y
Maximum Offset (m)
Tanpa
Buo
y
605
m
577.5
m
0°
x 0.80 1.67 1.05
y 0.00 0.00 0.00
45°
x 0.34 2.28 1.67
y 2.84 3.49 3.49
90°
x 0.41 2.34 1.72
y 2.69 2.90 2.82
135°
x 0.31 2.06 1.47
y 1.49 1.57 1.30
180°
x 1.43 2.89 2.24
y 0.14 0.08 0.08
Table 13: Max. Offset Stand Alone Condition.
Wave
Directions
Offset
x & y
Maximum Offset (m)
Tanpa
Buo
y
605 m 577.5 m
0°
x 0.50 0.47 2.53
y 0.00 0.00 0.00
45°
x 1.02 0.57 3.54
y 3.46 3.44 3.68
90°
x 1.09 0.46 3.53
y 2.70 2.62 3.45
135°
x 0.86 0.50 3.08
y 1.28 1.28 2.13
180°
x 1.58 0.90 4.54
y 0.08 0.08 0.08
2. Offloading Condition.
This analysis was carried out with 5 load directions
include 0
o
, 45
o
, 90
o
, 135
o
and 180
o
.
Table 14: Max. Offset Offloading condition.
Wave
Directions
Offset
x & y
Maximum Offset (m)
Tanpa
Buo
y
605 m 577.5 m
0°
x 0.81 1.67 1.56
y 0.00 0.00 0.00
45°
x 1.75 3.90 3.19
y 5.19 5.92 5.62
90°
x 2.41 4.78 3.92
y 6.72 7.75 7.28
135°
x 3.10 5.94 4.90
y 7.97 8.91 8.77
180°
x 1.44 3.55 2.67
y 0.14 0.00 0.00
Table 15: Max. Offset Offloading condition.
Wave
Directions
Offset
x & y
Maximum Offset (m)
Tanpa
Buo
y
605 m 577.5 m
0°
x 1.37 0.66 1.66
y 0.00 0.00 0.30
45°
x 2.42 1.61 5.18
y 5.34 5.15 6.40
90°
x 3.14 2.34 6.38
y 6.84 6.52 8.40
135°
x 4.02 3.19 7.87
y 8.26 7.85 9.11
180°
x 1.84 1.13 4.89
y 0.00 0.00 0.00
5.6 Clearance between Mooring Line
and Pipeline
Stand alone and offloading condition are used in the
analysis.
1. Stand Alone Condition.
Table 16: Clearance between Mooring Line and Pipeline.
Line
Clearance (m)
No Buo
y
605
m
577.5
m
3 0.00 6.51 10.10
4 0.19 17.42 14.41
5 0.19 17.42 14.41
6 0.00 6.51 10.10
Table 17: Clearance between Mooring Line and Pipeline.
Line
Clearance (m)
550 m 522.5 m
Double
Buo
y
3 12.45 4.77 25.73
4 10.84 3.20 29.90
5 10.84 3.20 29.90
6 12.45 4.77 25.73
From Table 16 and 17 shows that there is no
clashing between mooring line and pipeline after the
addition of the subsea buoy, but the clearance that
matches the criteria of DNV OS E301 which is in the
variation of one subsea buoy with a distance of 577.5
m from the anchor, one subsea buoy with a distance
of 577.5 m from anchor, and on the condition of two
subsea buoys. The biggest clearance occurred in the
condition of two subsea buoys, namely on lines 3 and
6 valued at 25.73 m and on lines 4 and 5 worth 29.9m.
ISOCEEN 2019 - The 7th International Seminar on Ocean and Coastal Engineering, Environmental and Natural Disaster Management
242

2. Offloading Condition.
Table 18: Clearance between Mooring Line and Pipeline.
Line
Clearance (m)
No Buo
y
605
m
577.5
m
3 0.00 6.13 10.04
4 0.19 15.92 12.74
5 0.19 15.92 12.74
6 0.00 6.13 10.04
Table 19: Clearance between Mooring Line and Pipeline.
Line
Clearance (m)
550 m 522.5 m
Double
Buo
y
3 10.58 5.22 24.88
4 10.11 4.39 27.55
5 10.11 4.39 27.55
6 10.58 5.22 24.88
From Table 18 and 19 shows that there is no
clashing between the mooring line and the pipe after
the addition of the subsea buoy, but the clearance that
matches the criteria of DNV OS E301 which is in the
variation of one subsea buoy with a distance of 577.5
m from the anchor, one subsea buoy at 577.5 m from
anchor, and on the condition of two subsea buoys.
The biggest clearance occurred in the condition of
two subsea buoys, namely on lines 3 and 6 valued at
24.88 m and on lines 4 and 5 worth 27.55 m.
6 CONCLUSIONS
The findings of the study could be revealed as
follows:
Mooring line without subsea buoys at stand alone
conditions and in all loading directions has the
maximum tension. The largest tension from the
direction of 45° on line seven with a value of
1503.09 kN. The offloading condition, the
mooring line without the addition of subsea buoys
in all loading directions also has the maximum
tension value. In the direction of 135° on line
seven has the largest tension with a value of
1743.05 kN. For all tension it matches the criteria
of API RP 2SK, which is a safety factor less than
1.67.
From the research it is known that the addition of
the subsea buoy reduces the tension on the
mooring line. On the mooring line with one
subsea buoy the further distance from the anchor
has smaller tension. At the mooring line with two
subsea buoys with a distance of 605 m and 467.5
m has the minimum value. This condition occurs
in all of wave directions when stand alone and
offloading.
From the research it is known that the addition of
the subsea buoy can affect the offset of the FSO.
In stand alone and offloading conditions, the
highest offset is on the mooring line with two
subsea buoys and a mooring line with one subsea
buoy with a distance of 605 m from the anchor.
The value of all offsets that occur is in accordance
with the API RP 2P criteria.
From the research it is known that the addition of
subsea buoys can avoid clashing between
mooring line and pipeline. However, for the
clearance between mooring line and pipeline that
matches the criteria of DNV OS E301 which is in
the variation of one subsea buoy with a distance
of 577.5 m from the anchor, one subsea buoy with
a distance of 550 m from the anchor, and in the
conditions of two subsea buoys. The biggest
clearance occurred on the mooring line with two
subsea buoys.
REFERENCES
ABS. 2018. Rules for Building and Classing Mobile
Offshore Drilling Units. USA. American Bureau of
Shipping.
API RP 2SK 3th edition. 2005. Recommended Practice for
Design and Analysis of Station keeping Systems for
Floating Structures. Washington DC.
Bhattacharyya. R., 1978. Dynamics of Marine Vehicles.
New York: John Wiley & Sons Inc.
Chakrabarti, S. K., 1987. Hydrodinamics of Offshore
Structure. Boston, USA: Computational Mechanics
Publication Southampton.
Djatmiko, E.B., 2012. Perilaku dan Operabilitas Bangunan
Laut Di Atas Gelombang Acak. Surabaya: ITS Press.
DNV OS E301. 2004. Position Mooring. Det Norske
Veritas. Norway.
Faltinsen, O.M., 1990. Sea Loads on Ships and Offshore
Structures. Cambridge, UK: Cambridge University
Press.
Fitria, Favi Ainin. 2018. Studi Pengaruh Penambahan
Clump Buoy Pada System Mooring Platform PLTAL
Laut Dalam, Tugas Akhir. Surabaya: Institut Teknologi
Sepuluh Nopember.
Howell dkk., 2006. Spread Moored or Turet Moored
FPSO’s for Deepwater Field Developments. Offshore
West Africa Ok
Ji, C.Y., Yuan, Z.M., Chen, M.L., 2011. “Study on a new
mooring system integrating catenary with taut
mooring”. China Ocean Eng. 25 (3), 427–440.
Analysis on the Effect of Subsea Buoy to the Tension of Spread Mooring System
243

Mavrakos, S.A., 1997. “Dynamic Behavior of Deep Water
Mooring Lines With Submerged Buoys”. Elsevier, 64,
pp.819-35.
OCIMF. 1997. Mooring Equipment Guidilines. London:
WITHERBY & CO. LTD.
Sahlan, Arifin, Wibowo, 2012. Kajian Numerik Respon
Gerakan Kapal FPSO/FSO Saat Ditambat (Moored
FPSO/FSO). UPT Balai Pengkajian dan Penelitian
Hidrodinamika-BPPT.
Suseprasetyo, N., 2013. Analisis Pengaruh Variasi
Displasemen Dan Posisi Submerged Buoy Terhadap
Kinerja Sistem Tambat Single Point Mooring FPSO
“BROTOJOYO”, Tugas Akhir. Surabaya: Jurusan
Teknik Kelautan ITS.
Sundaravadivelu, R., and Varaprasad K. S. S. R. CH., 1991.
“Design of Single Point Sub-surface Deep Sea
Moorings”. Ocean Engineering, Vol. 18, pp.397-404.
Yuan, Z.M, Incecik A., Ji, C.Y., 2014. Numerical Study on
a Hybrid Mooring System with Clump Weights and
Buoys.
ISOCEEN 2019 - The 7th International Seminar on Ocean and Coastal Engineering, Environmental and Natural Disaster Management
244
