
Forecasting the Amount of Foreign Tourists of Asean Country Origin
in North Sumatera using Monte Carlo Simulation
Suyanto and Andri Saputra Sk
Department of Mathematics, Faculty of Mathematics and Natural Sciences,
Universitas Sumatera Utara, Medan, Indonesia
Keywords: Forecasting, Monte Carlo Simulation.
Abstract: Forecasting is an important tool in effective and efficient planning to predict future events. The
characteristic of forecasting about future values of a variable for planning or decision making of a situation
to estimate future values. Monte Carlo simulation is a simulation model that includes a random series and
sampling with a probability distribution that can be known and determined, so this simulation can be used.
In this study, data was taken from the amount of foreign tourists from ASEAN member countries who
visited North Sumatra from 2009 to 2018 which indicated a trend data pattern over time. Then, data
processed and analyzed using Monte Carlo Simulation to determine the forecast results for 5 years after that.
As a result the amount of foreign tourists who visited North Sumatra from Malaysia, the Philippines,
Singapore and Thailand as a whole have increased respectively by 2.61%, 1.14%, 3.10% and 5.66%. The
number of foreign tourists who visited North Sumatra origin Brunei, Vietnam and Myanmar as a whole
decreased respectively by 3.56%, 4.90% and 28.11%.
1 INTRODUCTION
Tourism is an important economic sector in
Indonesia. Tourism placed is third in terms of state
foreign exchange earnings after oil and commodities
natural gas and palm oil in 2009. One indicator of
development tourism can be seen from the growth of
foreign tourists, apart from domestic tourist visits
and growth revenue from the trade and hotel sector.
Indonesia is a member of the ASEAN
(Association of Southeast Asian Nations) with
Malaysia, Thailand, Singapore, the Philippines,
Laos, Brunei Darussalam, Vietnam, Cambodia and
Myanmar where ASEAN leaders agreed to form a
single market in the Southeast Asia region at the end
of 2015 termed the ASEAN Economic Community
(AEC). Foreign tourists in this region much needed
to increase foreign exchange reserves in the region
of ASEAN member countries.
One of the provinces frequented by foreign
tourists, especially the country ASEAN is North
Sumatra. In the data of foreign tourists who came to
North Sumatra in
2016 were 233,668 people who experienced
increase 1.91% from 2015 and in 2017 were 270,792
people experienced increase of 15.96% from 2016
([BPS] Badan Pusat Statistik Provinsi Sumatera
Utara, 2019).
In the framework of the development of
international tourism, steps need to be taken steps to
increase the flow of foreign tourists by increasing
marketing needed to be able to predict the flow of
foreign tourists in North Sumatra, with information
quantitative and qualitative information about
tourism in the past in order to improve tourism
promotion in North Sumatra. One forecasting
technique used is by using Monte Carlo Simulation.
Monte Carlo simulation using data which is already
there to estimate important things in the future such
as sales, requests, and so on as an overview of past
data. From the existing model created a model so
that a random number can be generated based on a
model made.
Tüzüntürk et al. in his research on forecasting
drinking water demand using Monte Carlo
simulation, produces estimated values that are close
to the actual data, so that the Monte Carlo
Simulation can predict requests drinking water in the
next 12 months (Tüzüntürk et al., 2015). Research
by Alrabadi and Aljarayesh regarding the
comparison of simple moving average (SMA)
forecasting methods, exponential moving average
340
Suyanto, . and Sk, A.
Forecasting the Amount of Foreign Tourists of Asean Country Origin in North Sumatera using Monte Car lo Simulation.
DOI: 10.5220/0010182200002775
In Proceedings of the 1st International MIPAnet Conference on Science and Mathematics (IMC-SciMath 2019), pages 340-345
ISBN: 978-989-758-556-2
Copyright
c
2022 by SCITEPRESS – Science and Technology Publications, Lda. All rights reser ved

(EMA) and Monte Carlo simulation in forecasting
stocks market returns on Amman shares which
results in the estimated value with Monte Carlo
Simulation is closer to the actual data so that the
Monte Carlo simulation can predict stock market
return (Alrabadi et al., 2015). Research by Sugiharto
regarding the application of Simulation in
forecasting demand and management Top Paint
brand paint produces an estimated volume of each
order and interval the time of arrival of the order for
the next 12 months (Sugiharto, 2007).
2 LITERATURE REVIEW
2.1 Forecasting
Forecasting is an important tool in effective and
efficient planning for predicting future events
(Makridakis et al., 1999). Forecasting has the
following objectives (Heizer & Render, 2011):
1. To review company policies that are in force
today and in the past and see the extent of
influence in the future
2. Forecasting is needed because of the time lag or
delay between when a policyoccurs company
policy is determined by the time of
implementation
3. Forecasting is the basis for preparing a business
in a company so that can increase the
effectiveness of a business plan.
Scientifically, the forecasting method can be
classified in two groups there are qualitative
methods and quantitative methods. Quantitative
methods can be divided into two, there are:
1. Forecasting methods based on the use of the
analysis of the relationship patterns between
variables to be estimated with time variables
(Time Series). The methods included in this type
are Smoothing Methods, Methods Box Jenkins,
Trend Projection Method with Regression and
Monte Carlo Method.
2. Forecasting methods based on the use of the
analysis of the relationship patterns between
variables to be estimated with no time variables
(correlation method or cause and effect).
Forecasting methods included in this type are
Regression and Correlation Methods,
Econometric Methods and Input Output
Methods.
2.2 Monte Carlo Simulation
Simulation is one way to solve various problems in
real life that is full of uncertainty by not using or
using models or certain methods and more emphasis
on using computers to get the solution (Kakiay,
2004). One method that plays a role in computer
simulations is the Monte Carlo method. The Monte
Carlo method is a withdrawal involves a series of
random numbers namely variations of U(0,1), which
are used for solving stochastic or deterministic
problems where the role of time is not requires
substantive rules, so the Monte Carlo method is
generally static rather than dynamic (Law & Kelton,
2000).
The Monte Carlo method illustrates the
possibility of using sample data already exists and
can be known or estimated distribution. With words
it is different if the simulation model includes a
random series and sampling with a probability
distribution that can be known and determined, then
this simulation can be used (Kakiay, 2004). In
operation, Monte Carlo involves a direct election
randomly repeating each other’s output so that a
solution is obtained certain approach. The increasing
number of experiments carried out then the error rate
for the results obtained will be smaller
(Rubiensten,
1981).
2.3 Random Number Generator
In the Monte Carlo technique, artificial data is
generated through random number generator and
cumulative distribution. Random numbers generated
actually not really random, so it is called a random
number generator means that what can actually be
produced is not random and makes has criteria that
must be met, namely:
1. Uniform distribution and does not correlate
between numbers
2. Generating quickly, storage is not large
3. Can be produced repeatedly
4. A large period, because random numbers may be
generated repeatedly.
The random number is symbolized by U, its
value from 0 to 1 which is expressed in U(0,1). The
method for random numbers is usually the Linear
Congruential Generator (LCG), and Multiplicative
Congruential Generator (MCG). LCG and MCG
have formula:
𝑋
𝑎𝑍
𝑐
𝑚𝑜𝑑 𝑚
(1)
𝑋
𝑎𝑍
𝑚𝑜𝑑 𝑚 (2)
with:
𝑋
random number 𝑛-series
Forecasting the Amount of Foreign Tourists of Asean Country Origin in North Sumatera using Monte Carlo Simulation
341

𝑋
previous random number
𝑎 multiplier factor
𝑐 constant number
𝑚 modulo number
From the LCG and MCG formulas a random
number (U
i
) is desired (for 𝑖 1,2,3, …) in [0,1],
then the formula is (Law & Kelton, 2000):
𝑈
𝑍
𝑚
(3)
2.4 Generate Random Variate
In generating random numbers through a computer is
very dependent on function or distribution of the
data being investigated. Then from the distribution
functions this can be found or derived random
variate from the distribution function
(Kakiay, 2004).
On this study discussed random distribution of
normal distribution. Algorithm generate random
numbers from the normal distribution, i.e.
1. Generate U
1
and U
2
, where U
1
and U
2
are
independent random numbers U(0,1)
2. Calculate X
1
and X
2
, using the formula:
𝑋
2ln 𝑈
cos2𝜋 𝑈
(4)
𝑋
2ln 𝑈
cos2𝜋 𝑈
(5)
3. Placed X
0
= µ + X
i
σ
4. Then X
0
is random data from N(µ,σ
2
).
3 METHODOLOGY
The data used in this study are secondary data,
namely the amount foreign tourists who came to
North Sumatra from ASEAN member countries in
2007-2018 obtained from the Central Statistics
Agency (BPS) of North Sumatra. The calculation is
done by numerical calculations and simulated using
Monte Carlo simulation so that optimal forecasting
results are obtained. As for who carried out with
data that has been collected are as follows:
a Test the normality of data on the number of
foreign tourists from member countries ASEAN
with Liliefors Normal Test.
b Determine the parameters that are useful for
generating random numbers in terms of normal
contribution.
c Perform a simulation of 10 times.
d Test the average similarity of the two related
variables to find out whether there is a difference
between the simulation data and the actual data.
e Perform simulations to determine the results of
forecasting.
f Formulating conclusions.
4 RESULTS AND DISCUSSION
4.1 Data Collection
The data to be analyzed in this study is the number
of foreign tourists from the country ASEAN
members who visited North Sumatra in 2007-2018
were obtained from the Central Statistics Agency of
North Sumatra Province. The data can be seen in
Table 1 follows.
Table 1: Data of Foreign Tourists from ASEAN member
countries in North Sumatra in 2007-2018.
No Year
Brunei
Darussala
m
Malaysia Philippines
1 2007 133 81.347 899
2 2008 79 84.387 991
3 2009 94 102.685 986
4 2010 79 109.320 970
5 2011 103 132.037 942
6 2012 140 143.644 1.041
7 2013 248 148.465 1.341
8 2014 124 152.389 1.279
9 2015 218 129.203 1.551
10 2016 91 115.007 1.094
11 2017 172 128.761 1.541
12 2018 221 139.878 1.612
Total 1.702 1.467.033 14.247
No Yea
r
Singapore Thailan
d
Vietna
m
1 2007 7.622 988 147
2 2008 9.946 1.460 124
3 2009 10.361 1.677 102
4 2010 11.187 2.686 167
5 2011 11.592 2.180 250
6 2012 13.579 2.757 237
7 2013 18.276 3.906 337
8 2014 18.066 4.844 369
9 2015 12.516 3.087 405
10 2016 14.322 3.027 311
11 2017 17.312 3.688 1.356
12 2018 18.620 3.605 752
Total 1.702 163.399 33.905
No Yea
r
M
y
anma
r
1 2007 59
2 2008 120
3 2009 149
4 2010 1.014
5 2011 127
6 2012 157
7 2013 158
8 2014 182
9 2015 202
10 2016 147
11 2017 259
12 2018 317
Total 2.891
IMC-SciMath 2019 - The International MIPAnet Conference on Science and Mathematics (IMC-SciMath)
342

Source: Central Statistics Agency of North Sumatra
Province
4.2 Solution using Monte Carlo
Simulation
In doing simulations, the first thing to do is
determine the distribution that become a benchmark
in generating the number of foreign tourists in step
next. Data in the simulation generated depend on the
distribution known for such distribution. The
distribution used in this study is a Normal
distribution. After the distribution is known, the
simulation is carried out as much as you want. In
this study the simulation was carried out 10 times so
that the simulation results are expected to represent
actual data. This simulation works from each
country, as follows:
4.2.1 Data Simulation of Tourists from
Brunei Darussalam, Malaysia,
Philippines and Singapore
In the data of tourists from Brunei Darussalam, the
average (µ) and standard deviation (σ) are 141,8333
and 59,4869. For tourists from Malaysia, the values
µ and σ are 122.252,7500 and 23.859,4190. For
tourists from the Philippines, the values µ and σ are
1.187,2500 dan 264,4817. For tourists from the
Singapore, the values µ and σ are 13.616,5833 and
3.766,2653. First the values of U
1
and U
2
are raised
using the RAND function in Microsoft Excel. Then
taken as example to determine the value of X using
the formula (4), i.e:
𝑋
2ln 𝑈
cos
2𝜋𝑈
2 ln 0,6327
cos
2𝜋 0,2634
0,0803.
Then the random number obtained is converted to
the amount of arrivals foreign tourists:
𝑋
𝜇𝜎𝑋
141,8333 59,4869
0,0803
137,0545
137.
So on up to 10 times the simulation. Table 2
explains the summary simulation data on the number
of foreign tourists from Brunei Darussalam,
Malaysia, the Philippines, and Singapore.
Table 2: Simulation of foreign tourists from Brunei
Darussalam, Malaysia, Philippines and Singapure.
No Simulation
Brunei
Darussala
m
Malaysia
1 I 1.924 1.455.333
2 II 1.410 1.521.579
3 III 1.645 1.465.864
4 IV 1.285 1.537.491
5 V 1.761 1.457.245
6 VI 1.993 1.691.073
7 VII 1.826 1.405.846
8 VIII 1.747 1.501.732
9 IX 1.806 1.311.412
10 X 1.655 1.540.604
Avera
g
e 1.705 1.488.818
No Simulation Phili
pp
ines Sin
g
a
p
ore
1 I 16.247 158.282
2 II 13.019 165.122
3 III 15.062 156.121
4 IV 12.655 170.356
5 V 14.998 199.850
6 VI 13.942 164.224
7 VII 15.142 143.236
8 VIII 15.283 164.490
9 IX 14.205 178.277
10 X 12.560 157.354
Avera
g
e 14.311 165.731
In Table 2, the average of Brunei Darussalam
tourists from the simulation results is equal to 1.705
people, compared to the actual data which is 1.702
people. The average of Malaysian tourists from the
simulation result is equal to 1.488.818 people,
compared to actual data that is equal to 1.467.033
people. The average of Filipinos tourists from the
simulation results is equal to 14.311 people
compared to the actual data which is 14.247 person.
Meanwhile, the average of Singapore tourists from
the simulation results is equal to 165.731 people
compared to the actual data that is equal to 163.399
people.
4.2.2 Data Simulation of Tourists from
Thailand, Vietnam and Myanmar
In the data of tourists from Thailand, the average (µ)
and standar deviation (σ) is 2.825,4167 and
1.116,1298. In the data of tourists from Vietnam, the
values µ and σ are 379,7500 and 353,9571. In the
data of tourists from Myanmar, the values µ and σ
are 240,9167 and 252,3772. Generate U
1
and U
2
values using the RAND function on Microsoft
Excel. Then taken as an example to determine the
value of X with using the formula (4), i.e:
Forecasting the Amount of Foreign Tourists of Asean Country Origin in North Sumatera using Monte Carlo Simulation
343
𝑋
2ln 𝑈
cos
2𝜋𝑈
2 ln 0,9118
cos
2𝜋 0,2187
0,0840.
Then the random number obtained is converted to
the amount of arrivals foreign tourists:
𝑋
𝜇𝜎𝑋
2.825,4167
1.116,1298 0,0840
2.919,1861
2.919.
So on up to 10 times the simulation. Table 3
describes the summary simulation data on the
number of tourists from Thailand, Vietnam and
Myanmar.
Table 3: Simulation of foreign tourists from Thailand,
Vietnam dan Myanmar.
No Simulation
Thailand Vietnam Myanmar
1 I
35.431 4.765 4.149
2 II
37.089 4.958 3.397
3 III
29.186 5.657 3.214
4 IV
26.867 5.045 3.844
5 V
32.284 4.861 5.652
6 VI
32.192 5.595 4.051
7 VII
34.966 4.202 3.173
8 VIII
33.858 4.965 3.375
9 IX
38.344 5.317 2.867
10 X
35.940 4.275 3.569
Average
1.705
33.615 4.964
In Table 3, the average of Thai tourists from
simulation results is 33.615 people compared to the
actual data of 33.905 person. The average of
Vietnamese tourists from simulation results is 4.964
people compared to the actual data of 4,557 people.
Meanwhile, the average of Myanmar tourists from
simulation results is 3.729 people compared to the
actual data of 2.891 people.
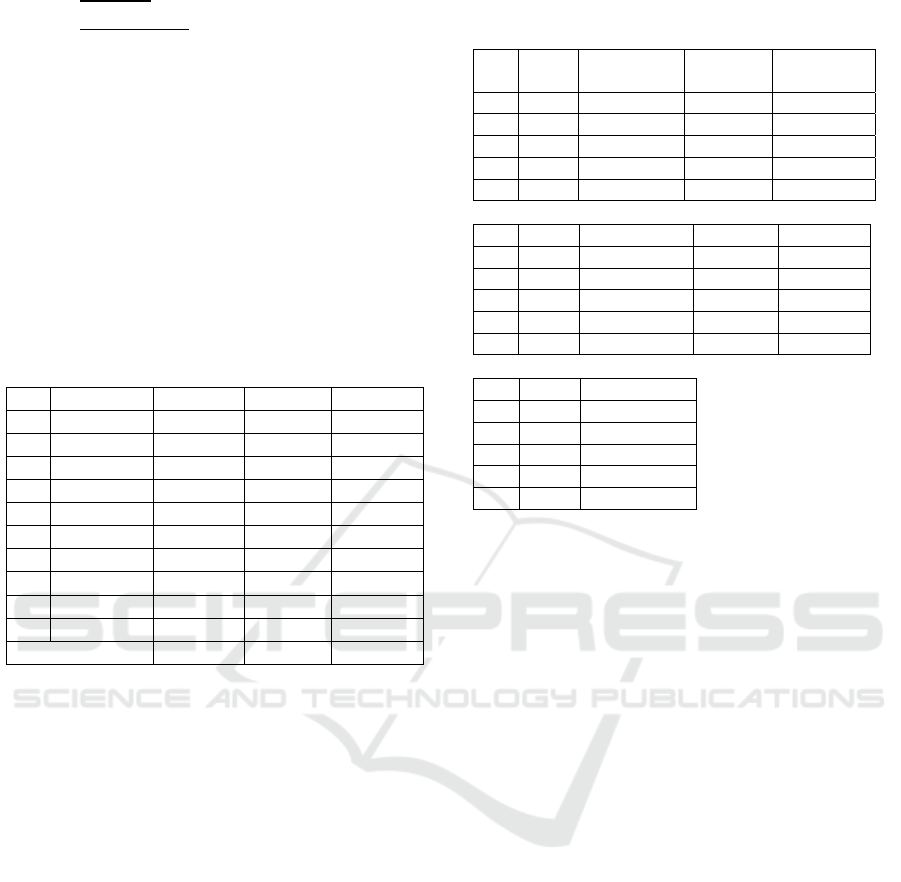
4.3 Forecasting Results
The data simulated again to make predictions about
the number of foreign tourists. The data has reached
optimal results because it has been simulated by
using use existing parameters. The following
forecasting results will be displayed Monte Carlo
Simulation of 2019-2023 in Table 4.
Table 4: Forecasting Results the tourists using Monte
Carlo Simulation.
No Year
Brunei
Darussala
m
Malaysia Philippines
1 2019 163 121.087 1.269
2 2020 180 123.351 1.287
3 2021 195 124.615 1.294
4 2022 171 125.752 1.304
5 2023 200 134.688 1.333
No Yea
r
Sin
g
a
p
ore Thailan
d
Vietna
m
1 2019 14.068 3.303 300
2 2020 14.614 3.375 435
3 2021 15.044 3.524 323
4 2022 15.112 3.558 528
5 2023 15.898 3.800 512
No Yea
r
M
y
anma
r
1 2019 338
2 2020 340
3 2021 374
4 2022 406
5 2023 416
In Table 4, the amount of foreign tourists who
visited North Sumatra from Malaysia, Philippines,
Singapore and Thailand as a whole have increased
respectively 2,61%, 1,14%, 3,10%, and 5,66%
compared to the number of foreign tourists who
visited from Brunei Darussalam, Vietnam and
Myanmar which as a whole have decreased
respectively 3,56%, 4,90% dan 28,11%.
5 CONCLUSION
5.1 Conclusion
Based on the analysis and discussion that has been
done, conclusions can be taken that the forecast
results of the number of foreign tourists coming to
North Sumatra from ASEAN member countries will
increase in the next five years. The amount of
foreign tourists visiting North Sumatra from
Malaysia, Philippines, Singapore and Thailand as a
whole have increased by 2,61%, 1,14%, 3,10%, and
5,66%. The amount of foreign tourists who visited
North Sumatra from Brunei Darussalam, Vietnam
and Myanmar as a whole have decreased by 3,56%,
4,90% and 28,11%. Therefore the number of foreign
tourists from Thailand is predicted to be more
significant compared to other countries.
IMC-SciMath 2019 - The International MIPAnet Conference on Science and Mathematics (IMC-SciMath)
344

5.2 Next Research
For next research of the same type it is
recommended to do the simulations with other
variables that influence the amount of tourists as
well, and simulate more than 10 times iteration so
that the results obtained can be more accurate.
REFERENCES
[BPS] Badan Pusat Statistik Provinsi Sumatera Utara.
(2019). Statistik Wisatawan Mancanegara Sumatera
Utara.
Alrabadi, Hanna, D. W., & Aljarayesh, N. I. A. (2015).
Forecasting Stock Market Returns Via Monte Carlo
Simulation: The Case of Amman Stock Exchange.
Jordan Journal of Business Administration, 11(3).
Heizer, J., & Render, B. (2011). Operations Management.
Pearson Education Inc.
Kakiay, T. J. (2004). Pengantar Sistem Simulasi. Andi.
Law, A. M., & Kelton, W. D. (2000). Simulation
Modeling and Analysis. McGraw-Hill.
Makridakis, S. G., Wheelwright, S. C., & McGee, V. E.
(1999). Metode dan aplikasi peramalan. Erlangga.
Rubiensten, R. Y. (1981). Simulation and The Monte
Carlo Method. John Wiley and Sons.
Sugiharto, B. (2007). Aplikasi Simulasi untuk Peramalan
Permintaan dan Pengeloaan Persediaan yang bersifat
Probabilistik. Industrial and Systems Engineering
Assessment Journal, 8(2).
Tüzüntürk, S., Sezen, K., & Şenaras, A. E. (2015).
Forecasting Water Demand by using Monte Carlo
Simulation. Akademik BakiŞ Dergisi.
Forecasting the Amount of Foreign Tourists of Asean Country Origin in North Sumatera using Monte Carlo Simulation
345
