
Qualitative and Quantitative Results of Enterprise Security
Visualization Requirements Analysis through Surveying
Ferda Özdemir Sönmez and Banu Günel
CyDeS Cyber Defence and Security Laboratory, METU, Ankara, Turkey
Department of Information Systems, Informatics Institute, Middle East Technical University, Ankara, Turkey
Keywords: Security Visualization, Survey, Requirements, Enterprise Security.
Abstract: In order to find gaps or missing points in any domain, examination of the literature work is necessary and
provides a good amount of information. Doing a requirement analysis on top of this literature search
incorporating the domain experts is a convenient way to find out ideas to fill out the detected gaps. The
security visualization domain has been popular for the latest twenty years. There have been many designs.
However, our literature analyses work resulted with the conclusion that the majority of the earlier security
visualization work focuses a known set of use-cases, and these are trying to be validated using these small
sets of vulnerabilities and some commonly known threats through a few case studies or experimental results.
In this work, a security visualization requirement analysis survey with 30 information security experts is done.
The paper presents the qualitative and quantitative results of this survey.
1 INTRODUCTION
Security visualization domain emerged at the
beginning of the 21st century. Data has been the most
authoritative element of the majority of the existing
design decisions. Visualization designs might be due
to seeking solutions to daily analytical problems.
However, in order to make significant improvements,
long-term researches are needed. While there are
several security visualization designs, the number of
use-cases and the case studies used in the academic
studies are not as diverse as it should be.
Prior to this survey study, besides investigating
existing survey papers (Staheli, et al., 2014) (Shiravi,
et al., 2012), an extended literature work for the
security visualization domain has been done by the
authors. During this literature search in order to
understand existing situation, different aspects of the
designs are examined including design issues, display
types, use-cases, common interactivity ways and
common validation methods for the domain. This
literature study is published as a book chapter
(Özdemir Sönmez and Günel, 2018). Due to the
comprehensive nature and length of this literature
study, it is not directly included to this paper.
However, all the findings and learnings directly
influenced the design and evaluation phases of the
influenced the design and evaluation phases of the
survey.
Existing security visualization solutions
(Özdemir Sönmez and Günel, 2018) are mostly
focused on network security. Monitoring of intrusion
detection systems, firewall logs, and configuration
visualization are the most commonly implemented
use-cases. Enterprise security visualization (Liao, et
al., 2008) has been the subject of a small number of
works so far. Host-server topology and host-server
interaction visualizations form the most popular
enterprise-focused security visualization subjects. To
the authors’ best knowledge there is no published
earlier effort to gather user-centric requirements for
enterprise security visualization solution which is
meant a visualization solution that is an infrastructure
which embraces most of the enterprise security
visualization requirements for the authors. Hence, in
order to provide user-centric designs for the
enterprise security visualization solutions, a security
visualization requirements survey was carried out.
The survey’s aim was to understand the existing
situation regarding the use of security visualization
solutions in the enterprises and to find out the
requirements for new designs. It also aimed to find
the answers related to the visual representation of
different use cases in the security visualization
domain. Thus, the survey consisted of questions
Sönmez, F. and Günel, B.
Qualitative and Quantitative Results of Enterprise Security Visualization Requirements Analysis through Surveying.
DOI: 10.5220/0007255401750182
In Proceedings of the 14th International Joint Conference on Computer Vision, Imaging and Computer Graphics Theory and Applications (VISIGRAPP 2019), pages 175-182
ISBN: 978-989-758-354-4
Copyright
c
2019 by SCITEPRESS – Science and Technology Publications, Lda. All rights reserved
175

related to the existing security analysis methods
which encapsulate security visualization tools and
techniques, the data sources which are collected
and/or, stored and/or, analysed as part of the security
analyses methods, the infrastructure elements of the
enterprise including software, hardware and system
components, the security analyses methods which
may be extended by including security visualization
methods and the user practices and expertise.
The survey contains both closed and open-ended
questions. The participants are people with enterprise
security expertise, from the academia and the
industry. The qualitative and quantitative results
coming from these users’ responses are the subject of
this paper.
The rest of this paper is structured as follows.
Section 2 and Section 3 presents the need for the
security visualization requirement analysis and the
methodology, respectively. Section 4 provides the
results and Section 5 concludes the paper.
2 THE NEED FOR SECURITY
VISUALIZATION
REQUIREMENT ANALYSIS
There have been numerous security visualization
studies so far. Visualization designs are mainly
affected by the data format, data type, size, and the
use-cases. Generally, they are based on commonly
known vulnerabilities and the threats. Available
technologies also play an essential role in the design
decisions. Although the number of existing studies is
quite high, the number of user-centric designs is low.
Limited coverage of user requirements is due to the
restricted scope of client needs and planning
perception. This issue is explained well in Frincke et
al. (2009). In general, the researchers of the domain
use conferences (Vis Sec, 2018) and domain-specific
forum websites (Sec Viz, 2018) to share thoughts and
information related to existing work, new design
features, and future requirements. While these
information sharing mechanisms contribute to the
improvement of the domain, more effort is required.
Novel security visualization designs are scarce, as
it requires composing a new way of data
representation which is useful for the security
domain. It requires knowledge of both security and
visualization systems. If the target is to provide an
enterprise security solution, the knowledge of
enterprise security is also required.
Providing a successful design requires being more
user-centric. There are studies which includes
gathering user feedbacks in this domain. Some of the
earlier security visualization tools are based on user
requirements. The authors claim that although there
are user-centric designs requirement analysis for a
visualization solution that embraces most of the
enterprise security visualization requirements to form
an infrastructure was not made. In majority of
security visualization studies, users are incorporated
as part of user experiments, and case studies for
evaluation, and validation purposes. Although
including users in these later steps is valuable for
getting feedback to be used in subsequent studies, it
is too late for users to influence the system
requirements and design. Therefore, the authors
decided to incorporate potential users in the
requirements development phase.
Fry (2007) described the creation of the
visualization process to be in seven steps including
acquirement, parsing, filtering, mining,
representation, refining, and interaction. The authors
think that it will be more reasonable to give such an
intense effort to design visualizations which
correspond to real user security visualization
requirements.
Lacking enough examination of security
visualization requirements and not injecting this
information into the security visualization studies
results in:
• Rework for similar vulnerabilities or threats,
which could have been examined together using the
same data sources or same technologies, which
further requires more effort to be spent on data
collection and preparation, technology installation,
education, and dissemination;
• Redesign of tools or multiple designs doing
similar tasks, which could have been used to cover
different situations, which causes late response to
newly detected vulnerabilities and exposures besides
wasting time and money;
• Design of tools which exhibit limited
information or have only a few benefits, which further
leads to the necessity of using multiple tools for
visualization of security data for sufficient coverage.
3 METHODOLOGY
Qualitative methods are commonly used for empirical
studies of software engineering. Questionnaires
including both qualitative and quantitative elements
may be used to discover trends, generalizations, and
new focus points. Collecting user requirements
through qualitative and quantitative questionnaires
might result in new and well-grounded security vi-
IVAPP 2019 - 10th International Conference on Information Visualization Theory and Applications
176

sualization hypotheses.
Security visualization requirements of the
enterprises can be determined by
• asking questions related to the existing
software, system and hardware infrastructure of the
enterprises,
• reviewing commonly used security analysis
techniques,
• determining the current level of security
visualization usage in the enterprises,
• finding out the most popular security use cases
for different types of enterprises,
• investigating the data sets which are collected
and stored by enterprises, which would be taken as
security visualization data sources,
• investigating the critical data attributes for the
security analysers,
• comparing various display types in terms of
usability, and
• determining the staff awareness level on the
infrastructure security data sources and their analysis
techniques.
3.1 Survey
A detailed survey was prepared which consisted of
questions related to the existing security analysis
methods which encapsulate security visualization
tools and techniques; data sources which are collected
and/or, stored and/or, analysed as part of security
analyses methods; the infrastructure of the enterprise
including software, hardware and system
components; security analyses methods which may
be extended by including security visualization
methods; and the user practices and expertise.
The survey contained 25 multiple-choice, seven
grading scales and 14 open-ended questions.
Participants were asked to complete the survey
online.
Sections of the enterprise security visualization
requirements survey are listed below.
A. Participant Information Section
B. Pre-survey Evaluation Quiz Section
C. Security Visualization Use Cases
D. Security Visualization Data
E. Security Visualization Data Size
F. Security Analysis Techniques
G. Visualization Design and Display Properties
H. Technical Infrastructure
I. Organization and Domain Information
J. User Information
The question set and the raw data of the
requirement analysis survey study are published on
GitHub under the name “Security Visualization
Requirement Analysis Raw Results” for the
interested audience who may want to refer to the
components of the requirement analysis work and
have more information related to the attendees'
expertise levels and background. In this paper, only
the results of this study is explained in detail.
Forming the survey and examination of the
survey results is a part of a long-term process which
started with the examination of the literature and
would end up with the determination of requirements,
the design of tools, and methods, and validation of the
proposed solutions. The scope of this paper is limited
to the surveying phase.
3.2 Participants
The number of participants for the survey was 30. All
had expertise in the security domain. Their primary
sectors are shown in Figure 1. The security-related
certificates that the attendees held were 6 CISSP
certificates, 1 ISO27001:2013 lead auditor certificate,
2 CEH certificates, 1 ISO27005 Risk Manager
certificate, 2 Security+ certificates, 2 CISM
certificates, 1 TUBITAK SOME certificate, 1 Cisco
Security certificate, 1 Cybersecurity certificate, 1
CCNA SECURITY certificate, 1 PARTIAL CISA
certificate.
Figure 1: Primary sectors of the attendees.
4 ANALYSIS AND RESULTS
The results extracted from the survey are grouped into
three categories: quantitative results at a glance,
further quantitative results and the qualitative results.
In this section, together with the results, the facts and
the topics that need to be examined in more detail
which were determined by analysing these results are
also presented in the form of explanatory notes.
4.1 Quantitative Results at a Glance
When the existing studies are further examined, it is
seen that the majority of the existing security
visualization designs depend on a single type of data
Qualitative and Quantitative Results of Enterprise Security Visualization Requirements Analysis through Surveying
177
source, such as the network traffic data. Some of the
visualization designs filter data sources according to
the protocol types. TCP protocol data is the most
commonly visualized data.
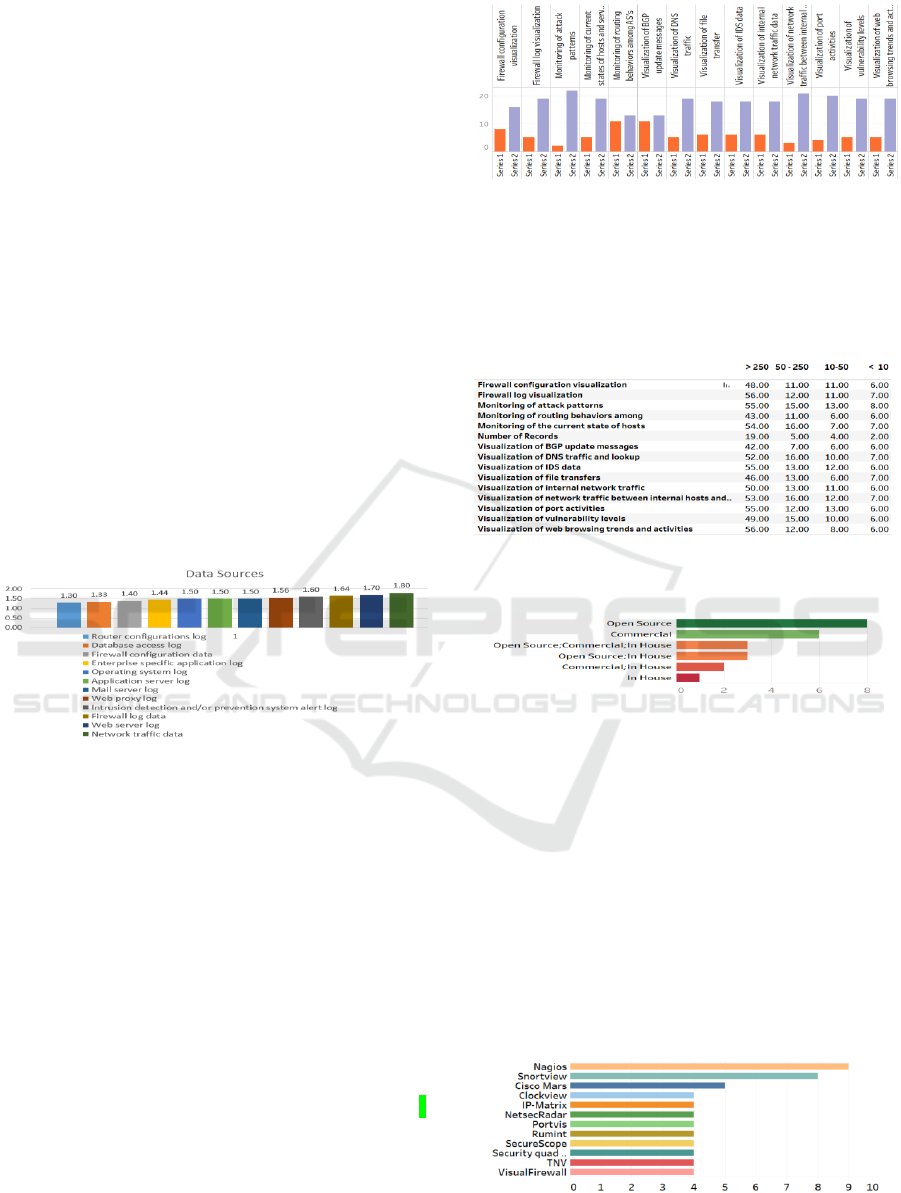
One of the main objectives of the requirement
analysis survey was to determine what kind of
security-related data is collected in the organizations,
which of them are stored for future examination and
which of them are examined as part of security
analysis methods. As a result of the questionnaire, 12
data sources were identified. In order to quantify and
plot the importance of the data sources, the answers
which state “not collected at all” were assigned the
score of zero, the answers which state “collected but
not analysed” were assigned the score one, and the
answers which indicate “analysed as part of security
analyses” were assigned the score two. The mean
scores were then calculated for each data source. The
resulting importance values for the data sources are
shown in order in Figure 2. As expected, the network
traffic data has the most noteworthy significance as a
security perception information source. Router
configuration log, on the other hand, has the least
significance. For all the other questions, five-level
Figure 2: Importance of data sources for the organizations.
Likert items were used with scales from one to five.
Considering that the security of shared resources
is more critical than the security of non-shared ones,
policies of sharing data, services, and infrastructure
have been examined in the requirements analysis. It
was found that enterprises routinely share such
resources with customers (17 participants), suppliers
(13 participants), partners (20 participants) and
stakeholders (17 participants).
Another finding of the security visualization
requirement survey was the list of popular security
visualization use cases, which are most applicable
and beneficial to the organizations. During the
literature review, the use-cases are grouped, and use-
cases which are most associated with enterprise usage
are detected. The survey included these type of use-
cases Figure 3 shows the summary information
related to the adaptation of security visualization use
cases in the organizations. Series 1 corresponds to the
sum of answers either which has no idea of the use
Figure 3:Security visualization use-cases.
case or think that it can not be applicable to their
organization. Series 2 corresponds to the sum of the
answers where it is stated that this use case has not
been adopted yet, but would be moderately beneficial
or very beneficial for their organization and that this
Figure 4: Evaluation of security visualization use-cases
according to the enterprise size (number of employees).
Figure 5: Origin of existing security visualization solutions
in the enterprises.
use case has already been adopted in their
organizations. It can be observed that the familiarity
with and usefulness of the use cases do not vary much
among 14 use-cases. However, enterprise users seem
to be more familiar to enterprise data and asset related
use-cases but less familiar to use cases related to core
Internet protocols such as BGP and DNS.
The evaluation of use cases according to the
number of employees, which gives an indication of
the enterprise size, is also presented in Figure 4. It can
be observed that the familiarity with and usefulness
of all of the use-cases increase as the number of em-
Figure 6: Most popular security visualization solutions in
the enterprises.
IVAPP 2019 - 10th International Conference on Information Visualization Theory and Applications
178
ployees (size of the enterprise) increases.
The evaluation of use cases according to the
primary sector of the enterprise has also been made
and it was observed that the familiarity with and
usefulness of the use-cases vary based on the primary
sector of the participant. The education sector has the
highest results, possibly due to increased awareness
as a result of the graduate education. The numeric
results were not included due to space limitations.
The distribution of security visualization
solutions used in the enterprises based on their origin
as commercial, in-house or opensource, is shown in
Figure 5. It can be seen that open source security
visualization systems are more preferable among the
attendees.
The most popular security visualization solutions
in the enterprises are shown in Figure 6. The most
popular security visualization studies are Nagios
(Josephsen, 2007), Snortview (Koike and Ohno,
2004), and CiscoMars (Halleen and Kellogg, 2007).
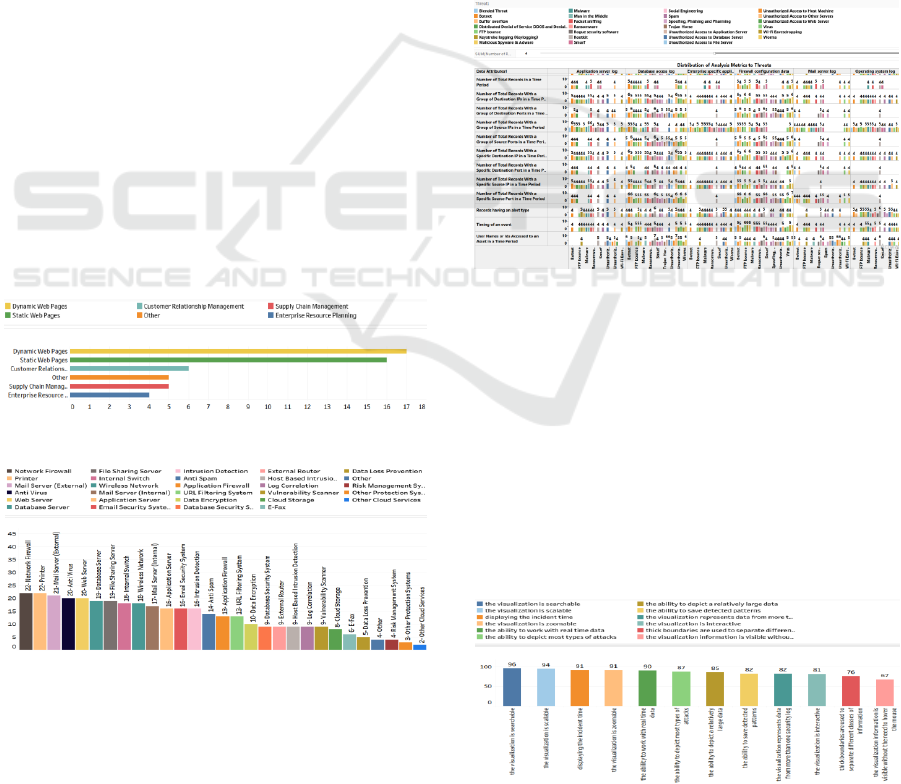
During the requirement analysis survey, mostly
used enterprise software systems, infrastructure
components, and security systems were also
questioned aiming to discover new security
visualization areas for the enterprises. Figure 7 shows
the usage of “Static Web Pages”, “Dynamic Web
Application”, “Enterprise Resource Planning (ERP)”,
“SCM”, “CRM” and “Other” systems in the
organizations. It can be observed that most used
software systems are static and dynamic web
applications.
Figure 7: Commonly used enterprise software solutions.
Figure 8: Hardware, networking and system components
that are part of the infrastructures.
The use of different enterprise IT system
components can also be considered as the subject of
a security visualization study. The use of “File
Sharing Server”, “Web Server”, “Mail Server
(Internal)”, “Mail Server (External)”, “Application
Server”, “Database Server”, “Cloud Storage”, “Other
Cloud Services”, “External Router”, “Internal Switch
or Router”, “Wireless Network”, Printer”, “E-Fax”,
and “Other” systems along with security protection
systems has been questioned during the security
requirements analysis survey. The most popular
systems are listed in Figure 8. It can be seen that
printers, external mail servers and web servers are the
most commonly existing components in enterprise
infrastructures.
In the survey, in order to find new ideas to
improve the existing threat analyses methods, the
participants were asked to define analyses, mapping
threats to security data sources and data attributes. As
a result, 19128 tuples (threat, data source, data
attribute) were identified. A portion of these
association results is shown in Figure 9
Figure 9: Associations of threats to data sources and data
attributes.
Rootkit, botnet, and unauthorized access to other
servers were the threats that were mostly associated to
data sources and data attributes. Social engineering.
unauthorized access to host machine and trojan horse
threats were the least associated. The “Number of a
Specific Type of Error”, and the “Number of Total
Records with a Group of Source IPs in a Time Period”
were the data which were mostly associated to the
threats. The “Number of Total Records in a Time
Period” was the least associated data.
Figure 10: Security visualization design issues.
Qualitative and Quantitative Results of Enterprise Security Visualization Requirements Analysis through Surveying
179
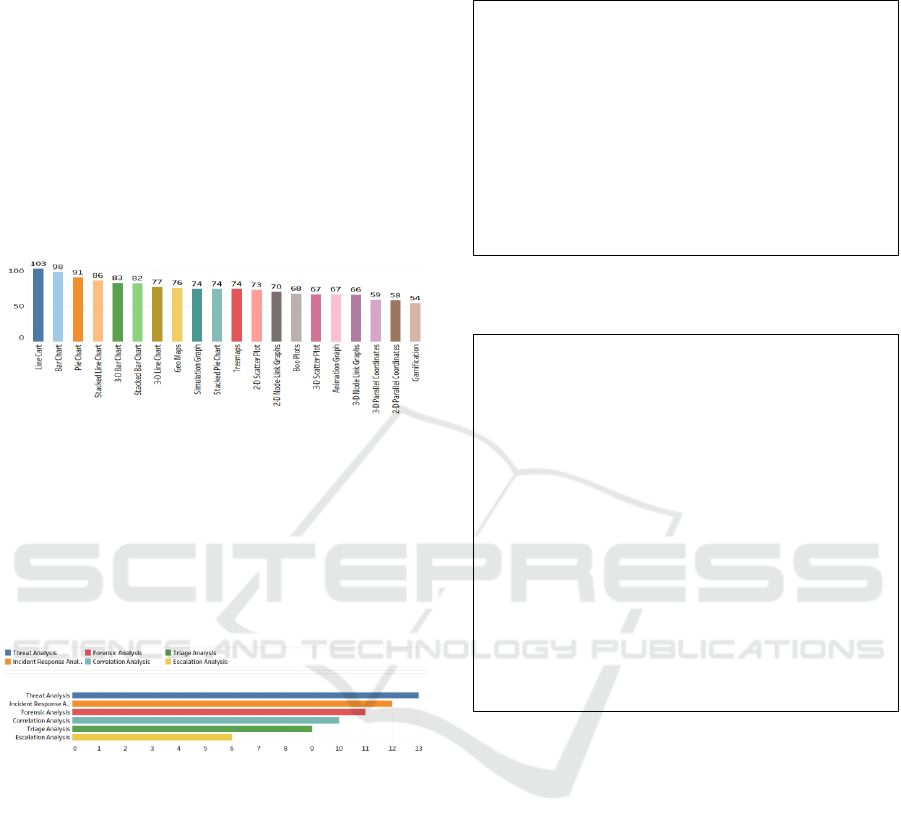
In order to contribute to the development of new
designs, the users were also asked about the
importance of design issues such as scalability,
interactivity, searchability, and being zoomable, and
the usability of display types such as simple charts
line charts, bar charts or complex charts with
animation. The results obtained from these questions
are shown in Figure 10 and Figure 11, respectively.
They do not allow making a sharp distinction between
the importance of design properties. However, simple
display types, such as line charts and bar charts are
found more understandable by the users than complex
ones.
Figure 11: Popular display types.
Finally, the users were asked about their current
security practices. Figure 12 shows the usage of
correlation, escalation, forensic, incident response,
threat, and triage type of analyses. While results do
not allow making a sharp distinction between various
security analyses types, the escalation analysis seems
to be the least favourite one.
Figure 12: Popular security analyses.
4.2 Further Quantitative Results
One of the most widely used instrument to mine
association rules is Apriori (Agarwal and Srikant,
1994). As explained in the previous section, the
participants were asked to detail their software
systems, security systems, and other infrastructure
elements. In order to find sets of software systems,
security systems, and other infrastructure elements
that are commonly used in the organizations’ of the
participants, Weka Apriori algorithm was used (Hall,
et al., 2009). The results for software systems, and
security systems are shown in Table 1, and Table 2
respectively.
The sets formed by association mining might be
useful while making technical decisions and
providing various licensing options embracing sets of
Table 1: Apriori rule generation for enterprise software
systems.
Best rules found:
1.ERP, Static Web Pages
2.ERP, Dynamic Web Application
3.Dynamic Web Application, ERP, Static Web Pages
4.Static Web Pages, ERP, Dynamic Web Application
5.ERP, Static Web Pages, Dynamic Web Application
6. Dynamic Web Application, SCM, Static Web Pages
7.Static Web Pages, SCM, Dynamic Web Application
8.ERP, CRM, Static Web Pages
9. ERP, SCM, Static Web Pages
10. ERP, CRM, Dynamic Web Application
Table 2: Apriori rule generation for enterprise security
systems.
Best rules found:
1.Intrusion Detection and/or Prevention System,
Network Level Firewalls
2.Email Security System, Network Level Firewalls,
3.Email Security System, Anti Virus, Network Level
Firewalls
4.URL Filtering System, Network Level Firewalls
5.Anti Spam, Anti Virus
6.Intrusion Detection and/or Prevention System, Anti
Virus, Network Level Firewalls
7.Intrusion Detection and/or Prevention System, Email
Security System, Network Level Firewalls
8.URL Filtering System, Anti Virus, Network Level
Firewalls
9.Network Level Firewalls, Anti Spam, Anti Virus
10.Anti Virus, Network Level Firewalls
various infrastructure items/software
systems/security systems. Associations of threats to
data sources and association of threats to the data
attributes were also clustered using the k-means
clustering algorithm. Limited space does not allow to
present the clustering results and to further comment
on Apriori rule generation and the clustering results.
These examinations are presented as samples so that
interested audience may attempt to make similar
analyses on the shared raw data.
4.3 Qualitative Results
In the survey, the users were asked questions about
their information levels on security-related log files.
A few users were not very familiar with their log file
types. In general, the participants were not very
knowledgeable about their log file sizes. Only one
user managed to enter numerical values for daily
records generated in firewall log file, IDS alert file,
IVAPP 2019 - 10th International Conference on Information Visualization Theory and Applications
180

application server access log file, application server
error log file, web server access log file, web server
error log file and mail server log file. Therefore, it can
be said that the participants are not very
knowledgeable about security log files.
There were some free format questions to collect
strategies for different situations and new use cases
which are applicable for the organizations. These
strategies and suggestions are listed in Table 3.
As a result, it can be said that the participants in
general, propose solutions which are not directly
related to the use-case asked, but general purpose
solutions. The majority of the logical solutions that
were offered by the participants are not novel. The
strategies and proposed relevant metrics are better to
be saved in a knowledge base structure.
Table 3: Strategies and suggestions.
Strategies to reduce the size of logs
-Archive in cloud and delete logs periodically
-Check some features from other systems to filter
important features
-Use logs for specific traffic only
-Filter useless entries and use compression
-Use moar logs
-Use security analytics
Strategies/methods to differentiate normal behavior of
web browsing from abnormal behavior
-Protecting the system under a firewall
-Mod security implementation
-Using next-generation firewalls
-Exploring user agent strings passed by web browsers
which may indicate known bad behavior, valid but
forbidden by policy behavior or a covert channel
-Investigating the malware command and controls via
purported web browsing
-Using baselining
-Detection of anomalies by analyzing proxy logs, using
darktrace etc.
-Use of commercial and other whitelists
-Checking for sudden changes
-Visualization of firewall traffic log
-Use of IPS features of the firewall
-Monitoring the amount of abnormal web requests
Strategies/methods to differentiate normal activities of
file sharing from suspicious activities
-Using next-generation firewalls
-Combining file sharing data with human resources
data (ex. data of a person who is likely to be fired)
-In-house tools
-Sudden changes in volume/#connections
-Block shadow IP’s in the firewall
-Check correlation of DLP logs
-Use of Wireshark
-Check times of download/upload processes
Strategies to differentiate normal behavior of social
media usage from suspicious behavior using data
-Controlling social media tools with the bare eye
-Using social media sentiment analysis tools may be
helpful.
-Block in L7 firewall
Any suggestions for security visualization usage
scenarios which is beneficial for the organizations
-“Log analysis and correlation applications would be
good.”
-“To me, the most interesting scenarios are when
visualizations enable humans to find important things
that machines can't, but then can enable the human to
properly parameterize the insight so that the machine
can do the heavy lifting in the future.”
-“Authentication success and failures.”
-“Do not restrict yourself to 2D visualization.”
-“MS Baseline Analyzer for network analyses.” -
“Visualization of individual client's network traffic
such as visualization of the clients DNS requests, file
downloads via e-mail or web browsing, usage of
unexpected ports could be correlated and visualized. In
the visualization programs common information (IP
addresses etc.) in different types of network traffic
could be mapped in order to help drawing
conclusions.t-SNE and Multidimensional scaling. Data
visualizations such as in Kibana can be useful. With
Kibana one can also do fraud analysis. Device
information like OS, layer 3 protocol details and -
Tracert info belonging to attackers canbe visualized.
Use of Maltrail.”
-“Use of Spice Works tool for IT helpdesk and system
performance monitoring purposes.
5 CONCLUSIONS
In an effort to determine user-based enterprise
security visualization requirements, a survey was set
up. Although the number of attendees was not very
high, the experience and information level of the
participants was at the desired level. This shows that
we were able to find the targeted audience.
From the survey, several results were obtained
pointing out various observations related to the
security visualization domain. Some of these are
expected. For example, web applications are the
mostly used software applications; network traffic
data was selected as the most important data source
for security analysis; and users are more prone to
select simple display types, such as bar charts and line
charts as compared to complex display types. There
are also some unexpected results. For example,
interactivity is claimed to be less important compared
to some other design properties. There are some
Qualitative and Quantitative Results of Enterprise Security Visualization Requirements Analysis through Surveying
181

results which point out new visualization subjects. For
example, more visualization studies are required
focusing on printer usages and mail servers.
Further quantitative analysis results provide
information which requires to be deeply examined to
improve existing security visualization designs and to
form novel design. For example, sets of infrastructure
items which may be examined in groups in security
visualization solutions, the clusters of threats and
associated data sources and data attributes may point to
new metrics for particular threats.
Majority of the results helped in distinguishing
items among alternatives, or helped to understand new
issues. A few of the results did not allow sharp
distinctions among alternatives. During the scaling,
multiplier sets(coefficients) (one to five) were used as
mentioned before. Using a different multiplier set
would end up with having more clear boundaries.
The authors think that doing this kind of a survey
may result in user-centric solutions with better designs.
In this way, the designers can find out novel ideas
which may contribute to creating holistic approaches
for the enterprise security. These results should be
reflected to the security visualization domain by novel
designs which are not restricted to known data sources
and known use-cases.
This survey may also be suitable for carrying out
internally in the organizations. It may also be adapted
for non-technical people. This effort may lead to other
interesting results, such as the identification of new
security sources, and new visualization use-cases.
One major limitation of this study was the limited
number of attendees. They were all informed about the
content of the survey prior to their participation,
especially on the type of the questions, and the length
of the survey. Some participants hesitated to contribute
due to the length of the survey and some others
hesitated due to the specific subject of the survey. A
shorter survey involving similar concepts can be
prepared as a future work, and new ways of survey
distribution can be considered in order to get the
maximum benefit. Another limitation is, as explained
before although literature learnings influenced the
survey design, the length limitations did not allow to
explicitly demonstrate all these influences. Using an
ordered coefficient set corresponding to Likert scale
results during the scaling of some data elements may
be considered as some type of limitation, cause another
set may slightly effect the results as mentioned earlier.
This paper has shown that users are not familiar
with the majority of security visualization solutions or
have problems in using existing security visualization
solutions. More effort should be given to designing
user-focused security visualization designs.
The results were recorded to be converted to
functional and non-functional requirements as a future
work. The requirements should also be elicited
accordingly and should be combined with the latest
technological instruments to form an enterprise
security visualization system design as a further future
work.
REFERENCES
Agarwal, Rakesh, and Ramakrishnan Srikant. 1994. “Fast
algorithms for mining association rules.” Proceedings
of the 20th Very Large Data Bases Conference.
Burlington, MA, USA: Morgan Kaufmann. 487-499.
Frincke, Deborah A., Carrie E. Gates, and John R. Goodall.
2009. “Message from the Workshop Chairs.” 6th
International Workshop on Visualization for Cyber
Security. Atlanta, GA, USA: IEEE. iv-v.
Agarwal, R. and Srikant, R., 1994. Fast algorithms for
mining association rules. Burlington, MA, USA,
Morgan Kaufmann, pp. 487-499.
Frincke, D. A., Gates, C. E. and Goodall, J. R., 2009.
Message from the Workshop Chairs. Atlanta, GA,
USA, IEEE, pp. iv-v.
Fry, B., 2007. Visualizing data: exploring and explaining
data with the Processing environment. s.l.:O'Reilly
Media, Inc.
Halleen, G. and Kellogg, G., 2007. Security monitoring
with cisco security mars. Boston, MA,USA: Pearson
Education.
Hall, M. et al., 2009. The WEKA data mining software: an
update. 11(1), pp. 10-18.
Josephsen, D., 2007. Building a monitoring infrastructure
with Nagios. Upper Saddle River, NJ, USA: Prentice
Hall.
Koike, H. and Ohno, K., 2004. SnortView: visualization
system of snort logs.. s.l., ACM, pp. 143-147.
Liao, Q., Blaich, A., Striegel, A. and Thain, D., 2008.
ENAVis: Enterprise Network Activities Visualization.
s.l., s.n., pp. 59-74.
Özdemir Sönmez, F. and Günel, B., 2018. Security
Visualization Extended Review Issues, Classifications,
Validation Methods, Trends, Extensions. In: Security
and Privacy Management, Techniques, and Protocols.
s.l.:IGI Global, pp. 152-197.
Sec Viz, 2018. SecViz Security Visualization. [Online]
Available at: https://secviz.org/[Accessed 8 9 2018].
Shiravi, H., Shiravi, A. and Ghorbani, A. A., 2012. A
Survey of Visualization Systems for Network Security.
IEEE Transactions on Visualization and Computer
Graphics, 18(8), pp. 1313 - 1329.
Staheli, D. et al., 2014. Visualization evaluation for cyber
security: trends and future directions. Paris, France,
ACM, pp. 49-56.
Vis Sec, 2018. IEEE Symposium on Visualization for Cyber
Security. [Online] Available at:
https://vizsec.org/[Accessed 10 9 2018].
IVAPP 2019 - 10th International Conference on Information Visualization Theory and Applications
182
