
Gene Set Overlap: An Impediment to Achieving High Specificity in
Over-representation Analysis
Farhad Maleki and Anthony J. Kusalik
Department of Computer Science, University of Saskatchewan, Saskatoon, Saskatchewan, Canada
Keywords:
Gene Expression, Gene Set Analysis, Gene Set Enrichment, Gene Set Overlap, Specificity.
Abstract:
Gene set analysis methods are widely used to analyze data from high-throughput “omics” technologies. One
drawback of these methods is their low specificity or high false positive rate. Over-representation analysis is
one of the most commonly used gene set analysis methods. In this paper, we propose a systematic approach to
investigate the hypothesis that gene set overlap is an underlying cause of low specificity in over-representation
analysis. We quantify gene set overlap and show that it is a ubiquitous phenomenon across gene set databases.
Statistical analysis indicates a strong negative correlation between gene set overlap and the specificity of over-
representation analysis. We conclude that gene set overlap is an underlying cause of the low specificity. This
result highlights the importance of considering gene set overlap in gene set analysis and explains the lack of
specificity of methods that ignore gene set overlap. This research also establishes the direction for developing
new gene set analysis methods.
1 INTRODUCTION
High-throughput “omics” technologies have been
widely used to investigate biological questions that
require screening of a large number of biomolecules.
The main challenge facing these technologies is ana-
lyzing the generated data to gain biological insight.
An RNA-Seq experiment, for example, may sug-
gest several hundred genes as being differentially ex-
pressed. Manual interpretation of such a large set of
genes is impractical and susceptible to investigator
bias toward a hypothesis of interest.
Gene set analysis is a well-established computa-
tional approach to gain biological insight from data
resulting from high-throughput gene expression ex-
periments (Huang et al., 2009). It relies on the as-
sumption that most biological processes are the con-
sequence of a coordinated activity of a group of genes.
Therefore, the primary goal of gene set analysis is
to detect concordant changes in expression patterns
of predefined groups of genes, referred to as gene
sets. Members of a given gene set often share a com-
mon biological function or attribute. MSigDB (Liber-
zon et al., 2011), GeneSigDB (Culhane et al., 2011),
GeneSetDB (Araki et al., 2012), Go-Elite (Zambon
et al., 2012), and Enrichr (Kuleshov et al., 2016)
are among the most widely used gene set databases.
These databases have been generated from vari-
ous sources including GO (Ashburner et al., 2000),
KEGG (Kanehisa et al., 2016), Reactome (Joshi-Tope
et al., 2005), and BioCarta (Nishimura, 2001).
Often gene set analysis methods report a large
number of gene sets as being differentially enriched,
where the majority of the reported gene sets are bi-
ologically irrelevant or uninformative (Tarca et al.,
2013). The rapid growth of the size of gene set
databases is intensifying this issue. Consequently,
gaining biological insight from the results of gene set
analysis is becoming more challenging and prone to
investigator biases in favour of a hypothesis of inter-
est. For example, Araki et al. used GeneSetDB to an-
alyze a list of 79 differentially expressed Affymetrix
probe sets (Araki et al., 2012) resulting from an ex-
periment where endothelial cells were induced to un-
dergo apoptosis (Johnson et al., 2004). After cor-
rection for multiple hypothesis testing, they reported
1694 gene sets as statistically significant, i.e. differ-
entially enriched. Interpreting this large number of
gene sets is challenging.
Understanding the factors contributing to low
specificity in gene set analysis helps in choosing
methods that are more robust against these factors.
Such an understanding also facilitates interpreting the
results of gene set analysis methods and accelerates
the development of new methods that address these
contributing factors to achieve higher specificity with-
182
Maleki, F. and Kusalik, A.
Gene Set Overlap: An Impediment to Achieving High Specificity in Over-representation Analysis.
DOI: 10.5220/0007376901820193
In Proceedings of the 12th International Joint Conference on Biomedical Engineering Systems and Technologies (BIOSTEC 2019), pages 182-193
ISBN: 978-989-758-353-7
Copyright
c
2019 by SCITEPRESS – Science and Technology Publications, Lda. All rights reserved
out sacrificing sensitivity and accuracy.
Specificity of gene set analysis methods in the
absence of differential expression of genes has been
studied. Tarca et al. (Tarca et al., 2013) investigated
the specificity of sixteen gene set analysis methods in
the absence of differential expression and showed that
even when there is no differential expression, some
gene set analysis methods produce a large number
of false positives. However, their approach cannot
be used to assess the specificity of a gene set analy-
sis method in the presence of differentially expressed
genes.
Overlap between gene sets has been suggested
as being responsible for the low specificity of gene
set analysis methods. To deal with overlap between
gene sets, PADOG (Tarca et al., 2012) assigns lower
weights to genes that belong to more than one gene
set. For a given gene g, this weight is negatively
correlated with the number of gene sets containing
g. TopGO (Alexa et al., 2006) is another attempt
to deal with gene set overlap. It considers that
Gene Ontology (GO) terms are organized as a di-
rected acyclic graph encoding a hierarchy of general-
to-more-specific terms. This structure leads to com-
monality between the genes corresponding to a child
node and those of its parent(s). TopGO proposes a
gene elimination and a gene down-weighting proce-
dure to decorrelate the GO graph structure resulting
from these relations. MGSA (Bauer et al., 2010)
utilises a Bayesian approach that considers the over-
lap between GO categories to reduce the number of
false positives. SetRank (Simillion et al., 2017) is an-
other attempt at reducing the number of false positives
by considering the overlap between gene sets.
Parallel to the development of gene set analysis
methods, various gene set databases have been de-
veloped. The prevailing trend in developing gene set
databases has been introducing more gene sets and in-
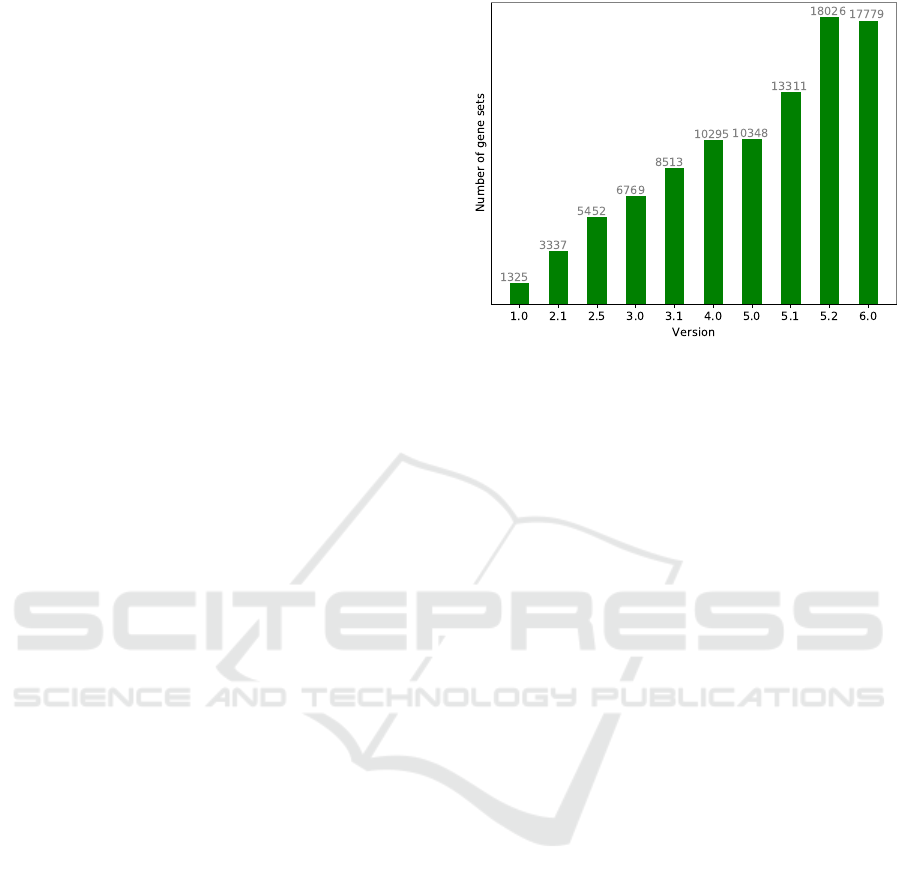
creasing database size. Figure 1 illustrates the growth
of MSigDB across its versions. This gene set database
has been designed for gene set analysis in human,
and its current version includes gene sets from various
sources such as GO, KEGG, Reactome, and BioCarta.
This gene set database has undergone a 13-fold in-
crease in the number of gene sets compared to its first
version. Given the limited number of known genes
for human, this steep growth leads to an increase in
the number of gene sets overlapping with each other.
To the best of our knowledge, there is no system-
atic study of the effect of gene set overlap on the re-
sults of gene set analysis. In this paper, we investigate
the hypothesis that gene set overlap plays a prominent
role in the lack of specificity of over-representation
analysis (ORA), which is one of the most widely used
Figure 1: The number of gene sets in different versions of
MSigDB.
gene set analysis methods (Draghici et al., 2003).
The rest of the paper is organised as follows. In
Section 2, we briefly describe ORA. In Section 3,
we show that gene set overlap is a ubiquitous phe-
nomenon in gene set databases; we use quantita-
tive measures to visualize gene set overlap in Gene-
SetDB (Araki et al., 2012), GeneSigDB (Culhane
et al., 2010), and MSigDB (Liberzon et al., 2011),
which are well-established gene set databases. In Sec-
tion 4, using these quantitative measures, we intro-
duce a methodology to study the effect of gene set
overlap on the specificity of ORA. In Section 5, we
describe the experimental results; using the method-
ology introduced in Section 4, we statistically investi-
gate the effect of gene set overlap on the specificity
of ORA by assessing the correlation between gene
set overlap and specificity. In Section 6, we discuss
the implication of gene set overlap and the challenges
it entails. We also provide suggestions for develop-
ing and evaluating gene set analysis methods. Finally,
Section 7 offers a short summary and conclusion.
2 OVER-REPRESENTATION
ANALYSIS
Many algorithms have been proposed and used for
gene set analysis, of which ORA is one of the most
widely used. Due to its simplicity, well-established
underlying statistical model, and ease of implementa-
tion, ORA is available through many tools (Beißbarth
and Speed, 2004), (Berriz et al., 2003), (Boyle et al.,
2004), (Jiao et al., 2012), (Maere et al., 2005), (Wang
et al., 2017), (Wrobel et al., 2005), (Young et al.,
2005), (Zeeberg et al., 2003), (Zeeberg et al., 2005),
(Zhang et al., 2005). This method defines a concor-
Gene Set Overlap: An Impediment to Achieving High Specificity in Over-representation Analysis
183

Table 1: Representation of ORA as a contingency table.
Each cell contains a count of genes satisfying the condition
given by the row and column.
Genes ∈ L Genes /∈ L Total
Genes ∈ G
i
n
0
i
kG
i
k −n
0
i
kG
i
k
Genes ∈ G
i
kLk −n
0
i
(n − kG
i
k) -
(kLk −n
0
i
)
n −kG
i
k
Total kLk n −kLk n
dant change in expression pattern of members of a
given gene set as a change that is unlikely to happen
by chance. It also quantifies the concept of change
as the number of differentially expressed genes in a
pairwise comparison of phenotypes, e.g. “cancerous”
versus “non-cancerous”.
ORA can be outlined as follows (Dr
ˇ
aghici et al.,
2003). Suppose that data analysis for an experiment
using a high-throughput technology predicts a set of
differentially expressed genes L, and that the inter-
section of L and a given gene set G
i
contains n
0
i
genes.
In addition, assume that the set of background genes,
i.e. all genes with a non-zero probability of being dif-
ferentially expressed, contains n genes. For example,
the background genes in a microarray study can be
the set of all genes represented on the arrays. Denote
the background set as U. Let G
i
refer to the comple-
ment of G
i
with respect to U, i.e. all genes in U but
not in G
i
. Given L, G
i
, and U, ORA assesses whether
the number of differentially expressed genes in G
i
is
more than what it should be just by chance, i.e. it is
over-represented. Table 1 represents ORA as a con-
tingency table, where k• k is the cardinality operator.
Assuming that genes are selected using a sim-
ple random sampling approach, ORA can be mod-
eled using a hypergeometric distribution (Dr
ˇ
aghici
et al., 2003). Accordingly, the probability of hav-
ing n
0
i
genes from G
i
among differentially expressed
genes, i.e. L, is as follows:
f (n
0
i
;n,kG
i
k,kLk) =
kG
i
k
n
0
i
×
n−kG
i
k
kLk−n
0
i
n
kLk
(1)
In addition, Fisher’s exact test can be used to
examine the significance of the association between
genes in G
i
and genes in L. The p-value can be cal-
culated for over-representation of G
i
based on Equa-
tion 2.
p =
kG
i
k
∑
j=n
0
i
f ( j; n,kG
i
k,kLk)
= 1 −
n
0
i
−1
∑
j=0
f ( j; n,kG
i
k,kLk) (2)
3 OVERLAP IN GENE SET
DATABASE
ORA, as with other gene set analysis methods, re-
lies on availability of a gene set database. Gene set
databases are developed by collecting genes that are
manually or computationally inferred to share a com-
mon biological function or attribute. The availabil-
ity of a priori knowledge through public repositories
such as GO (Ashburner et al., 2000), KEGG (Kane-
hisa et al., 2016), and OMIM (Hamosh et al., 2002)
makes it possible to develop gene set databases. There
are many publicaly available gene set databases in-
cluding L2L (Newman and Weiner, 2005), Signa-
tureDB (Shaffer et al., 2006), CCancer (Dietmann
et al., 2010), GeneSigDB (Culhane et al., 2010),
GeneSetDB (Araki et al., 2012), and MSigDB (Liber-
zon et al., 2011). The latter three are widely used for
gene set analysis.
MSigDB is the gene set database integrated with
GSEA (Subramanian et al., 2005). MSigDB acquires
gene sets through manual curation and computational
methods (Liberzon et al., 2011). As a meta-database,
MSigDB extracts gene sets from several sources in-
cluding GO (Ashburner et al., 2000), KEGG (Kane-
hisa et al., 2016), Reactome (Joshi-Tope et al., 2005),
and BioCarta (Nishimura, 2001).
GeneSigDB is another database of gene sets ex-
tracted from published experimental expression stud-
ies of genes, proteins, or miRNAs. GeneSigDB relied
on PubMed searches to collect papers relevant to a set
of search terms mainly focused on cancer, lung dis-
ease, development, immune cells, and stem cells. To
develop the database, the authors downloaded the rel-
evant papers and then manually transcribed gene sets
from them or their supplementary documents.
GeneSetDB, as another meta-database, is a collec-
tion of 26 public databases focused on pathways, phe-
notypes, drugs, gene regulation, or Gene Ontology.
The primary focus of GeneSetDB is human, although
it supports mouse and rat using computationally in-
ferred homology (Araki et al., 2012).
3.1 Gene Set Overlap and ORA: A
Hypothetical Example
To show how overlap of gene sets can affect the re-
sults of ORA, in this section we present a hypothet-
ical example. Suppose that in a high-throughput ex-
periment, the expression activity of 10000 genes has
been measured. After conducting the experiment and
performing single gene analysis, 100 genes have been
predicted as being differentially expressed. Consider
gene sets A, B, and C as illustrated in Figure 2, where
BIOINFORMATICS 2019 - 10th International Conference on Bioinformatics Models, Methods and Algorithms
184
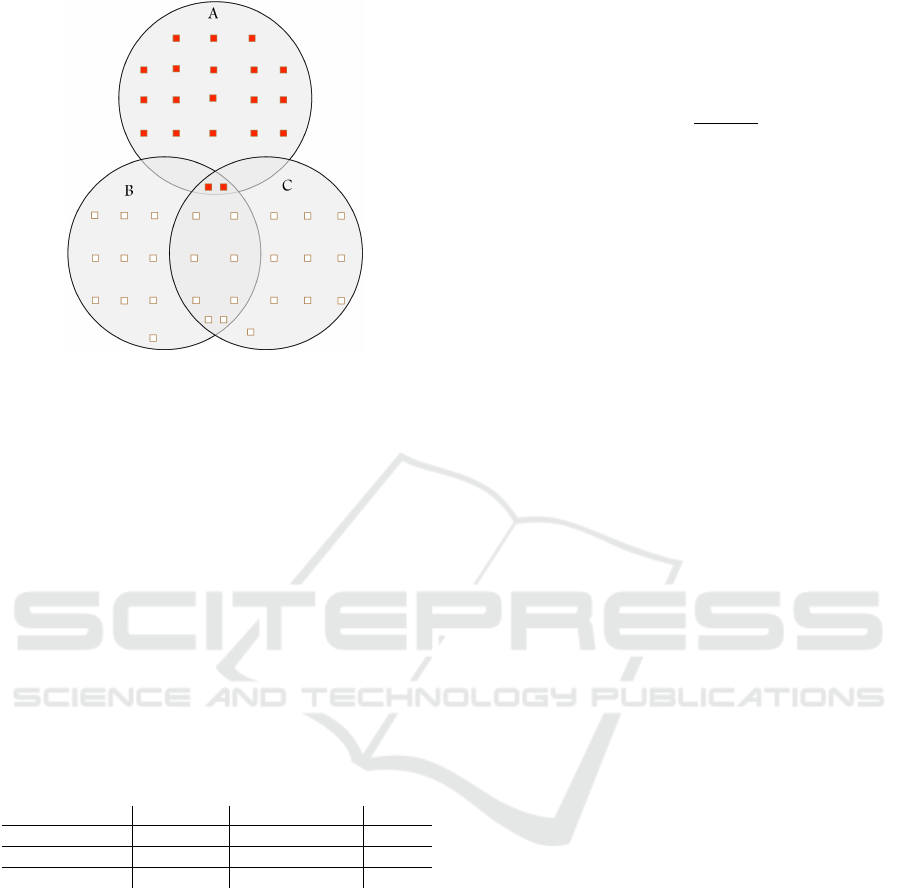
Figure 2: A hypothetical example: gene set overlap leading
to lack of specificity of ORA. Each circle represents a gene
set. Rectangles coloured in red and white represent differ-
entially expressed and non-differentially expressed genes,
respectively. Gene set B (and also C) is predicted as being
differentially enriched by ORA solely due to partial overlap
with A, a truly differentially enriched gene set.
gene sets are depicted as circles, and genes belonging
to each gene set are depicted as rectangles. In each
gene set, genes predicted as being differentially ex-
pressed are coloured in red and the rest of the genes
are coloured in white. As shown in Figure 2, all genes
in A have been predicted as being differentially ex-
pressed. Table 2 illustrates the contingency table for
over-representation of B.
Table 2: The contingency table for the over-representation
of B. DE stands for differentially expressed and Non-DE
stands for non-differentially expressed.
DE Genes Non-DE Genes Total
Genes in B 2 18 20
Genes not in B 98 9882 9980
Total 100 9900 10000
According to Fisher’s exact test, B is predicted as
being differentially enriched with a 95% confidence
level (p-value = 0.0167). This result is primarily due
to the overlap between A and B. This example sug-
gests that gene set overlap can lead to a lack of speci-
ficity in gene set analysis methods.
In this paper, we use GeneSigDB version 4, Gene-
SetDB for Human (downloaded on February 2, 2018),
and MSigDB version 6.0, unless stated otherwise.
3.2 Measuring Gene Set Overlap
To study gene set overlap and its effect on the speci-
ficity of ORA, we use the Jaccard coefficient to quan-
tify the overlap between two gene sets. We then use
this quantitative measure to visualize gene set overlap
in MSigDB, GeneSetDB, and GeneSigDB.
For given sets A and B, the Jaccard coefficient is
defined as follows:
J(A,B) =
kA ∩ Bk
kA ∪ Bk
(3)
The Jaccard coefficient is a value between 0 and 1,
where J(A,B) = 0 means that there is no overlap be-
tween A and B; J(A,B) = 1 means that there is a com-
plete overlap between A and B, i.e. A = B; and other
values (0 < J(A,B) < 1) represent partial overlaps be-
tween A and B. The Jaccard index can be used to
quantify the overlap between two sets; for example, it
can be used to measure the overlap between two gene
sets from a gene set database or the overlap between
a gene set and a set of differentially expressed genes
resulting from a gene expression study. Hereafter, we
refer to Jaccard index as overlap score.
For a given set of genes L
i
and a gene set database
G, we define the overlap coefficient, or overlap score,
of L
i
with respect to G as follows:
O(L
i
,G) =
∑
G
j
∈G
J(L
i
,G
j
) (4)
This measure is representative of the cumulative over-
lap of L
i
with all gene sets in the gene set database G.
For the sake of brevity, whenever gene set database G
can be inferred from the context, we use the phrase
“overlap score of L
i
” to refer to O(L
i
,G). Note that
O(L
i
,G), which is the summation of overlap between
L
i
and each gene set in the gene set database G, should
not be mistaken with overlap between two sets of
genes. The latter is calculated using the Jaccard in-
dex (Equation 3).
3.3 Visualization of Gene Set Overlap
We visualize a gene set database as a graph, where
each gene set G
i
is represented as a vertex v
i
, and
there is an edge between two vertices v
i
and v
j
if
J(G
i
,G
j
) > 0; the value of J(G
i
,G
j
) is used as the
weight for this edge. Since the Jaccard coefficient
is symmetric, the graph defined using this measure
is an undirected graph. Due to the sheer number of
overlapping gene sets, such a graph has a large num-
ber of edges. To visualize substantial overlaps be-
tween gene sets, we only show overlap scores greater
than or equal to 0.5, while retaining all vertices. In
other words, in all graph visualizations in this paper,
an edge between two vertices v
i
and v
j
indicates that
their corresponding gene sets, i.e. G
i
and G
j
, share
at least half of their genes. The “hairballs” in Fig-
ure 3 and also Figures 6 and 7 (in the Appendix)
are due to the existence of a large number of edges,
Gene Set Overlap: An Impediment to Achieving High Specificity in Over-representation Analysis
185
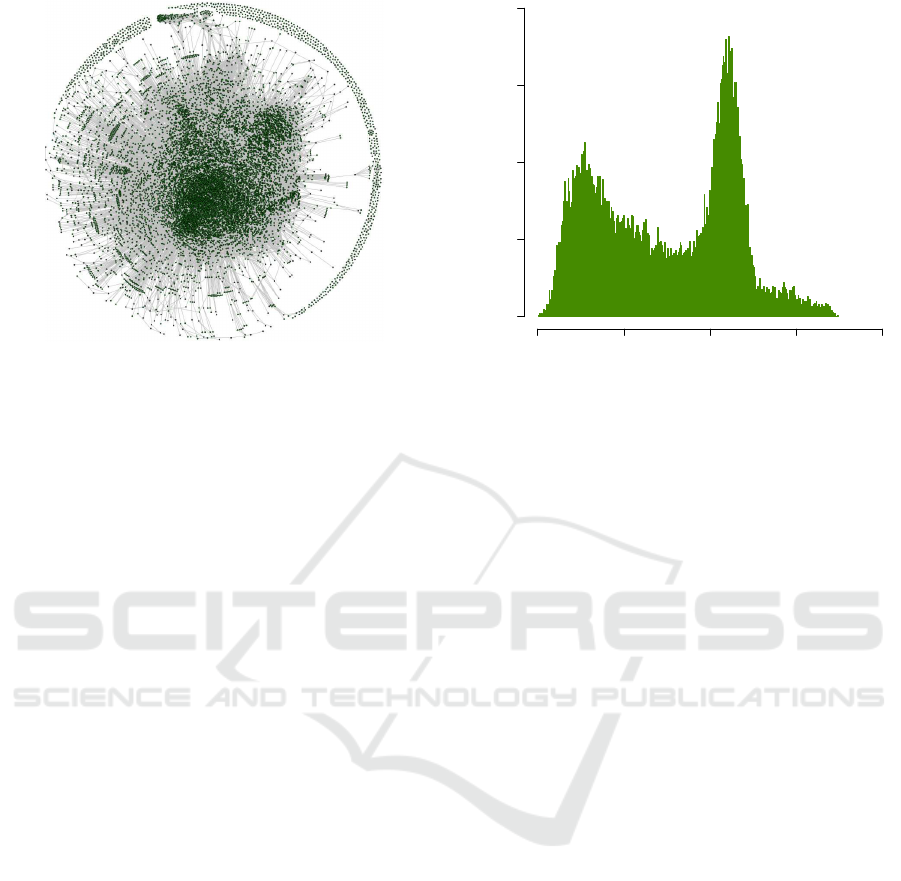
Figure 3: The graph representing the overlap between gene
sets in MSigDB. In this graph, each vertex represents a gene
set in MSigDB, and each edge represents an overlap with
Jaccard coefficient greater than or equal to 0.5 between two
gene sets (see Equation 3). The “hairball” is the result of a
large number of gene sets with a substantial overlap (≥ 0.5)
with each other.
i.e. pairs of gene sets with a substantial amount of
overlap. These graphs highlight the existence of gene
set overlap as a ubiquitous phenomenon in gene set
databases. The graph visualization can be generated
using Fruchterman Reingold layout (Fruchterman and
Reingold, 1991) in Gephi (version 0.9.2) (Bastian
et al., 2009).
To further visually inspect the gene set overlap in
a given gene set database G, we use a frequency plot.
For each gene set G
i
in G, we calculate f
i
= k{G
j
|
J(G
i
,G
j
) > 0 ( j 6= i) and G
j
∈ G}k. f
i
is the number
of gene sets G
j
( j 6= i) in G with a non-zero overlap
with G
i
. After calculating f
i
values for all G
i
in G,
we use a frequency plot to show the distribution of
f
i
values. Figure 4 and also Figures 8, and 9 (in the
Appendix) illustrate the distribution of f
i
values for
MSigDB, GeneSetDB, and GeneSigDB, respectively.
These figures are in agreement with Figure 3, 6, and
7 and show the prevalence of gene set overlap in the
aforementioned gene set databases.
Figure 4 suggests that overlap scores in MSigDB
follow a multimodal distribution. This can be at-
tributed to the fact that MSigDB is a meta-database
that extracts gene sets from several sources including
GO, KEGG, Reactome, and BioCarta. A compelling
result revealed by Figure 4 is that majority of gene
sets in MSigDB have at least a non-zero overlap with
more than 1000 other gene sets in MSigDB (out of a
total of 17778 gene sets). Also, there is no gene set in
MSigDB without overlap with some other gene set(s).
Finally, there are gene sets that overlap with the ma-
jority of gene sets in MSigDB. For example, the gene
Frequency
0 5000 10000 15000 20000
0 50 100 150 200
f
i
Figure 4: A frequency plot for f
i
values in MSigDB illus-
trates the prevalence of gene set overlap. For each gene set
G
i
in a gene set database G (MSigDB here), f
i
is the number
of gene sets G
j
( j 6= i) in G with J(G
i
,G
j
) > 0.
set associated with the “cellular response to organic
substance” GO term (GO:0071310) has one non-zero
overlap with 17292 gene sets. This gene set is asso-
ciated with a general GO term and therefore overlaps
a large number of gene sets including the gene sets
defined using relatively more specific GO terms.
4 METHODOLOGY
Evaluation of ORA using a quantitative measure
such as specificity requires a gold standard dataset for
which the differentially enriched gene sets are a pri-
ori known. Such a gold standard does not exist. In
this section, we propose a methodology for a quanti-
tative evaluation of the effect of gene set overlap on
the specificity of ORA in the absence of such a gold
standard dataset.
To perform ORA, a single gene analysis method
must be conducted to predict the set of differentially
expressed genes. This set serves as one of the in-
puts to ORA. In practice, often noise and biological
variability introduce errors—i.e. false positives and
false negatives—in the result of single gene analysis.
In the context of single gene analysis, false positives
are genes that are not differentially expressed but pre-
dicted as being so, and false negatives are genes that
are differentially expressed but predicted as not being
such. False negatives in single gene analysis may re-
duce the sensitivity of ORA, while false positives may
reduce the specificity. To avoid the interference of the
single gene analysis errors in the study of gene set
overlap and its effect on the specificity of ORA, we
BIOINFORMATICS 2019 - 10th International Conference on Bioinformatics Models, Methods and Algorithms
186

assume that differentially expressed genes have been
identified correctly; also, this is the same assumption
that ORA relies on. Therefore, to perform the quan-
titative evaluation, a scenario in which all genes in a
given gene set have been accurately detected as being
differentially expressed is considered.
To deal with the absence of a gold standard
dataset, in this paper the following procedure is used
to identify the true enrichment status of gene sets.
Given a gene set database G = {G
j
| 1 ≤ j ≤ m} and
L
i
, a set of differentially expressed genes, and a fixed
parameter γ, for each gene set G
j
∈ G we consider G
j
as being truly differentially enriched if at least 100×γ
percent of its members are differentially expressed
genes, i.e.
kG
j
∩L
i
k
kG
j
k
≥ γ. Otherwise, G
j
is considered
as not being truly differentially enriched. γ serves as
a threshold; since there is no consensus about such a
threshold value, we repeat the main experiments for a
wide range of values for γ, and we show that regard-
less of the value chosen for γ the results are consis-
tent. In the rest of the paper, the set of truly differ-
entially enriched and truly nondifferentially enriched
gene sets are denoted by T
+
i
(γ) and T
−
i
(γ), respec-
tively, and are defined as follows:
T
+
i
(γ) = {G
j
∈ G |
kG
j
∩ L
i
k
kG
j
k
≥ γ} (5)
T
−
i
(γ) = {G
j
∈ G |
kG
j
∩ L
i
k
kG
j
k
< γ} (6)
Hereafter, for the sake of brevity, we avoid writing
the parameter γ; for example, we refer to T
+
i
(γ) and
T
−
i
(γ) as T
+
i
and T
−
i
respectively.
Given γ and L
i
, Equations 5 and 6 determine the
true enrichment status of all gene sets in G. Knowing
the true enrichment status of gene sets, we run ORA.
The parameters (inputs) for running ORA are: a list of
differentially expressed genes L
i
, a significance level
α, a background set U, and a gene set database G =
{G
j
: 1 ≤ j ≤ m}.
In this research, the experiments were conducted
using python version 3.6.2. To implement ORA,
the fisher exact method from the stats module of
scipy version 0.19.1 was used. Also, the Benjamini-
Hochberg FDR adjustment for multiple comparisons
was performed using the multipletests method (with
method parameter equal to fdr bh) from statsmodels
version 0.8.0.
For each gene set G
j
in G, ORA calculates a p-
value p
j
. After calculating p
1
,.. ., p
m
—the p-values
corresponding to the over-representation of gene sets
G
1
,.. .,G
m
in G according to Equation 2—the Ben-
jamini-Hochberg FDR adjustment (Dr
˘
aghici, 2016)
for multiple comparisons is applied. All gene sets
with an adjusted p-value less than α are predicted as
significant, i.e. being differentially enriched. G
+
i
is
defined as the set of all such significant gene sets. G
+
i
includes both true positives and false positives. G
−
i
is defined as the set of all nonsignificant gene sets,
i.e. G
−
i
= G − G
+
i
. G
−
i
includes both true negatives
and false negatives. For the given value of γ, true
positives (TP
i
), false positives (FP
i
), true negatives
(TN
i
), and false negatives (FN
i
) are identified based
on Equations 7, 8, 9, and 10.
T P
i
= T
+
i
∩ G
+
i
(7)
FP
i
= G
+
i
− T
+
i
(8)
T N
i
= T
−
i
∩ G
−
i
(9)
FN
i
= G
−
i
− T
−
i
(10)
Using these values, specificity (SPC
i
) is calculated ac-
cording to Equation 11.
SPC
i
=
kT N
i
k
kT N
i
k + kFP
i
k
(11)
To be able to gain insight that is unbiased toward a
single set L
i
, this process is repeated many times, each
time with a different L
i
. We denote the set of all L
i
as
L = {L
i
| 1 ≤ i ≤ l}.
Algorithm 1 (see the Appendix) illustrates the
methodology for conducting the experiment. In each
iteration of the algorithm, i.e. the outer loop, a gene
set L
i
from L is used, and the process is repeated for
all gene sets in L. In addition, for each set L
i
∈ L, the
overlap score of L
i
with respect to gene set database
G, i.e. O(L
i
,G), is calculated according to Equa-
tion 4. Having overlap score and specificity measure
for each L
i
∈ L, the relationship between overlap and
the specificity of ORA can be assessed using statisti-
cal methods (see Section 5).
5 EXPERIMENTAL RESULTS
To study the effect of gene set overlap on the speci-
ficity of ORA using Algorithm 1, MSigDB—one of
the most widely used gene set databases devoted to
gene set analysis—was used as the gene set database
G. Since ORA requires a list (set) of differentially
expressed genes as input, Algorithm 1 requires a col-
lection of such lists (denoted as L in the algorithm).
ImmuneSigDB (Godec et al., 2016) version 6.0 was
used to provide such a collection. ImmuneSigDB
contains lists of differentially expressed genes, each
created by identifying differentially expressed genes
in a dataset extracted from Gene Expression Omnibus
(GEO) (Edgar et al., 2002). Therefore, each list in
ImmuneSigDB represents a set of differentially ex-
pressed genes derived from a high-throughput study.
Gene Set Overlap: An Impediment to Achieving High Specificity in Over-representation Analysis
187
To investigate the association between gene set
overlap and the specificity of ORA results, first the
overlap score O(L
i
,G) was calculated for each list L
i
in ImmuneSigDB. In this experiment, a significance
level α = 0.05 and γ values equal to 0.1, 0.2, 0.3, 0.4,
0.5, 0.6, 0.7, 0.8, 0.9, and 0.99 were used. For each
value of γ, Algorithm 1 was run to calculate SPC
i
cor-
responding to each L
i
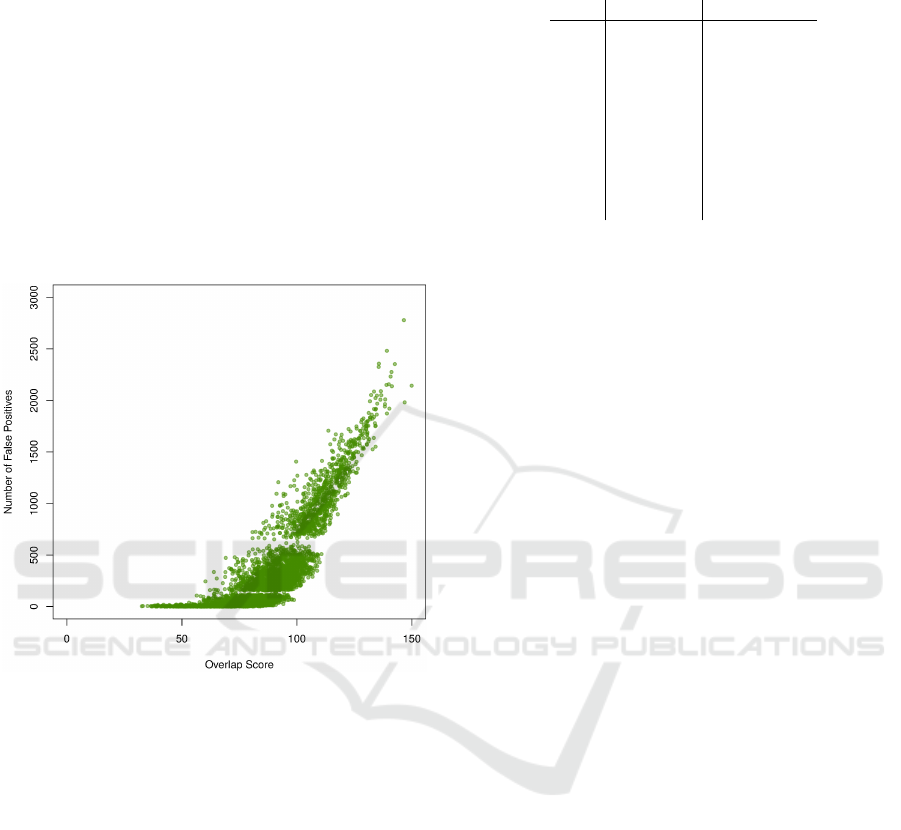
∈ L. Figure 5 illustrates the
relationship between gene set overlap and the num-
ber of false positives for γ = 0.5. As overlap score in-
creases, we observe an increase in the number of false
positives and therefore a decline in the specificity. We
observed the same pattern for all the aforementioned
values of γ.
Figure 5: Number of false positives increases as overlap
score increases (γ = 0.5). A similar pattern was observed
for other values of γ.
To study the relationship between gene set over-
lap and the specificity of ORA, we used a statistical
test of correlation. Choosing a proper test of corre-
lation requires assessment of the normality assump-
tion. To test the null hypothesis that specificity values
are normally distributed, we used the Shapiro-Wilk
test (Shapiro and Wilk, 1965). Table 4 shows the test
results for the aforementioned values of γ. Consid-
ering those results, as confirmed by the histogram in
Figure 10 (see Appendix), we concluded that speci-
ficity values are not normally distributed. Therefore,
a Spearman’s rank correlation coefficient test, a non-
parametric test, was conducted for each value of γ to
test the null hypothesis that there is no correlation be-
tween specificity and overlap scores. Table 3 shows
the result of this test for various values of γ. Con-
sidering these results, we concluded that there is a
strong negative correlation between gene set overlap
and specificity of ORA.
Table 3: The result of Spearman rank correlation tests for
different values of γ. All p-values are less than 0.0000001.
γ r
s
p-value
0.10 -0.884064 <0.0000001
0.20 -0.880628 <0.0000001
0.30 -0.879913 <0.0000001
0.40 -0.879589 <0.0000001
0.50 -0.879366 <0.0000001
0.60 -0.879301 <0.0000001
0.70 -0.879302 <0.0000001
0.80 -0.879301 <0.0000001
0.90 -0.879307 <0.0000001
0.99 -0.879307 <0.0000001
6 DISCUSSION
In this research, we proposed a systematic approach
for evaluating the specificity of over-representation
analysis. Using the proposed method, we demon-
strated that there is a significant negative correlation
between the specificity of ORA and gene set overlap.
In other words, gene set overlap increases the number
of false positives, i.e. gene sets incorrectly predicted
as being differentially enriched. The increase in the
number of false positives makes interpreting the re-
sults of ORA difficult and prone to investigator biases
toward a hypothesis of interest. It also hinders repro-
ducibility of gene set analysis results.
We also showed that gene set overlap is a ubiq-
uitous phenomenon across gene set databases. The
existence of multifunctional genes is one contributor
to this phenomenon. Multifunctional genes are genes
associated with several molecular functions or bio-
logical processes; therefore, they appear in several
gene sets, contributing to gene set overlap. Multi-
functional genes are commonplace; for example, Pri-
tykin et al. (Pritykin et al., 2015) identified 2517 mul-
tifunctional genes in the human genome. As a conse-
quence, gene set overlap is an integral characteristic
of gene set databases. Another factor contributing to
the prevalence of gene set overlap in databases that
define some (or all) of their gene sets based on GO is
the child-parent relationship between GO terms. GO
terms are organized as a directed acyclic graph; each
node represents a GO term; and each edge between
two nodes represents a parent-child relationship be-
tween terms, with the child term being more specific
than its parent term(s). Therefore, gene sets derived
from GO terms that are involved in such child-parent
relationships share common genes; this, in turn, con-
tributes to the existence of gene set overlap.
Being an integral part of gene set databases, gene
set overlap should be considered in the design and
evaluation of gene set analysis methods. However,
many gene set analysis studies have used simulated
BIOINFORMATICS 2019 - 10th International Conference on Bioinformatics Models, Methods and Algorithms
188

collections of non-overlapping gene sets for method
evaluation and comparison (Ackermann and Strim-
mer, 2009), (Efron and Tibshirani, 2007), (Nam and
Kim, 2008). Therefore, gene set overlap and its ef-
fect on the outcome of gene set analysis methods have
been overlooked. We suggest using datasets that ac-
count for overlap as a requirement in the evaluation of
gene set analysis methods.
Although many gene set analysis methods and
tools have been developed, there are very few meth-
ods that consider gene set overlap. For example,
PADOG is an attempt for addressing gene set over-
lap that leads to a small number of false positives
(has high specificity), but its sensitivity has been re-
ported to be lower than that of other gene set anal-
ysis methods (see Table S2 from the work by Tarca
et al., 2013). SetRank is another gene set analysis
method designed with gene set overlap in mind to in-
crease specificity (Simillion et al., 2017). The authors
of SetRank claimed that due to a lower number of
false positives, the significant results reported by this
method are more reliable than other methods. There-
fore, it may be a viable solution for the lack of speci-
ficity of gene set analysis methods. A rigorous evalu-
ation of the specificity and sensitivity of this method
is suggested as future research.
The existence of gene set databases that accurately
represent biological processes and functions is essen-
tial to the success of gene set analysis. Increasing the
size of gene set databases by depositing more gene
sets has been the common trend in developing gene
set databases. The increase in the number of gene
sets has introduced more gene set overlap, which in
turn leads to a higher false positive rate. There is a
need to focus on quality rather than sheer quantity in
developing gene set databases. We suggest further re-
search on the quality control of gene set databases.
Another suggestion for improving the specificity
of current methods is to exclude irrelevant or unin-
formative gene sets before conducting gene set analy-
sis. Considering the size of gene set databases, filter-
ing these gene sets is laborious and, if done manually,
prone to investigator bias toward gene sets considered
“relevant”. Developing a computational approach for
filtering irrelevant or uninformative gene sets would
be worthwhile.
In the proposed method for evaluating ORA, we
considered scenarios with only one differentially en-
riched gene set. In practice, a specific phenotype
may be the result of altering several biological pro-
cesses or functions, i.e. multiple gene sets. We ex-
pect that the differential enrichment of several gene
sets intensifies the extent to which gene set overlap
reduces specificity. In other words, we expect to see a
larger number of false positives compared to the situ-
ation considered in this work. The proposed method
is capable of handling scenarios with several differ-
entially enriched gene sets. Also, Algorithm 1 can be
used seamlessly with sensitivity or accuracy instead
of specificity.
Since the input to ORA is a list of differentially
expressed genes, we utilized ImmuneSigDB (Godec
et al., 2016) for evaluating ORA. However, some
gene set analysis methods require an expression ma-
trix that represents expression level of genes under
study across control and case samples. The proposed
methodology is capable of evaluating such gene set
analysis methods. To do so, the only requirement is
developing expression profiles with the differentially
enriched gene set(s) encoded in expression values.
Therefore, our methodology can be used as a system-
atic approach to study specificity, sensitivity, and ac-
curacy of other gene set analysis methods. For exam-
ple, we suggest the study of the relationship between
gene set overlap and the specificity of GSEA (Sub-
ramanian et al., 2005), which is another well-estab-
lished gene set analysis method, as future work.
In the absence of gene set overlap, gene set anal-
ysis is a trivial problem, as many methods have
achieved high specificity when being evaluated (by
their authors) using simulated gene set databases with
non-overlapping gene sets. If gene set overlap was
considered in the evaluation of these methods, the
lack of specificity of many gene set analysis methods
would be obvious. For example, assume a gene set
analysis method that uses average expression value of
genes within a gene set (in control versus case sam-
ples) to predict the enrichment status of a gene set.
Also assume that there is a single differentially ex-
pressed gene that appears in 100 gene sets. Such a
method would report all 100 gene sets as being differ-
entially enriched, while most of these gene sets might
be biologically irrelevant. Therefore, we strongly rec-
ommend considering gene set overlap in any attempt
for evaluating gene set analysis using simulated data.
7 CONCLUSION
In this paper, we proposed a systematic approach to
study the effect of gene set overlap on the result of
ORA (over-representation analysis). Using the pro-
posed method and statistical analysis, we showed
that there is a significant negative correlation between
gene set overlap and specificity of ORA. We quanti-
fied gene set overlap and showed that it is a ubiquitous
phenomenon across gene set databases. The proposed
approach for the study of the relationship between
Gene Set Overlap: An Impediment to Achieving High Specificity in Over-representation Analysis
189

gene set overlap and specificity of ORA can easily
be used to investigate the effect of gene set overlap on
different gene set analysis methods using quantitative
measures such as specificity, sensitivity, and accuracy.
Considering the effect of gene set overlap on the re-
sults of ORA, it is essential to develop and use meth-
ods that address gene set overlap and achieve higher
specificity without sacrificing sensitivity in the pre-
diction of differentially enriched gene sets. Due to
the lack of gold standard datasets, where the differ-
entially enriched gene sets are known a priori, sim-
ulated datasets have been widely used for evaluation
of gene set analysis methods. The databases used in
these studies are often a collection of non-overlapping
gene sets of the same size. This setting is substantially
different from a real gene set database where gene
set overlap is common. By completely ignoring gene
set overlap, some methods achieve high specificity on
simulated data but behave inadequately when work-
ing in real settings. We strongly recommend that the
use of non-overlapping datasets be avoided for evalu-
ation of gene set analysis methods.
REFERENCES
Ackermann, M. and Strimmer, K. (2009). A general modu-
lar framework for gene set enrichment analysis. BMC
Bioinformatics, 10(1):47.
Alexa, A., Rahnenf
¨
uhrer, J., and Lengauer, T. (2006). Im-
proved scoring of functional groups from gene expres-
sion data by decorrelating go graph structure. Bioin-
formatics, 22(13):1600–1607.
Araki, H., Knapp, C., Tsai, P., and Print, C. (2012). Gene-
setdb: A comprehensive meta-database, statistical and
visualisation framework for gene set analysis. FEBS
Open Bio, 2:76 – 82.
Ashburner, M., Ball, C. A., Blake, J. A., Botstein, D.,
Butler, H., Cherry, J. M., Davis, A. P., Dolinski, K.,
Dwight, S. S., Eppig, J. T., Harris, M. A., Hill, D. P.,
Issel-Tarver, L., Kasarskis, A., Lewis, S., Matese,
J. C., Richardson, J. E., Ringwald, M., Rubin, G. M.,
and Sherlock, G. (2000). Gene ontology: tool for the
unification of biology. Nature Genetics, 25(1):25–29.
Bastian, M., Heymann, S., and Jacomy, M. (2009). Gephi:
an open source software for exploring and manipu-
lating networks. In Proceedings Of The Third Inter-
national Conference On Weblogs And Social Media
(ICWSM), volume 8, pages 361–362.
Bauer, S., Gagneur, J., and Robinson, P. N. (2010). Going
bayesian: model-based gene set analysis of genome-
scale data. Nucleic Acids Research, 38(11):3523–
3532.
Beißbarth, T. and Speed, T. P. (2004). GOstat: find statisti-
cally overrepresented gene ontologies within a group
of genes. Bioinformatics, 20(9):1464–1465.
Berriz, G. F., King, O. D., Bryant, B., Sander, C., and Roth,
F. P. (2003). Characterizing gene sets with funcasso-
ciate. Bioinformatics, 19(18):2502–2504.
Boyle, E. I., Weng, S., Gollub, J., Jin, H., Botstein,
D., Cherry, J. M., and Sherlock, G. (2004). GO::
Termfinder—open source software for accessing gene
ontology information and finding significantly en-
riched gene ontology terms associated with a list of
genes. Bioinformatics, 20(18):3710–3715.
Culhane, A. C., Schr
¨
oder, M. S., Sultana, R., Picard, S. C.,
Martinelli, E. N., Kelly, C., Haibe-Kains, B., Ka-
pushesky, M., St Pierre, A.-A., Flahive, W., et al.
(2011). GeneSigDB: a manually curated database and
resource for analysis of gene expression signatures.
Nucleic Acids Research, page D1060–D1066.
Culhane, A. C., Schwarzl, T., Sultana, R., Picard, K. C., Pi-
card, S. C., Lu, T. H., Franklin, K. R., French, S. J.,
Papenhausen, G., Correll, M., and Quackenbush, J.
(2010). Genesigdb—a curated database of gene ex-
pression signatures. Nucleic Acids Research, 38(suppl
1):D716–D725.
Dietmann, S., Lee, W., Wong, P., Rodchenkov, I., and
Antonov, A. V. (2010). CCancer: a bird’s eye view
on gene lists reported in cancer-related studies. Nu-
cleic Acids Research, 38(suppl 2):W118–W123.
Dr
˘
aghici, S. (2016). Statistics and data analysis for mi-
croarrays using R and bioconductor. CRC Press.
Draghici, S., Khatri, P., Martins, R. P., Ostermeier, G. C.,
and Krawetz, S. A. (2003). Global functional profiling
of gene expression. Genomics, 81(2):98–104.
Dr
ˇ
aghici, S., Khatri, P., Martins, R. P., Ostermeier, G. C.,
and Krawetz, S. A. (2003). Global functional profiling
of gene expression. Genomics, 81(2):98–104.
Edgar, R., Domrachev, M., and Lash, A. E. (2002). Gene
expression omnibus: Ncbi gene expression and hy-
bridization array data repository. Nucleic Acids Re-
search, 30(1):207–210.
Efron, B. and Tibshirani, R. (2007). On testing the signifi-
cance of sets of genes. The Annals of Applied Statis-
tics, pages 107–129.
Fruchterman, T. M. and Reingold, E. M. (1991). Graph
drawing by force-directed placement. Software: Prac-
tice and experience, 21(11):1129–1164.
Godec, J., Tan, Y., Liberzon, A., Tamayo, P., Bhattacharya,
S., Butte, A. J., Mesirov, J. P., and Haining, W. N.
(2016). Compendium of immune signatures identifies
conserved and species-specific biology in response to
inflammation. Immunity, 44(1):194–206.
Hamosh, A., Scott, A. F., Amberger, J., Bocchini, C., Valle,
D., and McKusick, V. A. (2002). Online mendelian
inheritance in man (omim), a knowledgebase of hu-
man genes and genetic disorders. Nucleic Acids Res,
30(1):52–55.
Huang, D. W., Sherman, B. T., and Lempicki, R. A. (2009).
Bioinformatics enrichment tools: paths toward the
comprehensive functional analysis of large gene lists.
Nucleic Acids Research, 37(1):1–13.
Jiao, X., Sherman, B. T., Huang, D. W., Stephens, R.,
Baseler, M. W., Lane, H. C., and Lempicki, R. A.
(2012). David-ws: a stateful web service to fa-
cilitate gene/protein list analysis. Bioinformatics,
28(13):1805–1806.
BIOINFORMATICS 2019 - 10th International Conference on Bioinformatics Models, Methods and Algorithms
190

Johnson, N. A., Sengupta, S., Saidi, S. A., Lessan, K.,
Charnock-Jones, S. D., Scott, L., Stephens, R., Free-
man, T. C., Tom, B. D., Harris, M., et al. (2004). En-
dothelial cells preparing to die by apoptosis initiate
a program of transcriptome and glycome regulation.
The FASEB journal, 18(1):188–190.
Joshi-Tope, G., Gillespie, M., Vastrik, I., D’Eustachio, P.,
Schmidt, E., de Bono, B., Jassal, B., Gopinath, G.,
Wu, G., Matthews, L., et al. (2005). Reactome: a
knowledgebase of biological pathways. Nucleic Acids
Research, 33(suppl 1):D428–D432.
Kanehisa, M., Sato, Y., Kawashima, M., Furumichi, M., and
Tanabe, M. (2016). Kegg as a reference resource for
gene and protein annotation. Nucleic Acids Research,
44(D1):D457–62.
Kuleshov, M. V., Jones, M. R., Rouillard, A. D., Fernandez,
N. F., Duan, Q., Wang, Z., Koplev, S., Jenkins, S. L.,
Jagodnik, K. M., Lachmann, A., McDermott, M. G.,
Monteiro, C. D., Gundersen, G. W., and Ma’ayan, A.
(2016). Enrichr: a comprehensive gene set enrich-
ment analysis web server 2016 update. Nucleic Acids
Research, 44(W1):W90–W97.
Liberzon, A., Subramanian, A., Pinchback, R., Thor-
valdsd
´
ottir, H., Tamayo, P., and Mesirov, J. P. (2011).
Molecular signatures database (MSigDB) 3.0. Bioin-
formatics, 27(12):1739–1740.
Maere, S., Heymans, K., and Kuiper, M. (2005). BiNGO: a
cytoscape plugin to assess overrepresentation of gene
ontology categories in biological networks. Bioinfor-
matics, 21(16):3448–3449.
Nam, D. and Kim, S.-Y. (2008). Gene-set approach for ex-
pression pattern analysis. Briefings in Bioinformatics,
9(3):189–197.
Newman, J. C. and Weiner, A. M. (2005). L2L: a sim-
ple tool for discovering the hidden significance in mi-
croarray expression data. Genome Biology, 6(9):R81.
Nishimura, D. (2001). Biocarta. Biotech Software & Inter-
net Report: The Computer Software Journal for Sci-
entists, 2(3):117–120.
Pritykin, Y., Ghersi, D., and Singh, M. (2015). Genome-
wide detection and analysis of multifunctional genes.
PLOS Computational Biology, 11(10):e1004467.
Shaffer, A. L., Wright, G., Yang, L., Powell, J., Ngo, V.,
Lamy, L., Lam, L. T., Davis, R. E., and Staudt, L. M.
(2006). A library of gene expression signatures to il-
luminate normal and pathological lymphoid biology.
Immunological Reviews, 210(1):67–85.
Shapiro, S. S. and Wilk, M. B. (1965). An analysis
of variance test for normality (complete samples).
Biometrika, 52(3/4):591–611.
Simillion, C., Liechti, R., Lischer, H. E., Ioannidis, V., and
Bruggmann, R. (2017). Avoiding the pitfalls of gene
set enrichment analysis with setrank. BMC Bioinfor-
matics, 18(1):151.
Subramanian, A., Tamayo, P., Mootha, V. K., Mukher-
jee, S., Ebert, B. L., Gillette, M. A., Paulovich, A.,
Pomeroy, S. L., Golub, T. R., Lander, E. S., et al.
(2005). Gene set enrichment analysis: A knowledge-
based approach for interpreting genome-wide expres-
sion profiles. Proceedings of the National Academy of
Sciences, 102(43):15545–15550.
Tarca, A. L., Bhatti, G., and Romero, R. (2013). A
comparison of gene set analysis methods in terms of
sensitivity, prioritization and specificity. PloS One,
8(11):e79217.
Tarca, A. L., Draghici, S., Bhatti, G., and Romero, R.
(2012). Down-weighting overlapping genes improves
gene set analysis. BMC Bioinformatics, 13(1):136.
Wang, J., Vasaikar, S., Shi, Z., Greer, M., and Zhang,
B. (2017). Webgestalt 2017: a more comprehen-
sive, powerful, flexible and interactive gene set enrich-
ment analysis toolkit. Nucleic Acids Research, pages
W130–W137.
Wrobel, G., Chalmel, F., and Primig, M. (2005). goCluster
integrates statistical analysis and functional interpre-
tation of microarray expression data. Bioinformatics,
21(17):3575–3577.
Young, A., Whitehouse, N., Cho, J., and Shaw, C. (2005).
Ontologytraverser: an R package for GO analysis.
Bioinformatics, 21(2):275–276.
Zambon, A. C., Gaj, S., Ho, I., Hanspers, K., Vranizan,
K., Evelo, C. T., Conklin, B. R., Pico, A. R., and Sa-
lomonis, N. (2012). Go-elite: a flexible solution for
pathway and ontology over-representation. Bioinfor-
matics, 28(16):2209–2210.
Zeeberg, B. R., Feng, W., Wang, G., Wang, M. D., Fojo,
A. T., Sunshine, M., Narasimhan, S., Kane, D. W.,
Reinhold, W. C., Lababidi, S., et al. (2003). GoMiner:
a resource for biological interpretation of genomic and
proteomic data. Genome Biology, 4(4):R28.
Zeeberg, B. R., Qin, H., Narasimhan, S., Sunshine, M.,
Cao, H., Kane, D. W., Reimers, M., Stephens,
R. M., Bryant, D., Burt, S. K., et al. (2005). High-
Throughput GoMiner, an ‘industrial-strength’ integra-
tive gene ontology tool for interpretation of multiple-
microarray experiments, with application to studies of
common variable immune deficiency (CVID). BMC
Bioinformatics, 6(1):1.
Zhang, B., Kirov, S., and Snoddy, J. (2005). WebGestalt:
an integrated system for exploring gene sets in various
biological contexts. Nucleic Acids Research, 33(suppl
2):W741–W748.
APPENDIX
Table 4: The result of Shapiro-Wilk tests for different values
of γ. All p-values are less than 0.0000001.
γ W-Statistic p value
0.10 0.783470 <0.0000001
0.20 0.773921 <0.0000001
0.30 0.771523 <0.0000001
0.40 0.770568 <0.0000001
0.50 0.770193 <0.0000001
0.60 0.769961 <0.0000001
0.70 0.769868 <0.0000001
0.80 0.769840 <0.0000001
0.90 0.769828 <0.0000001
0.99 0.769821 <0.0000001
Gene Set Overlap: An Impediment to Achieving High Specificity in Over-representation Analysis
191
Algorithm 1: Calculation of specificity of ORA.
Input:
G = {G
j
| 1 ≤ j ≤ m}: A gene set database
L = {L
i
| 1 ≤ i ≤ l}: A set of differentially
expressed gene lists
U: A set of genes used as background set
for ORA
α : The significance level
γ : The threshold value used for identifying
true positives
Output:
Specificity value corresponding to
each L
i
∈ L
i = 1
while i ≤ l do
j = 1
while j ≤ m do
p
j
= ORA(G
j
,L
i
,U)
j = j + 1
end while
Calculate p
ad justed
j
as the adjusted p-value corre-
sponding to p
j
, where (1 ≤ j ≤ m)
G
+
i
← {G
k
| p
ad justed
k
< α and 1 ≤ k ≤ m}
G
−
i
= G − G
+
i
Calculate T
+
i
(γ) and T
−
i
(γ) using Equations 5
and 6
Calculate TP
i
, FP
i
, TN
i
, and FN
i
using Equa-
tions 7, 8, 9, and 10
Calculate SPC
i
using Equation 11
i = i + 1
end while
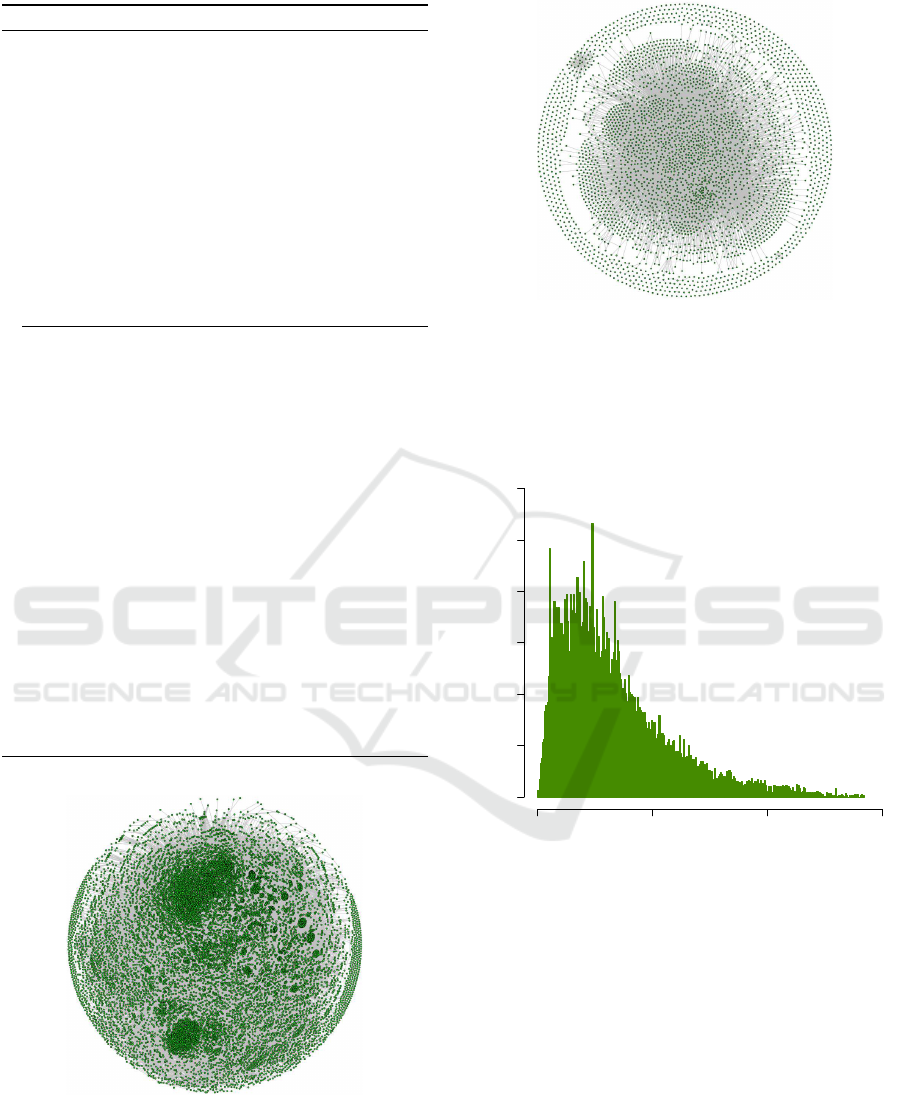
Figure 6: The graph representing the overlap between gene
sets in GeneSetDB. In this graph, each vertex represents a
gene set in GeneSetDB, and each edge represents an overlap
with Jaccard coefficient greater than or equal to 0.5 between
two gene sets. The “hairball” is the result of a large number
of gene sets with a substantial overlap (≥ 0.5) with each
other.
Figure 7: The graph representing the overlap between gene
sets in GeneSigDB. In this graph, each vertex represents a
gene set in GeneSigDB, and each edge represents an overlap
with Jaccard coefficient greater than or equal to 0.5 between
two gene sets. The “hairball” is the result of a large number
of gene sets with a substantial overlap (≥ 0.5) with each
other.
Frequency
0 5000 10000 15000
0 50 100 150 200 250 300
f
i
Figure 8: A frequency plot for f
i
values in GeneSetDB il-
lustrates the prevalence of gene set overlap. For each gene
set G
i
in a gene set database G (GeneSetDB here), f
i
is the
number of gene sets G
j
( j 6= i) in G with a non-zero overlap
with G
i
.
BIOINFORMATICS 2019 - 10th International Conference on Bioinformatics Models, Methods and Algorithms
192
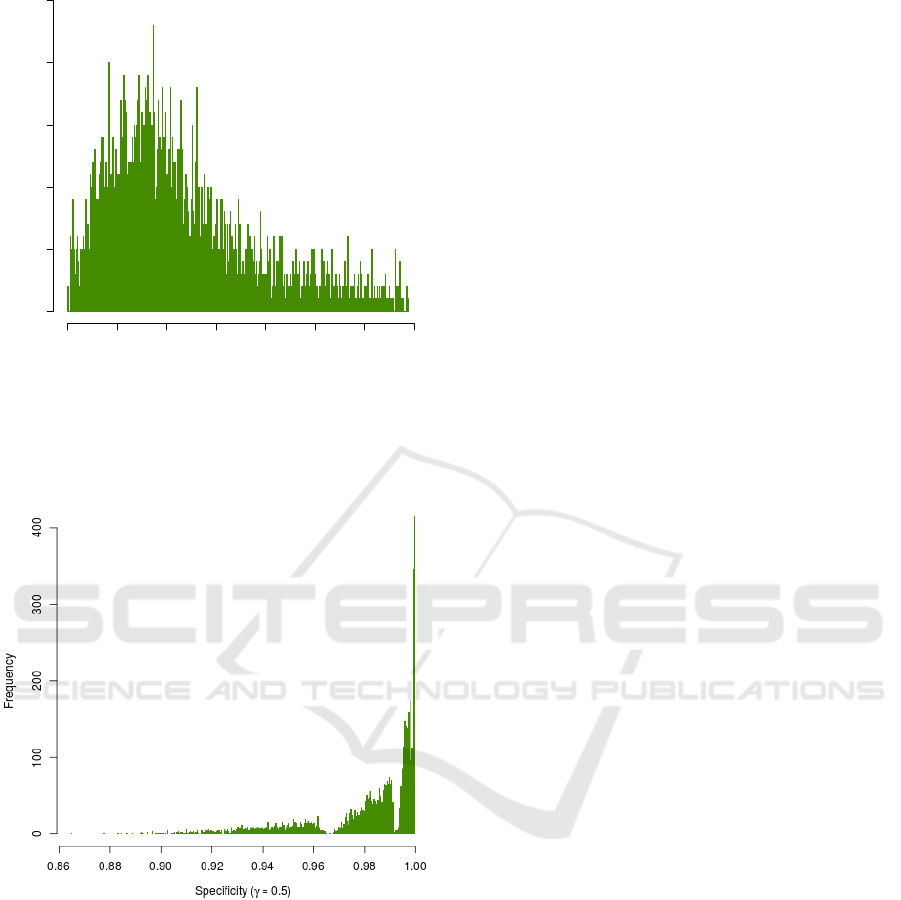
Frequency
0 500 1000 1500 2000 2500 3000 3500
0 5 10 15 20 25
f
i
Figure 9: A frequency plot for f
i
values in GeneSigDB il-
lustrates the prevalence of gene set overlap. For each gene
set G
i
in a gene set database G (GeneSigDB here), f
i
is the
number of gene sets G
j
( j 6= i) in G with a non-zero overlap
with G
i
.
Figure 10: The histogram of the specificity values (γ = 0.5).
Obvious deviation of the histogram from a bell-shaped
curve suggests that the specificity values are not normally
distributed. A similar pattern was observed for other values
of γ.
Gene Set Overlap: An Impediment to Achieving High Specificity in Over-representation Analysis
193
