
Polyp Shape Recovery using Vascular Border from Single Colonoscopy
Image
Hiroyasu Usami
1
, Yuji Iwahori
1
, M. K. Bhuyan
2
, Aili Wang
3
, Naotaka Ogasawara
4
and Kunio Kasugai
4
1
Department of Computer Science, Chubu University, Kasugai, Japan
2
Department of Electronics and Electrical Engineering, Indian Institute of Technology Guwahati, Guwahati, India
3
Higher Education Key Lab., Harbin University of Science and Technology, Harbin, China
4
Department of Gastroenterology, Aichi Medical University, Nagakute, Japan
{nogasa, kuku3487}@aichi-med-u.ac.jp
Keywords:
Shape from Shading, Lambertian Surface, Specular Removal, U-net, RANSAC, Colonoscopy.
Abstract:
The shape and size of a colonic polyp is a biomarker that correlates with its risk of malignancy and guides its
clinical management. It is the most accurate method for detecting polyps of all sizes, and it allows biopsy of
lesions and resection of most polyps, and it is considered nowadays as the gold standard for colon screening.
However, there are still open challenges to overcome, such as the reduction of the missing rate. Colonoscopy
images usually consist of nonrigid objects such as a polyp, and no approaches have been proposed to recovery
shape and absolute size from a single image. Hence, it is a challenging topic to reconstruct polyp shape using
computer vision technique. This paper proposes a polyp shape retrieval method based on Shape from Shading
(SFS), and this research contributes to mitigating constraint for applying SFS to the single colonoscopy image
using vascular border information. Experiments confirmed that the proposed method recovered approximate
polyp shapes.
1 INTRODUCTION
A polyp guideline for the diagnosis, treatment,
and surveillance for patients with colorectal polyps
published originally in 1993(Bond, 1993), and it
has been developing following evidence-based(Force,
1989)(Winawer et al., 1997)(Byers et al., 1997). The
guideline indicates that the shape and size of a colo-
nic polyp is a biomarker that correlates with its risk of
malignancy and guides its clinical management.
Endoscopy images usually consist of nonrigid ob-
jects such as a polyp so that applying photoclinometry
based recovery approach is reasonable for the issue
mentioned earlier. Shape from Shading (SFS)(Horn,
1989) is as one valuable approach based on photocli-
nometry. SFS uses the intensity of images directly to
reconstruct the target object surface orientation from
a single image. Some approaches (Iwahori et al.,
2015)(Wu et al., 2010) reconstructed 3D shape from
colonoscopy image based on SFS. The paper(Iwahori
et al., 2015) proposed a polyp recovery approach
using both photometric and geometric constraints as-
suming one light source colonoscopy. Another ap-
proach(Usami et al., 2016) reconstructed polyp shape
considering more actual colonoscopy, which has two
light sources, and it used a neural network to modify
the obtained surface gradients. In case of besides tar-
geting polyp, the paper (Wu et al., 2010) proposed a
3D shape recovery method for an artificial spine.
SFS and colonoscopy image are compatible on the
first sight, but there are constraints for applying SFS
to colonoscopy image. Those approaches need some
parameters like a depth Z from colonoscopy lens to
the surface, and surface reflectance coefficient C Furt-
hermore, those approaches assume the whole surface
which has same the C and the Lambertian surface.
This research contributes mitigating constraint for ap-
plying SFS to the colonoscopy regardless of genera-
ting Lambertian image processing based on vascula-
ture structure and its border. The outline of this pa-
per is as follows. Firstly, an assumed observation sy-
stem and photometric constraints are introduced. In
the next, preprocessing and approaches which obtai-
ning parameters using vascular are described for po-
lyp shape retrieval. In the experiment, evaluation is
conducted using actual colonoscopy images. Finally,
104
Usami, H., Iwahori, Y., Bhuyan, M., Wang, A., Ogasawara, N. and Kasugai, K.
Polyp Shape Recovery using Vascular Border from Single Colonoscopy Image.
DOI: 10.5220/0007379101040111
In Proceedings of the 12th International Joint Conference on Biomedical Engineering Systems and Technologies (BIOSTEC 2019), pages 104-111
ISBN: 978-989-758-353-7
Copyright
c
2019 by SCITEPRESS – Science and Technology Publications, Lda. All rights reserved

conclude the proposed approach and discuss future
works in conclusion.
2 ALGORITHM
The proposed approach assumes an observation sy-
stem of two light source colonoscopy for polyp shape
recovery, and consists of following steps.
Step0. Assume an observation system of two light
source colonoscopy.
Step1. Estimate the camera parameters by con-
ducting camera calibration.
Step2. Conduct specular highlight removal.
Step3. Conduct blood vessel extraction using U-net.
Step4. Obtain depth Z and reflectance coefficient
C of blood vessels by estimating its horizontal
plane, and using its geometric structure.
Step5. Obtain depth Z and reflectance coefficient
C of intestinal-inner-walls using borders between
blood vessels and optimization.
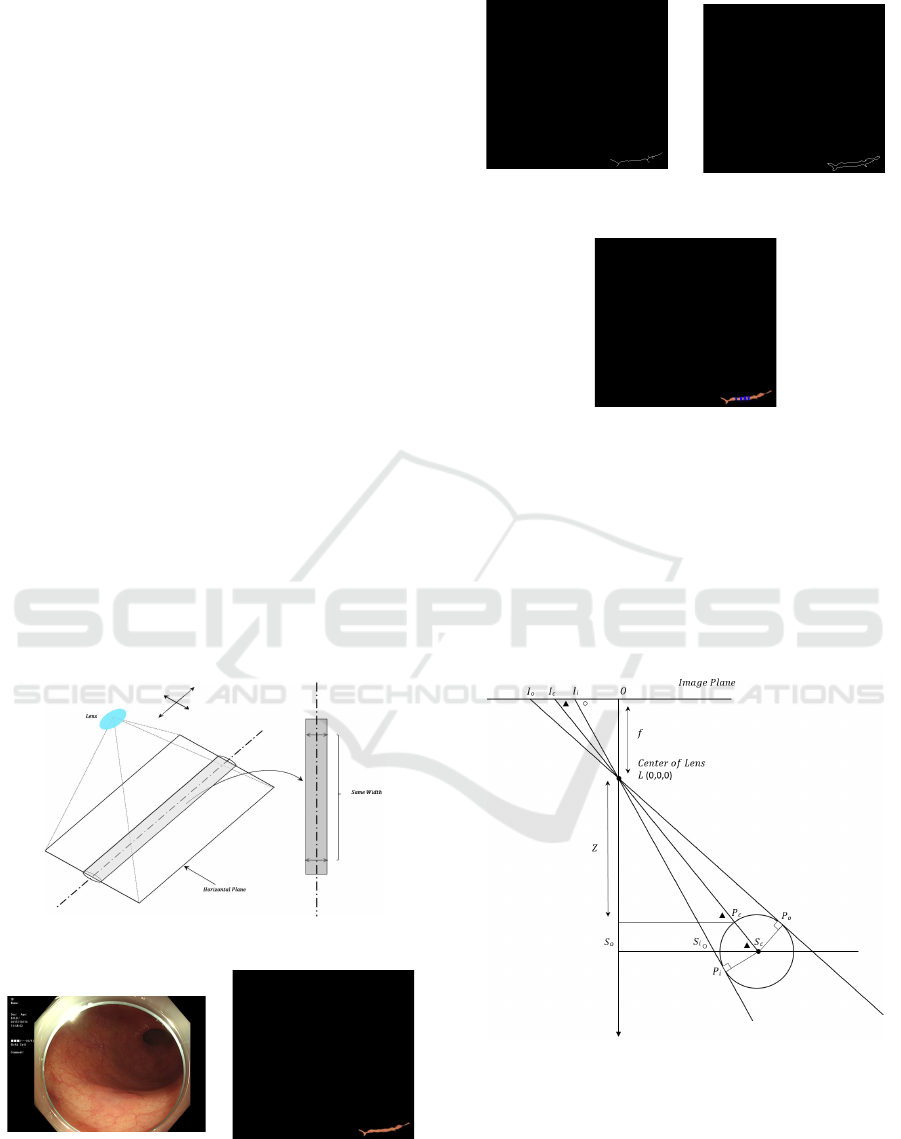
2.1 Observation System of Two Light
Source Colonoscopy
The observation system of the colonoscopy is assu-
med to be a point light source and perspective pro-
jection. According to the actual environment of the
colonoscopy, two light point sources are assumed as
shown in Fig.1.
Figure 1: Observation System of Two Light Sources En-
doscope.
Here, let the coordinate of the center of the lens
be (0,0,0), let both light source coordinate be s
1
=
(a, b, 0) and s
2
= (c, d, 0), let f be focal length, let
each distance from light source to surface be l
1
and
l
2
. Let n be the normal surface vector. Image intensity
E and reflectance coefficient C can be denoted Eq.(1)
following illuminance inverse square law.
E = C(
n · s
1
l
2
1
+
n · s
2
l
2
2
) (1)
Eq.(1) can be denoted using depth Z from the lens
to the surface as following equations. Normal vector
n on arbitrary point of diffuse reflectance surface can
be represented Eq.(2).
n =
(p, q, −1)
p
p
2
+ q
2
+ 1
(2)
Here, let each p, q be surface gradient.
(p, q) = (
∂Z
∂X
,
∂Z
∂Y
) (3)
Let arbitrary surface point be X , Y, Z, l
1
and l
2
can
be represented
l
1
=
q
(a − X)
2
+ (b −Y)
2
+ Z
2
(4)
l
2
=
q
(c − X)
2
+ (d −Y )
2
+ Z
2
(5)
Both light source vector s
1
and s
2
on arbitrary
point of diffuse reflectance surface can be denoted as
follows.
s
1
=
(a − X, b −Y, −Z)
p
(a − X)
2
+ (b −Y)
2
+ Z
2
(6)
s
2
=
(c − X, d −Y, −Z)
p
(c − X)
2
+ (d −Y )
2
+ Z
2
(7)
World coordinate X, Y are represented by Eq.(8)
X =
x
f
Z, Y =
y
f
Z (8)
Substituting Eq.(2)-Eq.(8) into Eq.(1), E and C
can be denoted using Z as Eq.(9).
E =
C
p
p
2
+ q
2
+ 1
−p(a −
x
f
Z) − q(b −
y
f
Z) + Z
(a −
x
f
Z)
2
+ (b −
y
f
Z)
2
+ Z
2
3
2
+
−p(c −
x
f
Z) − q(d −
y
f
Z) + Z
(c −
x
f
Z)
2
+ (d −
y
f
Z)
2
+ Z
2
3
2
!
(9)
The proposed method reconstructs the 3D shape from
colonoscopy images postulated in the observation
model. This Eq.(9) is used to solve each C of the
blood vessel and the intestinal-inner-wall (Based on
Eq.(16) and Eq.(26)).
Polyp Shape Recovery using Vascular Border from Single Colonoscopy Image
105

2.2 Camera Calibration
Camera parameters of the colonoscopy are estima-
ted. Estimating camera parameters of the colo-
noscopy is performed using multiple images of chec-
kerboard taken by colonoscopy following existing ca-
mera calibration techniques(Zhang, 2000)(Heikkila
and Silv
´
en, 1997). Fig.(2) shows examples of chec-
ker board image which taken by an colonoscopy is as
shown in Fig.(2).
Figure 2: Examples of Checker Board.
Furthermore, positions of two light source on co-
lonoscopy S
1
= (a, b, 0) and S
2
= (c, d, 0) are estima-
ted by conducting optimization for a know sphere ob-
ject image taken by the colonoscopy.
2.3 Specular Highlight Removal
The spectral energy distribution of the light reflected
from the surface can be denoted as the product of the
spectral energy distribution of the illumination and
the surface reflectance. Following the dichromatic re-
flection model (Shafer, 1985), the reflected light can
be separated into two components specular and dif-
fuse reflection. Specular components affect the result
of shape recovery under SFS approach and, frequently
arise on the colonoscopy image. The paper (Tchou-
lack et al., 2008) proposed the specular components
removal method on colonoscopy image by conducting
the in-painting process to specular components. Mo-
dified region by in-painting process lacks the surface
information.
The diffuse color component has a characteris-
tic that the maximum fraction of the diffuse color
component in diffuse local patches in color images
changes smoothly. Hence specular components can
be removed by following this characteristic. Furt-
hermore, the proposed approach obtains depth Z and
reflectance coefficient C based using the border bet-
ween blood vessels and intestinal-inner-walls. Specu-
lar components removal process should be done wit-
hout removing the border between blood vessel and
intestinal-inner-walls since the border information is
used when reflectance coefficient C is estimated sepa-
rately at each region around the border. The propo-
sed approach removes specular components introdu-
cing bilateral filter based on the method(Yang et al.,
2010)(Yang et al., 2015).
2.4 Blood Vessel Segmentation
The proposed approach obtains depth Z and reflec-
tance coefficient C using blood vessel information.
As segmentation methods, some methods were propo-
sed (Carreira and Sminchisescu, 2011)(Uijlings et al.,
2013)(Ronneberger et al., 2015). In this case, the de-
sired output should include localization, i.e., a class
label is supposed to be assigned to each pixel, and
segmentation method should be applicable to vascu-
lature structure. This paper proposes a method based
on the U-net architecture(Ronneberger et al., 2015).
The network architecture of the proposed method
is shown in Fig.3. The network architecture was con-
structed with less down sampling layers because the
resolution of the targeted colonoscopy images is not
high.
Figure 3: Network Architecture.
The loss function is the cross-entropy and the neu-
ral network employees the stochastic gradient des-
cent for optimization. The activation function after
each convolutional layer is the Rectifier Linear Unit
(ReLU) and dropout of 0.2 are used between two con-
secutive convolutional layers.
2.5 Obtaining Depth Z and Reflectance
Coefficient C
The parameters Z and C for shape recovery under SFS
approach are obtained by estimating blood vessel ho-
BIOIMAGING 2019 - 6th International Conference on Bioimaging
106
rizontal plane locally with considering a horizontal
plane in the observation system.
2.5.1 Estimation of the Horizontal Plane
The horizontal planes of columnar forms against lens
can be obtained by considering the continuity of
width from columnar centerline to both end of edge.
The columnar width cropped by the horizontal plane
against lens as shown in Fig.4 continues while the
cropped region are horizon against lens. The hori-
zontal planes of blood vessel can be obtained locally
based on this property. The procedure of obtaining
the horizontal plane is as follows.
Here, for the explicit description of the algorithm,
Fig6 to Fig.9 show the procedure using an example of
colonoscopy image with partial blood vessel.
Step1 Extract a blood vessel region in Fig.6 from the
original image in Fig.5.
Step2 Extract centerline of the blood vessel by per-
forming line thinning processing as shown in
Fig.7.
Step3 Extract edge of blood vessel using morpho-
logy operation as shown in Fig.8.
Step4 Draw a line orthogonal to the centerline and
crop the line by both end of edge. Finally, extract
continuous regions where the cropped line has the
same width as shown in Fig.9.
Figure 4: Horizontal Plane of Columnar against lens.
Figure 5: Original Image.
Figure 6: Example of Extrac-
ted Blood Vessel Region.
Figure 7: Example of Line
Thinning Processing.
Figure 8: Example of Edge
Extraction.
Figure 9: Example of Estimation of Horizontal Plane.
2.5.2 Estimation of Blood Vessel Z and C
Fig.10 shows an observation model for obtaining
depth parameter Z of the blood vessel using its ho-
rizontal plane.
The depth Z from the colonoscopy lens can be cal-
culated using the model with respect to the estimated
horizontal plane of the blood vessel. The procedure
for calculating parameter Z is described below.
Figure 10: Observation System of Horizontal Plane.
From 4LOI
i
∼ 4LS
o
S
i
and ∠LS
i
S
o
is an external
angle of 4LS
o
S
i
, ∠LS
i
S
c
can be obtained by Eq.(10).
∠LS
i
S
c
= π − ∠LI
i
O (10)
From 4LOI
c
∼ 4LS
o
S
c
,4LS
c
S
o
can be expressed
from Eq.(11) and Eq.(12).
∠LS
c
S
i
= ∠LI
c
O (11)
Polyp Shape Recovery using Vascular Border from Single Colonoscopy Image
107

∠S
i
LS
c
= π − ∠LS
i
S
c
− ∠LS
c
S
i
(12)
Similarly, ∠L S
c
P
i
can be obtained from Eq.(13).
∠LS
c
P
i
= π −
π
2
− ∠S
i
LS
c
(13)
The hypotenuse from the lens L to the center of
the suture center S
i
in 4LS
c
S
i
, the distance LS
c
can
be obtained from Eq.(14). Here, the distance P
c
S
c
is
the same as the radius of blood vessel.
LS
c
=
P
i
S
c
cos∠LS
c
P
i
(14)
The distance from the lens L to the surface of the
blood vessel P
c
can be obtained from Eq.(15). Here,
P
c
S
c
is the same as the radius of blood vessel.
LP
c
= LS
c
− P
c
S
c
(15)
From 4LZP
c
∼ 4LOI
c
, the depth Z can be obtai-
ned from Eq.(16).
Z = LP
c
sin∠LI
c
O (16)
Here, each surface gradient parameter p, q is
obtained stand for the xz plane and the yz plane re-
spectively. The gradient surface parameter p is obtai-
ned from a gradient of orthogonal line to the line pas-
sing L = (0, 0) and P
c
= (
x
I
c
f
Z, Z) on the xz plane. The
gradient of the line passing L and P
c
is obtained from
Eq.(17)
Z
x
I
c
f
Z
=
f
x
I
c
(17)
The surface gradient p can be obtained from the ort-
hogonal line to the obtained gradient from Eq.(17) as
shown in Eq.(18)
p = −
x
I
c
f
(18)
The gradient surface parameter q is obtained from
a gradient of orthogonal line to the line passing L =
(0, 0) and P
c
= (
y
I
c
f
Z, Z) on the yz plane. The gradient
of the line passing L and P
c
is obtained from Eq.(19)
Z
y
I
c
f
Z
=
f
y
I
c
(19)
The surface gradient q can be obtained from the ort-
hogonal line to the obtained gradient from Eq.(19) as
shown in Eq.(20)
q = −
y
I
c
f
(20)
Finally, substituting obtained Z, p, q and image
intensity E to Eq.(9), C of the blood vessel is obtai-
ned. Here, horizontal plane sections where the same
width continues more than 6 tracing the center line of
medical suture were adapted as horizontal plane secti-
ons, and calculate MEAN and STD of both Z and C
for each section, then, C is selected by the following
process. C is confirmed in order from the section
where the continuous section of the same width re-
gion is long and Z with less STD is obtained, and
MEDIAN of C, where the outlier value is not obtai-
ned and with the low value of STD, is selected, and
Smirnov-Grubbs test(Grubbs et al., 1950) was used
for outliers.
2.5.3 Estimation of Intestinal-inner-wall Z and C
Assuming the blood vessel and the intestinal-inner-
wall have continuous surface, intestinal-inner-wall
parameters Z and C are derived by using the boundary
surface as shown in Fig.11.
Figure 11: Boundary Surfaces between Blood Vessel and
Intestinal-Inner-Wall.
Here, the red color in the figure is defined as
a blood vessel region and Known point. Let an
intestinal-inner-wall neighboring the blood vessel be
a Trial point. Let a blood vessel point located x axis
be a Known point K
BL
p
. Let a blood vessel point lo-
cated y axis be a Known point K
BL
q
.
A depth Z of a Trial point Z
t
can be represen-
ted using its surface gradient (p, q) and a Z of Known
point as shown in Eq.(21). Here, ∆X = X
t
− X
k
, ∆Y =
Y
t
−Y
k
.
Z
t
= Z
k
+ p∆X + q∆Y (21)
Each ∆X, ∆Y denotes a distance of x axis and y
axis respectively on the world coordinate system per-
spective projection as shown in Eq.(22).
Z
t
= Z
k
+ p
x
t
Z
t
f
− x
k
Z
k
f
+ q
y
t
Z
t
f
− y
k
Z
k
f
(22)
Solving Eq.(22) for Z, Eq.(23) can be obtained.
Z
t
1 − px
t
1
f
− qy
t
1
f
= Z
k
1 − px
k
1
f
− qy
k
1
f
(23)
Let Z
t
be Z
expect
, the Z
expect
can be denoted as
shown in Eq.(24)
Z
expect
=
Z
k
( f − px
k
− qy
k
)
f − px
t
− qy
t
(24)
BIOIMAGING 2019 - 6th International Conference on Bioimaging
108
Finally, define f (p, q, a, b, c, d, f , Z) as Eq.(25)
using Eq.(9), the surface reflectance coefficient C
of intestinal-inner-wall is estimated by optimization
using RANSAC (Fischler and Bolles, 1981) and
Eq.(26). Here, let p and q be surface gradient, let
each light source coordinate be a, b, c, d, let f be fo
focal length, let Z be the calculated depth and let E
i
be each real intensity E.
f (p, q, a, b, c, d, f , Z) =
1
p
p
2
+ q
2
+ 1
−p(a −
x
f
Z) − q(b −
y
f
Z) + Z
(a −
x
f
Z)
2
+ (b −
y
f
Z)
2
+ Z
2
3
2
+
−p(c −
x
f
Z) − q(d −
y
f
Z) + Z
(c −
x
f
Z)
2
+ (d −
y
f
Z)
2
+ Z
2
3
2
!
(25)
C
opt
= arg min
C
n
∑
i=1
||E
i
−C f (p, q, a, b, c, d, f , Z)||
(26)
3 EXPERIMENT
3.1 Camera Calibration
The result of camera calibration is shown in Table.1.
The colonoscopy inner parameters as focal length,
principal point and radial distortion were obtained by
performing camera calibration.
Here, two parameters were obtained respectively
because of aspect ratio.
Table 1: Result of Estimation.
Parameter Result of Calibration
Focal length (pixels)
[ 718.7447 + / - 0.8387,
718.3827 + / - 0.8654 ]
Principal point (pixels)
[ 879.0439 + / - 0.4669,
533.5813 + / - 0.4240 ]
Radial distortion
[ - 0.3913 + / - 0.0010,
0.1178 + / - 0.0008 ]
Positions of two light source on colonoscopy were
estimated using sphere object image taken by the co-
lonoscopy. Positions of two light source estimated are
S
1
= (a : −5.001, b : 1.996, 0) and S
2
= (c : 5.001, d :
1.996.0).
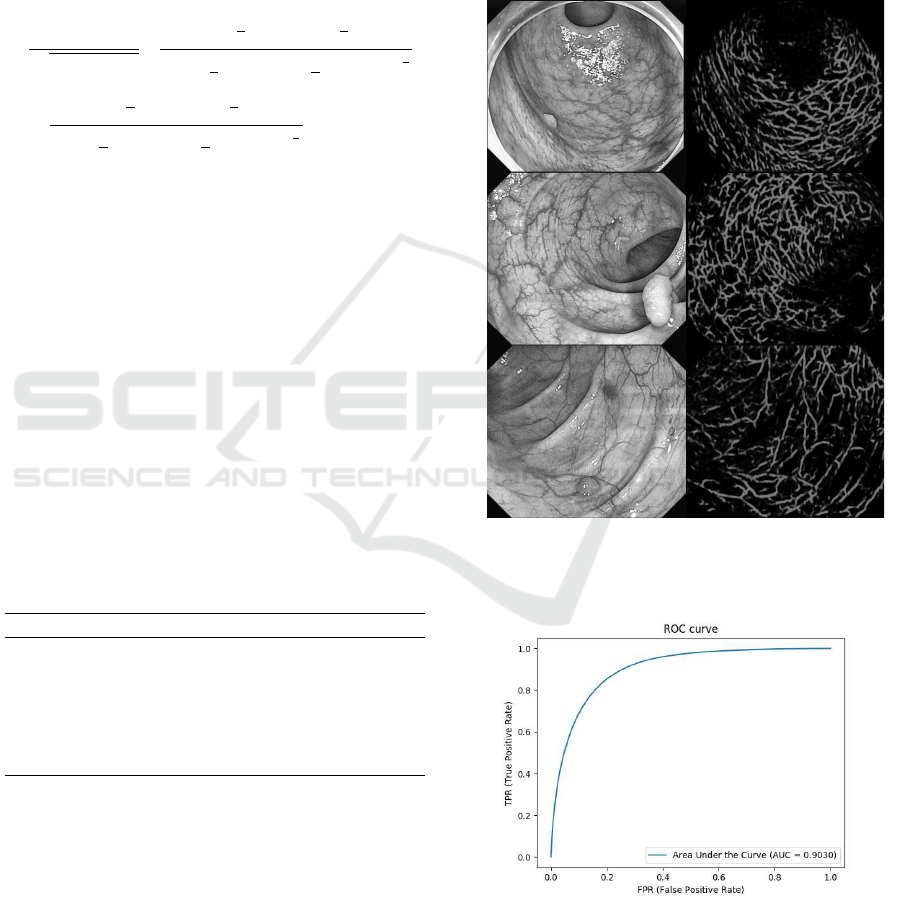
3.2 Blood Vessel Extraction
The vessel probability of each pixel was obtained by
averaging multiple predictions to improve the perfor-
mance. With a stride of 5 pixels in both height and
width, multiple consecutive overlapping patches were
extracted in each test image. Then, the vessel proba-
bility was obtained for each pixel by averaging pro-
babilities over all the predicted patches covering the
pixel.
Evaluation was done using masked images crea-
ted by manual drawing as ground truth. Fig.12 shows
the results of colon blood vessel detection and overall
accuracy of the prediction was 0.8432.
Figure 12: Example of Prediction Results.
Fig.13 shows the Area Under the ROC curve
(AUC ROC) of the evaluation, and AUC was 0.9030.
Figure 13: AUC ROC.
From the result of blood vessel extraction, the pro-
posed method extracted blood vessel region accura-
tely.
Polyp Shape Recovery using Vascular Border from Single Colonoscopy Image
109

3.3 Polyp Shape Reconstruction
Using blood vessel information and obtained parame-
ters, polyp shape recovery was performed. There are
some obstacles like as body part of the colonoscopy
for shape recovery depend on the scene, so that co-
lonoscopy images were cropped for applying the pro-
posed method. Each original colonoscopy image are
shown in Fig.14,18,22, selected regions of blood ves-
sel horizontal plane are shown in Fig.15,19,23, shape
recovery images are shown in Fig.16,20,24 and size
measurement result image are shown in Fig.17,21,25.
Figure 14: Original Image 1. Figure 15: Selected hori-
zontal region for Image 1.
Figure 16: Recovered
Shape for Image 1.
Figure 17: Size Measure-
ment Result in Image 1 af-
ter Extraction.
Figure 18: Original Image 2. Figure 19: Selected hori-
zontal region for Image 2.
Figure 20: Recovered
Shape for Image 2.
Figure 21: Size Measure-
ment Result for Image 2
after Extraction.
Figure 22: Original Image 3. Figure 23: Selected hori-
zontal region for Image 3.
Figure 24: Recovered
Shape for Image 3.
Figure 25: Size Measure-
ment Result for Image 3
after Extraction.
Each C has obtained as 89217, 118153, 23074, re-
spectively. Compared with measured images after ex-
traction and shape recovery result, approximate polyp
shape was reconstructed using blood vessel informa-
tion and obtained parameters.
4 CONCLUSION
This paper proposed a polyp shape recovery met-
hod which mitigated the constraint for applying SFS
to the colonoscopy image based on the vasculature
structure. The proposed approach assumed two light
source endoscope according to the actual environment
for polyp shape retrieval. Parameters for applying
SFS, the camera inner parameters were obtained by
conducted camera calibration, depth Z and reflectance
coefficient C were obtained by estimating vascular
horizontal plane and using its border of neighboring
intestinal-inner-walls. From experiments, it is con-
firmed that the proposed method recovered approx-
imate absolute polyp shape using vascular informa-
tion and obtained parameters from a single endoscope
image. Especially, regardless of generating Lamber-
tian image processing, the proposed method realized
polyp shape recovery from a single endoscope image.
ACKNOWLEDGEMENTS
This research is supported by JSPS Grant-in-Aid for
Scientific Research (C) (17K00252) and Chubu Uni-
versity Grant.
BIOIMAGING 2019 - 6th International Conference on Bioimaging
110

REFERENCES
Bond, J. H. (1993). Polyp guideline: diagnosis, treatment,
and surveillance for patients with nonfamilial colorec-
tal polyps. Annals of internal medicine, 119(8):836–
843.
Byers, T., Levin, B., Rothenberger, D., Dodd, G. D., Smith,
R. A., Detection, A. C. S., and on Colorectal Cancer),
T. A. G. (1997). American cancer society guidelines
for screening and surveillance for early detection of
colorectal polyps and cancer: update 1997. CA: a can-
cer journal for clinicians, 47(3):154–160.
Carreira, J. and Sminchisescu, C. (2011). Cpmc: Automa-
tic object segmentation using constrained parametric
min-cuts. IEEE Transactions on Pattern Analysis &
Machine Intelligence, (7):1312–1328.
Fischler, M. A. and Bolles, R. C. (1981). A paradigm
for model fitting with applications to image analy-
sis and automated cartography (reprinted in readings
in computer vision, ed. ma fischler,”. Comm. ACM,
24(6):381–395.
Force, U. P. S. T. (1989). Guide to clinical preventive servi-
ces: report of the US Preventive Services Task Force.
DIANE publishing.
Grubbs, F. E. et al. (1950). Sample criteria for testing out-
lying observations. The Annals of Mathematical Sta-
tistics, 21(1):27–58.
Heikkila, J. and Silv
´
en, O. (1997). A four-step camera ca-
libration procedure with implicit image correction. In
Computer Vision and Pattern Recognition, 1997. Pro-
ceedings., 1997 IEEE Computer Society Conference
on, pages 1106–1112. IEEE.
Horn, B. K. (1989). Obtaining shape from shading infor-
mation. In Shape from shading, pages 123–171. MIT
press.
Iwahori, Y., Tatematsu, K., Nakamura, T., Fukui, S., Wood-
ham, R. J., and Kasugai, K. (2015). 3d shape recovery
from endoscope image based on both photometric and
geometric constraints. In Knowledge-Based Informa-
tion Systems in Practice, pages 65–80. Springer.
Ronneberger, O., Fischer, P., and Brox, T. (2015). U-net:
Convolutional networks for biomedical image seg-
mentation. In International Conference on Medical
image computing and computer-assisted intervention,
pages 234–241. Springer.
Shafer, S. A. (1985). Using color to separate reflection com-
ponents. Color Research & Application, 10(4):210–
218.
Tchoulack, S., Langlois, J. P., and Cheriet, F. (2008). A vi-
deo stream processor for real-time detection and cor-
rection of specular reflections in endoscopic images.
In Circuits and Systems and TAISA Conference, 2008.
NEWCAS-TAISA 2008. 2008 Joint 6th International
IEEE Northeast Workshop on, pages 49–52. IEEE.
Uijlings, J. R., Van De Sande, K. E., Gevers, T., and Smeul-
ders, A. W. (2013). Selective search for object re-
cognition. International journal of computer vision,
104(2):154–171.
Usami, H., Hanai, Y., Iwahori, Y., and Kasugai, K. (2016).
3d shape recovery of polyp using two light sources
endoscope. In Computer and Information Science
(ICIS), 2016 IEEE/ACIS 15th International Confe-
rence on, pages 1–6. IEEE.
Winawer, S. J., Fletcher, R. H., Miller, L., Godlee, F., Sto-
lar, M., Mulrow, C., Woolf, S., Glick, S., Ganiats, T.,
Bond, J., et al. (1997). Colorectal cancer screening:
clinical guidelines and rationale. Gastroenterology,
112(2):594–642.
Wu, C., Narasimhan, S. G., and Jaramaz, B. (2010). A
multi-image shape-from-shading framework for near-
lighting perspective endoscopes. International Jour-
nal of Computer Vision, 86(2-3):211–228.
Yang, Q., Tang, J., and Ahuja, N. (2015). Efficient and
robust specular highlight removal. IEEE transacti-
ons on pattern analysis and machine intelligence,
37(6):1304–1311.
Yang, Q., Wang, S., and Ahuja, N. (2010). Real-time specu-
lar highlight removal using bilateral filtering. In Eu-
ropean conference on computer vision, pages 87–100.
Springer.
Zhang, Z. (2000). A flexible new technique for camera ca-
libration. IEEE Transactions on pattern analysis and
machine intelligence, 22(11):1330–1334.
Polyp Shape Recovery using Vascular Border from Single Colonoscopy Image
111
