
Prediction of Subnuclear Location for Nuclear Protein
Kenji Satou
1
, Yoshiki Shimaguchi
2
, Kunti Robiatul Mahmudah
2
, Ngoc Giang Nguyen
2
,
Mera Kartika Delimayanti
2,3
, Bedy Purnama
2,4
, Mamoru Kubo
1
,
Makiko Kakikawa
1
and Yoichi Yamada
1
1
Institute of Science and Engineering, Kanazawa University, Kanazawa, Japan
2
Graduate School of Natural Science and Technology, Kanazawa University, Kanazawa, Japan
3
Department of Computer and Informatics Engineering, Politeknik Negeri Jakarta, Jakarta, Indonesia
4
Telkom School of Computing, TELKOM University, Bandung, Indonesia
Keywords: Nuclear Protein, Subnuclear Location, Deep Learning, Feature Selection.
Abstract: To play a biomolecular function, a protein must be transported to a specific location of cell. Also in a
nucleus, a nuclear protein has its own location to fulfil its role. In this study, subnuclear location of nuclear
protein was predicted from protein sequence by using deep learning algorithm. As a dataset for experiments,
319 non-homologous protein sequences with class labels corresponding to 13 classes of subcellular
localization (e.g. "Nuclear envelope") were selected from public databases. In order to achieve better
performance, various combinations of feature generation methods, classification algorithms, parameter
tuning, and feature selection were tested. Among 17 methods for generating features of protein sequences,
Composition/Transition/Distribution (CTD) generated the most effective features. They were further
selected by randomForest package for R. Using the selected features, quite high accuracy (99.91%) was
achieved by a deep neural network with seven hidden layers, maxout activation function, and RMSprop
optimization algorithm.
1 INTRODUCTION
Protein is one of the most important biomolecule.
Transcribed from genes and translated from
mRNAs, proteins play various and essential roles at
everywhere in a living body of all organisms. To
play a biomolecular function, a protein must have a
specific sequence and structure. In addition, after the
synthesis of it, it must be transported to a specific
location of cell. For example, receptor proteins must
be located at cell surface to capture small molecules
for sensing the environment of the cell. It means that
the location at which a protein works can be an
important clue to guess the function of protein.
It is possible to experimentally identify the
subcellular location of a protein. However, since it is
time-consuming and requires high cost, prediction of
protein’s subcellular location by computer has been
actively studied and various prediction systems have
been developed (e.g. SignalP (Thomas et al., 2011),
TargetP (Emanuelsson et al., 2000), CELLO (Yu et
al., 2004), LOCTree (Goldberg et al., 2014), and
WOLF PSORT (Horton et al., 2007)). On the other
hand, subnuclear localization of protein is recently
studied as a harder problem of prediction.
In this study, we tried to solve this problem by
using deep learning algorithm, which is recently
attracting really high attention because of its
prominently high performance in various prediction
problems including image recognition, etc. For
comparison, we also used Support Vector Machine
(SVM) and a feature selection method based on the
importance of feature calculated by random forest
algorithm.
In Section 2, brief introduction about deep
learning is shown. In addition, the databases, feature
generation methods, implementation of classifier,
feature selection, and performance evaluation
methods are described. In Section 3, experiments
and results are described. Finally, Section 4
concludes this paper.
2 MATERIALS AND METHODS
2.1 Deep Learning
Among various models of deep learning, we used
276
Satou, K., Shimaguchi, Y., Mahmudah, K., Nguyen, N., Delimayanti, M., Purnama, B., Kubo, M., Kakikawa, M. and Yamada, Y.
Prediction of Subnuclear Location for Nuclear Protein.
DOI: 10.5220/0007570502760280
In Proceedings of the 12th International Joint Conference on Biomedical Engineering Systems and Technologies (BIOSTEC 2019), pages 276-280
ISBN: 978-989-758-353-7
Copyright
c
2019 by SCITEPRESS – Science and Technology Publications, Lda. All rights reserved

Deep Neural Network (DNN) in this study. It is a
multilayer neural network, which improves its
representational power by combining features
extracted in each layer. It can suffer from a local
minimum and overfitting. However, the use of new
activation functions like ReLU and adopting dropout
to avoid overfitting, can provide high performance
in classification problems by DNN.
2.2 Dataset
In this study, we used annotated human nuclear
protein databases described in Goldberg’s thesis
(Goldberg, 2016). Among them, we downloaded
HPRD (Prasad et al., 2009), NMPdb (Mika and
Rost, 2005), NPD (Dellaire et al., 2003), and
UniProt (The UniProt Consortium, 2017). Since we
could not access to NOPdb and NSort/D, we did not
use them. These databases contain 4,111 sequences
in FASTA format. To eliminate homologous
sequences, we used UniqueProt software (Mika and
Rost, 2003). Using the condition HVAL<0, 319
samples (protein sequences) were selected. The
breakdown list of the sequences is shown in Table 1.
Among the 13 classes of subcellular location, the
largest class (Nucleolus) contains 117 samples. In
contrast, only three samples belong to the smallest
class (Nuclear pore complex). It means that the data
used in this study are highly class-imbalanced. It is
well known that for class-imbalanced data, a
classifier tends to frequently predict the label of
majority class, then the performance of classification
is decreased by the class imbalance.
Table 1: The number of samples in each subcellular
location.
Subcellular location the number of samples
Cajal bodies 11
Chromatin 66
Nuclear envelope 45
Nuclear lamina 14
Nuclear matrix 47
Nuclear pore complex 3
Nuclear speckles 30
Nucleolus 117
Nucleoplasm 16
Perinucleolar compartment 4
PML bodies 7
Kinetochore 5
Spindle apparatus 26
In the field of machine learning, a sample is
typically represented as a tuple of numerical values
called a feature vector so that it can be accepted by
the algorithms of regression, classification, and
clustering. In the case of protein sequence
classification, there exist some popular methods of
calculating such feature values. Using protr package
for R (Xiao et al., 2015) in addition to PROFEAT
web service (Li et al., 2006), we executed the
following 17 methods and generated the features that
characterize the human nuclear protein sequences
above.
Amino Acid Composition Descriptor(AAC)
Dipeptide Composition Descriptor(DC)
Tripeptide Composition Descriptor(TC)
AminoAcid/Dipeptide/Tripeptide(ADT)
Normalized Moreau-Broto autocorrelation
descriptors (MoreauBroto)
Moran autocorrelation descriptors(Moran)
Geary autocorrelation descriptors(Geary)
Composition(CTDC)
Transition(CTDT)
Distribution(CTDD)
Conjoint Triad Descriptors(CTriad)
Sequence-order-coupling number(SOCN)
Quasi-sequence-order descriptors(QSO)
Pseudo-Amino Acid Composition(PAAC)
Amphiphilic Pseudo-Amino Acid Composition
(APAAC)
Composition/Transition/Distribution(CTD)
Total amino acid properties(TAAP)
2.3 Prediction and Performance
Evaluation
In the experiment, we used Chainer (Tokui et al.,
2015), a deep learning framework based on Python,
for the implementation of classifier. For the purpose
of comparison, we also implemented SVM using
scikit-learn, a popular library of machine learning
functions on Python. To validate the performance of
a model trained by a classifier, we used two methods
of performance evaluation: leave-one-out cross-
validation and nested cross-validation.
Leave-one-out cross-validation divides dataset
into minimum parts (i.e. one part consists of one
sample). All parts except one for test are merged and
used for training, then the performance (accuracy, in
this study) is evaluated by using the test set with
only one sample. After repeating this process the
same number of times as the number of all samples
(i.e. 319 times), final performance is calculated.
In nested cross-validation (double cross-
validation or stratified cross-validation), each
training set of cross-validation is further cross-
validated mainly for tuning some parameters of a
classifier. In this experiment, we adopted 3-fold and
Prediction of Subnuclear Location for Nuclear Protein
277
10-fold for outer and inner cross-validations (i.e.
each training data of 3-fold cross-validation was
further cross-validated with 10-fold). Through the
inner 10-fold cross-validation, parameters were
optimized for the best performance, then the model
trained with the optimized parameters was tested in
one of the three validations in the outer 3-fold cross-
validation.
To conduct feature selection for better
performance, we used randomForest package for R
with default parameters (e.g. the number of trees
was set to 500). Depending on the importance of
features calculated by randomForest function, we
conducted grid search with the intervals of 50, 10,
and 1 features. After this process, probably the best
set of features is selected for the highest accuracy in
the classification of subcellular location.
3 RESULTS
3.1 Comparison of Feature Generation
Methods
To compare 17 methods of feature generation listed
in the previous section, we conducted performance
evaluation of deep learning and SVM for each
method. The parameters for deep learning were as
follows:
the number of hidden layers: 2
the number of units in the hidden layers:
(50,50)
activation function: sigmoid
optimization algorithm: Adam
batch size: 75
the number of training epochs: 100
dropout: not used
Note that these parameters were not optimized in
this experiment. For SVM, we used the default
parameters.
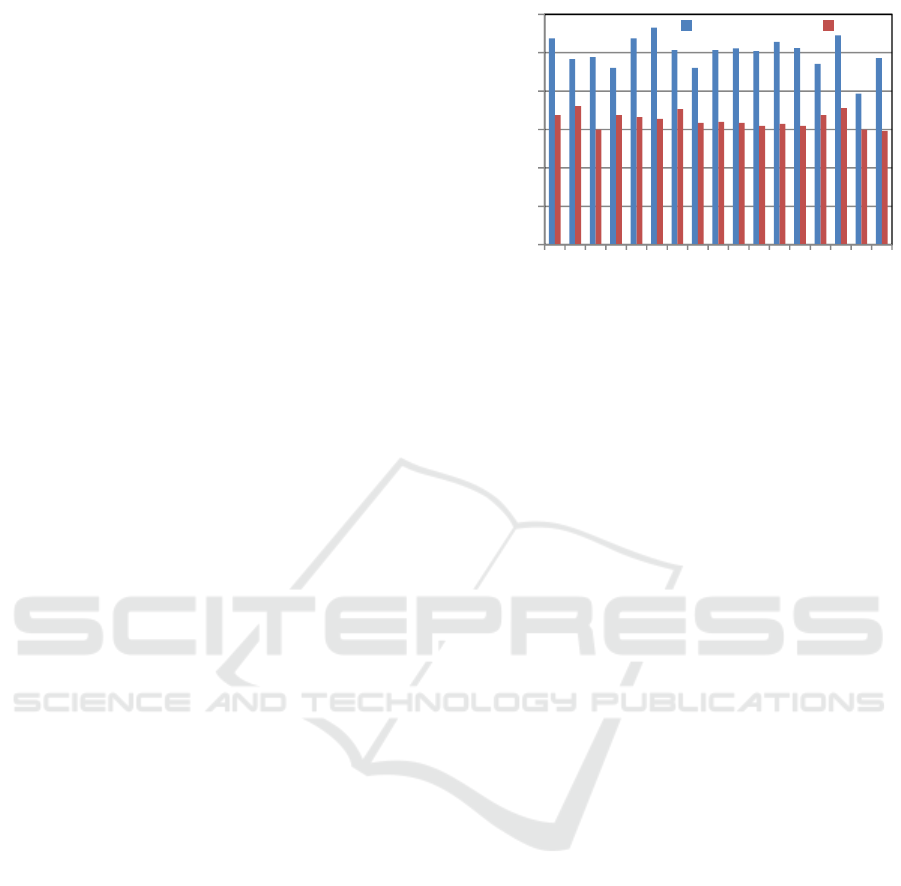
The results of performance evaluation are shown
in Figure 1. From this figure, we can clearly see that
the performance of deep learning is better than
SVM, and CTD is the best method of feature
generation for deep learning. Based on this result,
we mainly used the combination of deep learning
and features generated by CTD in the experiments
below.
Figure 1: Accuracy of classification using the features
generated by each method.
3.2 Evaluation of Deep Learning by
Leave-one-out Cross-validation
Using the features generated by CTD, we optimized
the parameters of deep learning and achieved the
accuracy of 99.14% with the following parameters.
the number of hidden layers: 7
the number of units in the hidden layers:
(3200,1600,800,400,200,100,50)
activation function: maxout
optimization algorithm: RMSprop
batch size: 385
the number of training epochs: 100
dropout: 0% for input layer, 80% for hidden
layers
In addition, by selecting the most important 480
features, the accuracy was increased to 99.91%.
3.3 Evaluation of Deep Learning by
Nested Cross-validation
In case of the performance evaluation of deep
learning by nested cross-validation, the accuracy
before parameter tuning was 22.61%. The
parameters were as follows:
the number of hidden layers: 2
the number of units in the hidden layers:
(100,50)
activation function: maxout
optimization algorithm: Adam
batch size: 250
the number of training epochs: 100
0
10
20
30
40
50
60
AAC
TAAP(PROFEAT)
ADT
APAAC
CTriad
CTD(PROFEAT)
CTDC
CTDD
CTDT
DC
Geary
MoreauBroto
Moran
PAAC
QSO
SOCN
TC
accuracy (%)
deep learning SVM
BIOINFORMATICS 2019 - 10th International Conference on Bioinformatics Models, Methods and Algorithms
278
dropout: 0% for input layer, 80% for hidden
layers
After the feature selection and the parameter tuning
by nested cross-validation, the accuracy was
increased to 34.41% with the following sets of
parameters (different in three training set of outer 3-
fold cross-validation).
[training set 1]
the number of hidden layers: 6
the number of units in the hidden layers:
(50,50,50,50,50,50)
activation function: sigmoid
optimization algorithm: NesterovAG
batch size: 250
the number of training epochs: 500
dropout: 20% for input layer, 30% for hidden
layers
[training set 2]
the number of hidden layers: 2
the number of units in the hidden layers:
(350,50)
activation function: maxout
optimization algorithm: SMORMS3
batch size: 250
the number of training epochs: 500
dropout: 0% for input layer, 10% for hidden
layers
[training set 3]
the number of hidden layers: 2
the number of units in the hidden layers:
(500,50)
activation function: maxout
optimization algorithm: SMORMS3
batch size: 250
the number of training epochs: 500
dropout: 0% for input layer, 10% for hidden
layers
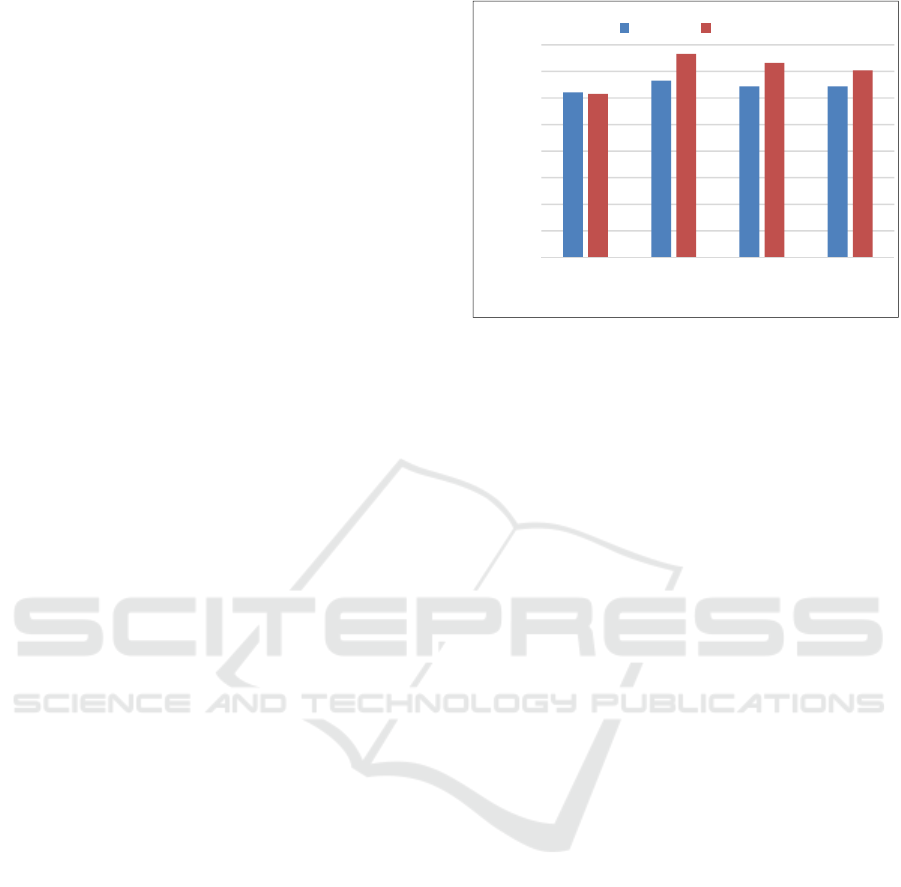
In addition, by the application of feature selection,
the accuracy was increased to 35.23% (Figure 2)
with the number of features 52, 310, and 150 for
training sets 1, 2, and 3, respectively.
In these results, the achieved best performance
(35.23%) was not satisfactory, and the optimized
parameters were widely distributed depending on the
training set. The reason might be that for only 319
samples, 3-fold cross-validation was so hard (i.e. the
number of training sample was too small in
comparison with leave-one-out cross validation) to
achieve a good accuracy.
Figure 2: Accuracy of classification evaluated by nested
cross-validation.
4 CONCLUSIONS
Similar to a related work by Goldberg (Goldberg,
2016), we downloaded databases (HPRD, NMPdb,
NPD, Uniprot) to prepare pairs of protein sequence
and subcellular location of it. In addition, we used a
package (protr) of R and a web service (PROFEAT)
to generate various features from protein sequences.
For machine learning and prediction, we used two
packages (chainer and scikit-learn) for deep learning
and SVM. Feature selection is conducted by using
randomForest package of R. Through the
comprehensive experiments with combination of
various parameters for deep learning including
neural network structure, choice of activation
function, batch size etc., quite high accuracy
(99.91%) in a single leave-one-out cross-validation
was achieved by deep learning with feature
selection. It was clearly higher than the accuracy by
SVM with feature selection. About the selected
features, QSO were also effective for higher
accuracy. As a future work, we are considering to
incorporate more features to achieve a better
performance.
ACKNOWLEDGEMENTS
In this research, the super-computing resource was
provided by Human Genome Center, the Institute of
Medical Science, the University of Tokyo.
Additional computation time was provided by the
super computer system in Research Organization of
Information and Systems (ROIS), National Institute
0
5
10
15
20
25
30
35
40
training set
1
training set
2
training set
3
average
accuracy (%)
10-fold 3-fold
Prediction of Subnuclear Location for Nuclear Protein
279

of Genetics (NIG). This work was supported by
JSPS KAKENHI Grant Number JP18K11525.
REFERENCES
Thomas Nordahl Petersen, Søren Brunak, Gunnar von
Heijne and Henrik Nielsen, 2011. SignalP 4.0:
discriminating signal peptides from transmembrane
regions, Nature Methods, 8:785-786.
Emanuelsson, O., Nielsen, H., Brunak, S. and von Heijne,
G., 2000. Predicting subcellular localization of
proteins based on their N-terminal amino acid
sequence. Journal of molecular biology 300, 1005–
1016.
Yu C.S., Lin C.J., and Hwang J.K., 2004. Predicting
subcellular localization of proteins for Gram-negative
bacteria by support vector machines based on n-
peptide compositions. Protein Science, 13:1402-1406.
Goldberg, T., et al., 2014. LocTree3 prediction of
localization. Nucleic Acids Research, 42, W350–
W355.
Horton, P. et al., 2007. WoLF PSORT: protein localization
predictor. Nucleic Acids Research, 35, W585–587.
Goldberg, T., 2016. Next Generation Machine Learning
Prediction of Protein Cellular Sorting. Doctor thesis in
Technische Universität München.
Prasad, T. S. K. et al., 2009. Human Protein Reference
Database - 2009 Update. Nucleic Acids Research. 37,
D767-72.
Mika, S. & Rost, B., 2005. NMPdb: database of nuclear
matrix proteins. Nucleic Acids Research, 33, D160–
D163.
Dellaire,G., Farrall,R. and Bickmore,W.A., 2003. The
Nuclear Protein Database (NPD): sub-nuclear
localisation and functional annotation of the nuclear
proteome. Nucleic Acids Research, 31, 328–330.
The UniProt Consortium, 2017. UniProt: the universal
protein knowledgebase, Nucleic Acids Research, 45:
D158-D169.
Mika, S., Rost, B., 2003. UniqueProt: creating
representative protein sequence sets. Nucleic Acids
Research, vol. 31 (pg. 3789-3791).
Xiao, N. et al., 2015. protr/ProtrWeb: R package and web
server for generating various numerical representation
schemes of protein sequences. Bioinformatics, 31,
1857–1859.
Li, Z.R., et al., 2006. PROFEAT: a web server for
computing structural and physicochemical features of
proteins and peptides from amino acid sequence.
Nucleic Acids Research, vol. 34 (pg. W32-W37).
Tokui, S., Oono, K., Hido, S., and Clayton, J., 2015.
Chainer: a next-generation open source framework for
deep learning. In Proceedings of Workshop on
Machine Learning Systems (LearningSys) in The
Twenty-ninth Annual Conference on Neural
Information Processing Systems (NIPS), 6 pages.
BIOINFORMATICS 2019 - 10th International Conference on Bioinformatics Models, Methods and Algorithms
280
