
Acceleration Data Structures for Ray Tracing on Mobile Devices
Nuno Sousa
1
, David Sena
2
, Nikolaos Papadopoulos
2
and Jo
˜
ao Pereira
1
1
Instituto Superior T
´
ecnico/Inesc-ID, Universidade de Lisboa, Lisboa, Portugal
2
Samsung R&D UK, Staines, U.K.
Keywords:
Ray Tracing, Acceleration Structures, Mobile Environment, Android, OpenGL ES.
Abstract:
Mobile devices are continuously becoming more efficient at performing computationally expensive tasks,
such as ray tracing. A lot of research effort has been put into using acceleration data structures to minimize
the computational cost of ray tracing and optimize the use of GPU resources. However, with the vast majority
of research focusing on desktop GPUs, there is a lack of data regarding how such optimizations scale on
mobile architectures where there are a different set of challenges and limitations. Our work bridges the gap
by providing a performance analysis of not only ray tracing as a whole, but also of different data structures
and techniques. We implemented and profiled the performance of multiple acceleration data structures across
different instrumentation tools using a set of representative test scenes. Our investigation concludes that a
hybrid rendering approach is more suitable for current mobile environments, with greater performance benefits
observed when using data structures that focus on reducing memory bandwidth and ALU usage.
1 INTRODUCTION
The hardware of mobile devices has improved signif-
icantly over the past few years. There are, however,
limitations, and developers are always searching for
optimizations that allow them to make the best use of
available hardware. Nevertheless, today a mobile de-
vice is capable of rendering graphically intensive ap-
plications with reasonable quality and performance.
Ray tracing is a rendering technique capable of
producing highly realistic results at higher computa-
tional cost than rasterization based approaches. With
the release of technologies like DirectX Raytracing
(DXR), native support for hardware accelerated ray
tracing is starting to become more accessible to an
end user.
The high computational cost of ray tracing can be
reduced with the use of acceleration data structures,
a topic that has been primarily researched for desktop
computers. Our main objective is to present a compar-
ative study of the performance of these data structures
on mobile platforms and document their characteris-
tics.
2 PREVIOUS WORK
The idea of using ray shooting for the generation of
images was first introduced by (Appel, 1968). Sev-
eral other techniques have since been developed that
provide much higher visual fidelity by simulating vi-
sual effects like reflections (Whitted, 1979), soft shad-
ows (Cook et al., 1984), depth-of-field (Cook et al.,
1984) and even global illumination (Kajiya, 1986).
This, however, is outside the scope of our work. The
focus of this research is the performance of accelera-
tion data structures and not the visual fidelity achieved
with different ray tracing techniques.
2.1 Acceleration Data Structures
Acceleration data structures can be used to reduce the
number of ray-primitive intersection tests. An accel-
eration data structure algorithm transforms scene data
to a format that minimizes the number of intersection
tests at runtime and optimizes the use of hardware.
For our research we focused on the traversal per-
formance of KD-Trees and Bounding Volume Hier-
archy (BVH). Both structures make use of Surface
Area Heuristic (SAH) (Goldsmith and Salmon, 1987)
to determine the best splitting point for each node that
is being subdivided.
332
Sousa, N., Sena, D., Papadopoulos, N. and Pereira, J.
Acceleration Data Structures for Ray Tracing on Mobile Devices.
DOI: 10.5220/0007575403320339
In Proceedings of the 14th International Joint Conference on Computer Vision, Imaging and Computer Graphics Theory and Applications (VISIGRAPP 2019), pages 332-339
ISBN: 978-989-758-354-4
Copyright
c
2019 by SCITEPRESS – Science and Technology Publications, Lda. All rights reserved

2.1.1 Bounding Volume Hierarchies
Bounding Volume Hierarchies are based on bound-
ing volumes (Kay and Kajiya, 1986). A BVH is a
tree in which the root consists of a bounding volume
that encloses the whole scene. Each internal node is
a bounding volume of a subset of objects of its par-
ent node. The leaves contain actual geometry to test
against.
The BVH can be subdivided, for example, by us-
ing the median of the centroids of the enclosed objects
or by using SAH.
In this work we chose to focus on the following
traversal algorithms:
• Stack-less Parent-Link Traversal - a link-based al-
gorithm that tries to provide the same traversal
order of the stack based algorithm while being
stack-less (Hapala et al., 2011).
• Restart Trail Traversal - This algorithm tries to
adapt the KD-restart algorithm used to traverse
KD-trees, to be used with Bounding Volume Hi-
erarchies (BVHs) (Laine, 2010).
2.1.2 KD-Trees
First introduced as a method for searching of points
in a k-dimensional space (Bentley, 1975), KD-trees
are a specific case of binary space partitioning Binary
Space Partitioning (BSP).
Just like BVHs spatial subdivision can be based
on SAH. An optimised O(NlogN) construction algo-
rithm introduced by (Wald and Havran, 2006) which
used an ordered event list with special list splitting
rules.
Our work focused on Graphics Processing Unit
(GPU) based algorithms (Hapala and Havran, 2011),
more specifically:
• Kd-Push-Down Traversal - this algorithm expands
Kd-Restart (Horn et al., 2007), which works by
moving a point along the ray and finding the leaf
where the point is located. By keeping the low-
est depth-wise node that contains the interval of
intersection in its entirety, this node can then be
used instead of the root node when restarting the
search.
• Kd-Backtrack Traversal - this algorithm adds to
each node the corresponding bounding box and a
pointer to the parent node (Foley and Sugerman,
2005) to avoid restarting the search from the root
node.
2.2 Mobile Environment
The system on chip architectures of mobile devices
have restrictions on the amount of power they can
draw and, due to the small form factor, the amount
of heat they are able to dissipate. As a result, com-
putational resources are more limited than on desktop
computers.
3 IMPLEMENTATION
This research focuses on mobile environments, run-
ning Android, and was conducted in partnership with
Samsung UK. The following sections will describe
how the application was implemented, which ray trac-
ing algorithms were used as well as which data struc-
tures were implemented. We also describe the differ-
ent rendering approaches used.
3.1 Ray Tracing Implementation
We implemented Whitted ray tracing (Whitted, 1979)
with a ray spawned for each pixel of the framebuffer
and a subsequent ray spawned for each light visibility
query when an intersection is found. We implemented
the ray-triangle intersection algorithm by (M
¨
oller and
Trumbore, 2005) and for Axis Aligned Bounding Box
(AABB) ray intersections we used the ray-box inter-
section algorithm by (Williams et al., 2005).
We implemented different data packing arrange-
ments of primitives using Shader Storage Buffer Ob-
ject (SSBO). Our initial approach was to store
each triangle vertex and each normal as a vec3 with
padding. In our second approach we used the padding
of the three vertices to store the first normal and min-
imize the size per primitive. Our last approach was
based on the fact that, while doing intersection test-
ing, normals are not used. We split the vertices and
normals into separate SSBOs to reduce redundant
memory accesses.
3.2 Implementation of Acceleration
Data Structures
For the GPU rendering methods we chose to imple-
ment only KD-Trees and BVHs instead of Regular
Grids because they are consistently outperformed by
BVHs and KD-Trees apart from very specific situa-
tions (Thrane and Simonsen, 2005).
Acceleration Data Structures for Ray Tracing on Mobile Devices
333
3.2.1 KD-Tree Implementation
The construction of KD-Trees in our implementation
is done using the SAH algorithm (Wald and Havran,
2006). Our implementation allows for the creation
of empty leaf nodes but does not perform triangle
clipping. By experimenting with different values for
C
traversal
and C
intersection
, we concluded that mobile ar-
chitectures tend to favour wider and shallower trees.
We found a value of 3.0 for C
traversal
and 1.5 for
C
intersection
to yield good results.
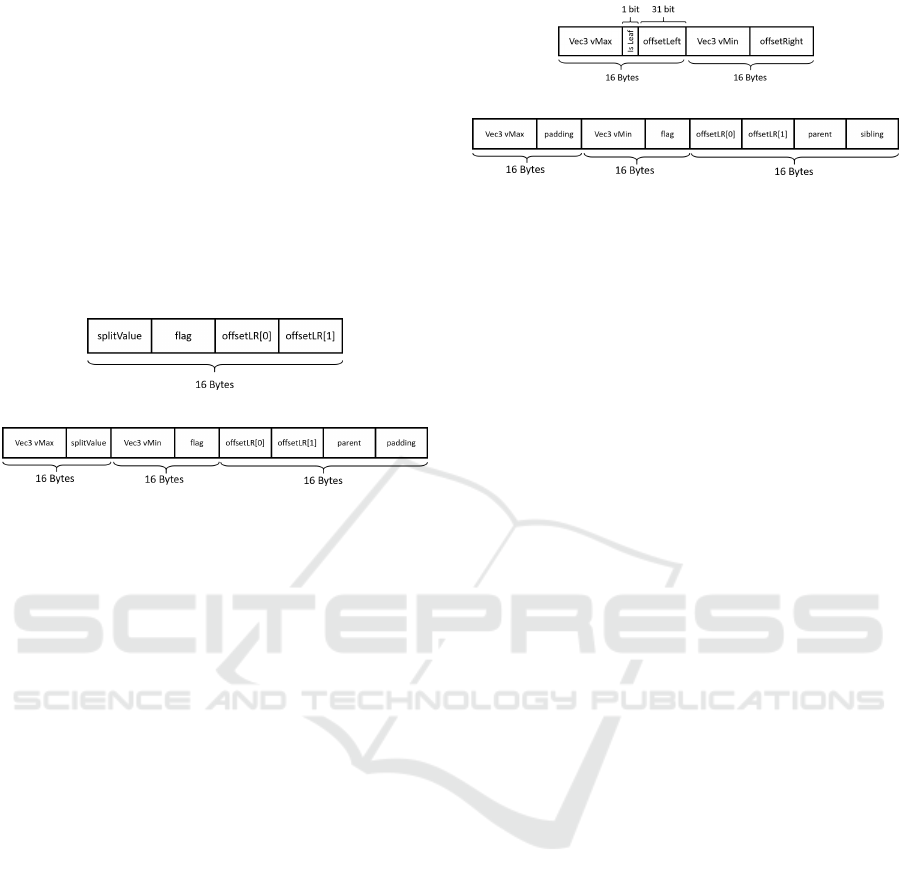
The memory layout for KD-Tree nodes varies ac-
cording to which traversal algorithm is being used.
(a) KD-Pushdown node layout
(b) KD-Backtrack node layout
Figure 1: Layouts of KD-Tree nodes. vMin and vMax rep-
resent the node bounding box.
Another difference between trees for the two
traversal methods is that while building the tree for the
KD-Backtrack traversal method, we do not allow for
perfectly flat nodes, i.e. nodes that have zero length
on one of the axis. This is done to avoid precision
related issues while traversing the tree. We imple-
mented the KD-Pushdown and KD-Backtrack algo-
rithms using the node layouts shown in Figure 1.
3.2.2 BVH Implementation
In our implementation, the construction of BVHs is
done using an altered version of the construction algo-
rithm (Wald and Havran, 2006) that was also used in
the KD-Trees construction. Like with KD-Trees, af-
ter experimenting with several values, we came to the
conclusion that, again, wider, shallower trees tend to
perform best. As such, the values chosen for C
traversal
and C
intersection
were, again, 3.0 and 1.5 respectively.
The memory layout for BVH nodes also varies ac-
cording to which traversal method is being used. The
possible layouts are shown in Figure 2.
For GPU traversal we implemented Trail traversal
along with the Parent-Link traversal algorithm.
3.3 GPU Rendering Methods
Our implementation used multiple rendering ap-
proaches. Regardless of the rendering method cho-
(a) BVH Trail traversal node layout
(b) BVH Parent traversal node layout
Figure 2: Layout of BVH nodes. vMin and vMax represent
the node bounding box.
sen, our implementation starts by constructing the se-
lected acceleration structure along with the auxiliary
structures for primitive storage. These structures are
then copied to GPU memory as Shader Storage Buffer
Objects (SSBOs). The application also creates and
uploads a Vertex Array Object (VAO) containing a
full-screen quad that is then used for every render-
ing method. The drawing process, however, changes
according to which rendering approach is selected:
• Fragment Shaders - the application renders a full-
screen quad using a very simple vertex shader.
The fragment shader is then responsible for ray
tracing the corresponding pixel. In this case, all
the code for ray tracing and structure traversal is
contained in the fragment shader.
• Compute Shaders - the application performs a two
step process. In the first step, the application
dispatches the necessary compute workgroups so
that each thread processes a pixel of the final im-
age. The result of this first step is stored in an
Image Buffer which is then utilized in the second
step as an input texture. The second pass simply
draws a full-screen quad, using the texture gener-
ated in the first step.
• Hybrid Shading - the application, not only cre-
ates a VAO containing the full-screen quad, but
also a second VAO containing the entire geom-
etry for the scene being rendered. This second
VAO is used in the first phase of the rendering pro-
cess, where the application issues a drawcall that
rasterizes all primitives. This first phase stores
the calculated normals into a color attachment.
From this first step a depth buffer is also gener-
ated. These two buffers are then used on the sec-
ond phase of the drawing process where the full-
screen quad is rendered. The values in the buffers
are used to create and cast the shadow ray which
then triggers a structure traversal. For this ren-
dering method, all the ray tracing logic is in the
fragment shader of the second pass.
GRAPP 2019 - 14th International Conference on Computer Graphics Theory and Applications
334
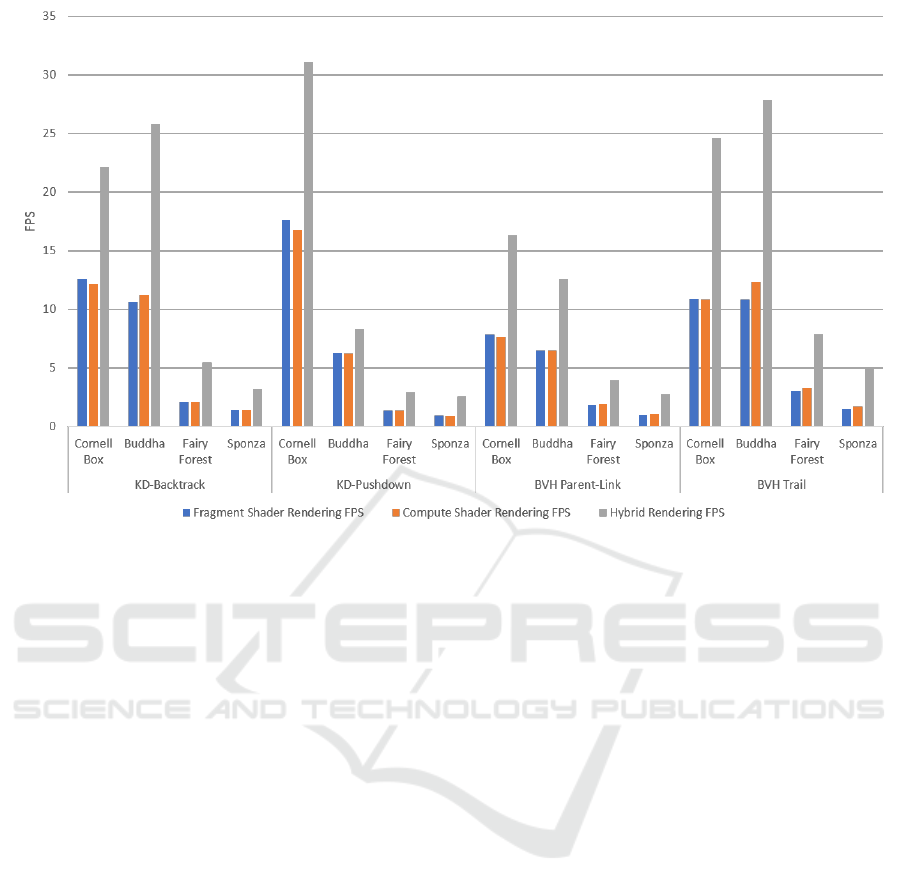
Figure 3: Graph comparing the performance of different rendering methods.
4 EVALUATION
To evaluate the performance of the different algo-
rithms, we profiled our implementation by collect-
ing metrics in app and using external instrumentation
tools.
The application was developed using OpenGL ES
and tested on a Samsung Galaxy S8 (Model SM-
G950U) with a 64 bit Qualcomm Snapdragon 835
system-on-chip with a Qualcomm Adreno 540 GPU
provided by Samsung Research, UK.
4.1 Application Metrics
At the rendering stage, several measurements are col-
lected in order to evaluate overall performance:
• Framerate - How many times the image is updated
per second. Frametime expressed in milliseconds,
while more accurate, is harder to measure on mo-
bile due to hardware and architectural restrictions.
• Rays per Second - expressed in millions of rays
per second. Rays-per-Second (RPS) more accu-
rately describes the raw ray tracing power of the
underlying hardware.
• Structure Size - expressed in KBytes. Repre-
sents the overall size of the generated acceleration
structure.
The application allows to visualize a heatmap rep-
resenting the number of node traversals for each pixel.
As an effort to keep results consistent, we consider
that a node is traversed when it is fetched from the
acceleration structure SSBO.
4.2 External Tools
The Qualcomm Snapdragon Profiler allows develop-
ers to profile devices with Snapdragon processors.
The application provides several metrics of interest to
our work:
• SP Memory Read - Number of bytes read from
memory by the Shader Processors per second.
• % Shader ALU Capacity Utilized - % of maxi-
mum shader ALU capacity that is being utilized.
• % Time ALUs Working - % of time the ALUs are
working while the shaders are busy.
• ALU/Fragment - Average number of ALU in-
structions performed per fragment.
4.3 Test Scenes and Test Methodology
For our tests we used a number of different scenes
such as the Cornell Box, the Cornell Buddha, the
Fairy Forest and the Crytek Sponza.
Acceleration Data Structures for Ray Tracing on Mobile Devices
335
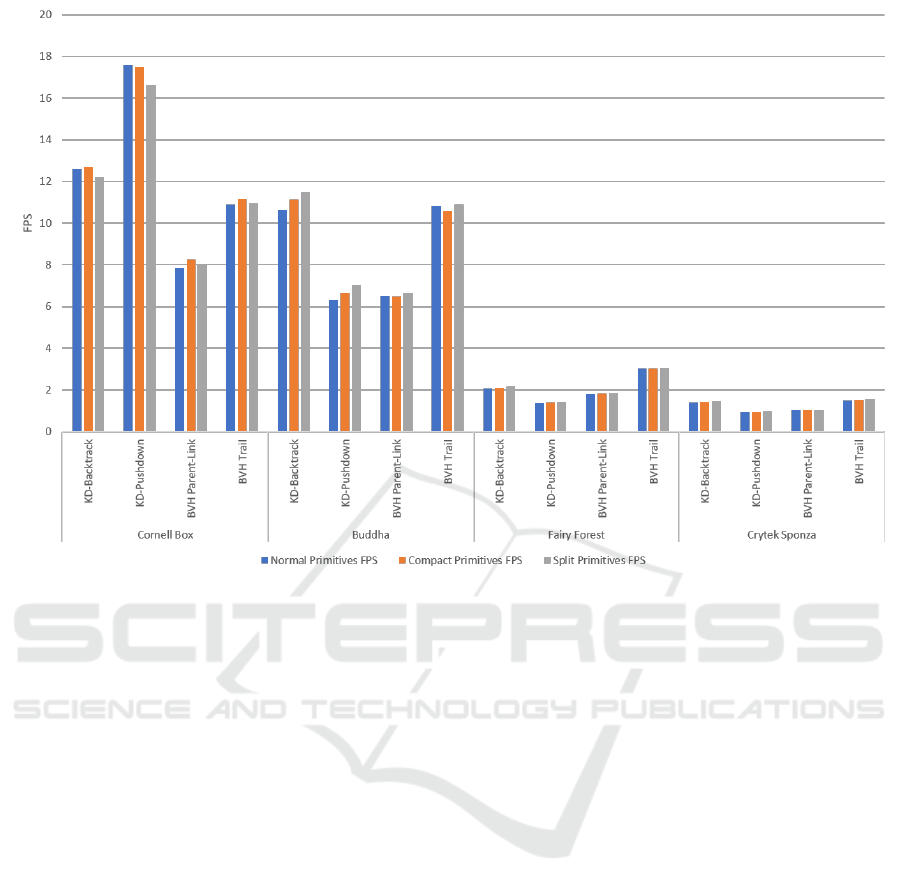
Figure 4: Graph showing performance for different primitive layouts.
The application always renders the resulting im-
age at 1024x1024 resolution. We also restart the ap-
plication between every test.
5 RENDERING TECHNIQUES
COMPARISON
We implemented three different rendering ap-
proaches, and for each approach we profiled the per-
formance of different traversal methods across differ-
ent scenes. While Fragment and Compute rendering
had similar performance, as shown in Figure 3, the
hybrid rendering approach distinguished itself by hav-
ing better performance. This is due to the higher com-
putational cost of ray tracing when compared with
rasterization.
Overall, our results show that using hybrid ren-
dering is the best approach when implementing ray
tracing on mobile. However, different ray tracing al-
gorithms may benefit from using Fragment and Com-
pute Shader based rendering.
6 PRIMITIVE LAYOUT
COMPARISON
As shown in Figure 4, we ran a series of tests to anal-
yse the performance of the different primitive layouts.
Results show that a compact layout does not always
equate to better performance as it needs a few extra
instructions to retrieve the stored normal. The split
layout on the other hand, consistently yields either
similar or better results.
To better understand the impact of these changes
when accessing memory, we performed a bandwidth
analysis using the Cornell Box and Buddha scenes.
The results are shown in Figures 5 and 6.
The results show that there is a reduction in mem-
ory bandwidth from using the compact and split lay-
outs, with split layout producing the best results. Hav-
ing vertices and normals separated means that no
bandwidth is wasted on normals that are not being
used. This maximizes the number of vertices fetched
each time which means the number of overall fetches
is reduced.
Scenes with higher complexity require more ac-
cesses to the data structures containing the geometry
and thus, optimization of primitive layout becomes
more important because of the impact in memory
bandwidth utilization.
GRAPP 2019 - 14th International Conference on Computer Graphics Theory and Applications
336
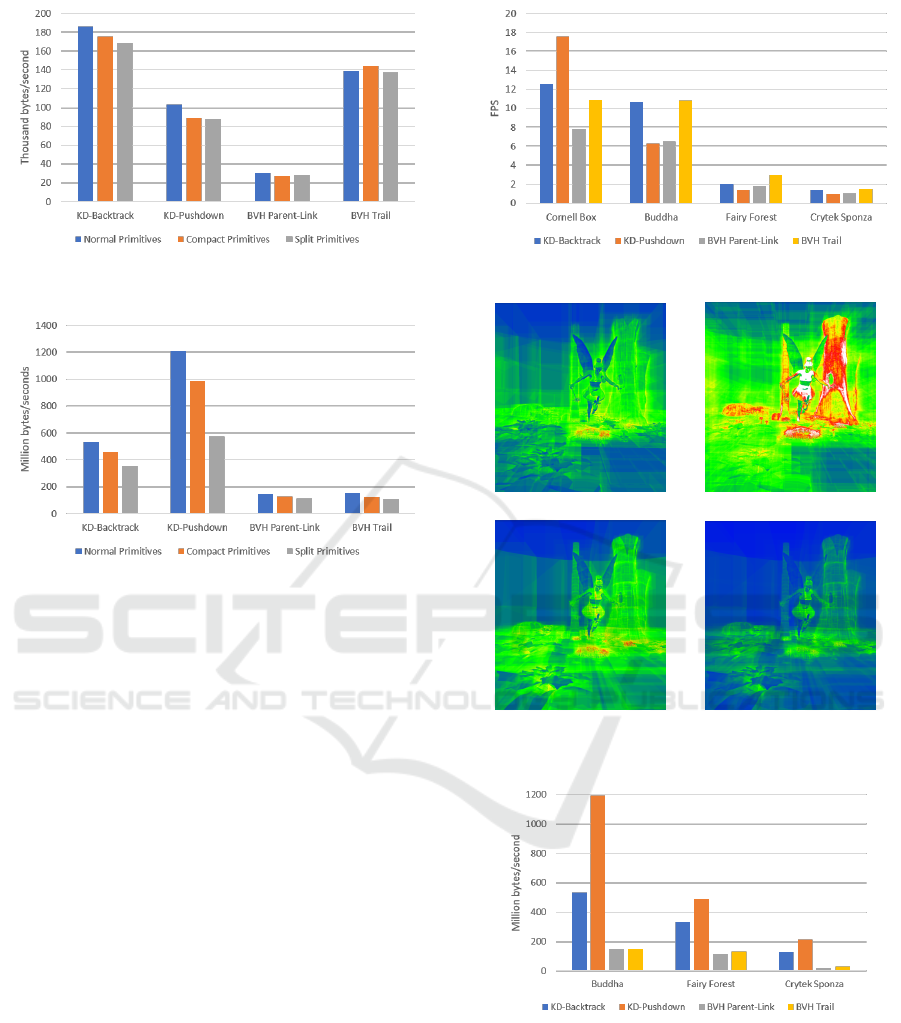
Figure 5: Memory bandwidth usage when varying primitive
layout for the Cornell Box Scene.
Figure 6: Memory bandwidth usage when varying primitive
layout for the Buddha Scene.
7 ACCELERATION DATA
STRUCTURE COMPARISON
Acceleration data structures are essential for the effi-
ciency of ray tracing algorithms and as such have an
impact on performance. In the following sections we
will present and discuss the results we obtained with
regards to computation cost and memory utilization.
7.1 Performance
To evaluate the performance of the different data
structures, we conducted a series of tests for the
traversal methods we chose across different scenes.
For these particular tests we only used the Fragment
Shader renderer along with a normal primitive layout.
Figure 7 shows the results obtained from all
the test runs. Whilst the performance of the KD-
Pushdown traversal excels in scenes with a lower
number of primitives, it quickly deteriorates in scenes
with higher geometric complexity. In contrast, BVH
Trail traversal performs better in more complex
scenes.
To understand the performance difference be-
tween traversal methods, we created heatmaps for
Figure 7: Performance values for acceleration structures.
(a) KD-Backtrack (b) KD-Pushdown
(c) BVH-Parent (d) BVH-Trail
Figure 8: Heatmap of the fairy scene for all structures.
Figure 9: SP Memory Read values for each structure. Val-
ues for the Cornell Box were not visible at this scale.
each traversal method and each scene. Figure 8 shows
a subset of the generated heatmaps.
We obtained the best results using BVH Trail.
KD-Backtrack and BVH-Parent-Link followed up,
yielding similar results to each other. This verifies
our previous observations and shows that the number
of traversed nodes correlates to the performance of
Acceleration Data Structures for Ray Tracing on Mobile Devices
337
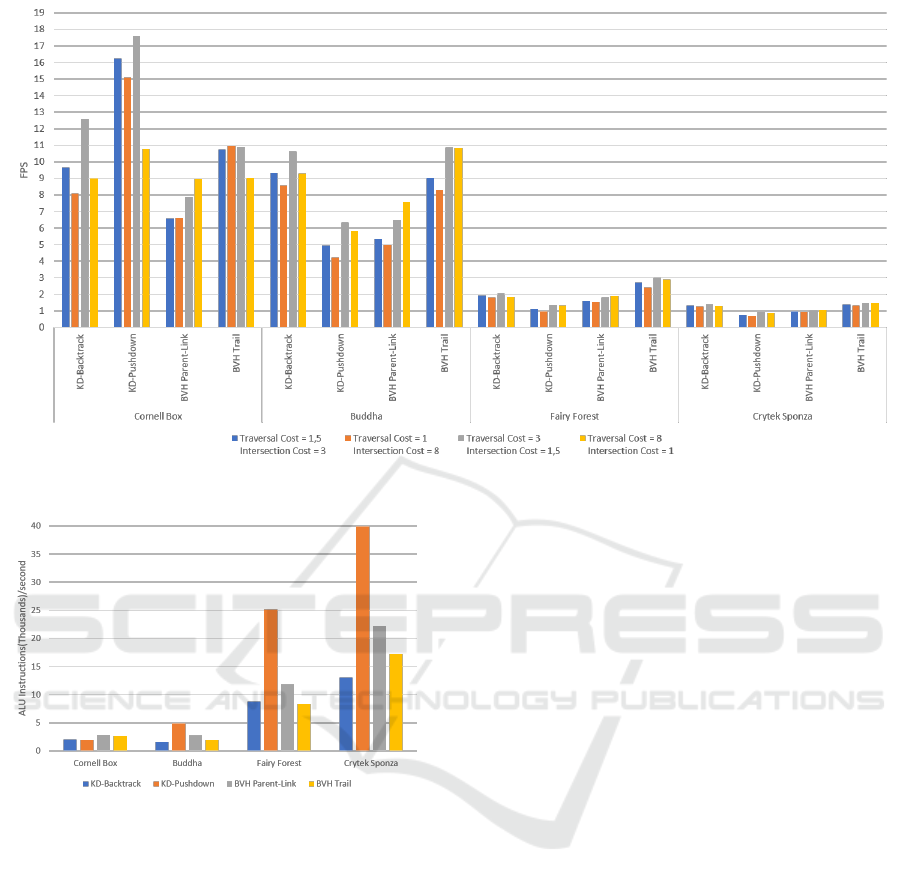
Figure 10: Performance comparison for different SAH cost values.
Figure 11: ALU instructions per fragment.
the algorithm. Due to the high cost of bandwidth, we
measure its impact. The results are shown in Figure 9.
Algorithms based on KD-Trees consume higher
memory bandwidth than those based on BVHs. One
explanation is that the increased number of nodes gen-
erated by KD-Trees boosts the probability of execut-
ing a memory fetch for each new traversed node. This
is because each local memory fetch request is less
probable to contain the next node that needs to be tra-
versed. In Figure 11 we also analyse the ALU in-
structions per fragment.
Results show that, the KD-Backtrack algorithm
requires the least overall amount of ALU instructions.
This is due to the fact that it performs no near-far clas-
sification, and, consequently, uses fewer instructions
per node traversed than other traversal methods.
On the opposite end, the traversal method with
most ALU instructions per fragment is the KD-
Pushdown due to the increased number of nodes and
extra traversal steps it takes. This, combined with
higher memory bandwidth utilization, results in the
worst performance across all the traversal methods.
Results show that traversal methods with fewer
ALU instructions per fragment have better perfor-
mance. There is however the exception of the KD-
Backtrack traversal, that despite using less ALU in-
structions has its traversal slowed down due to the
high memory bandwidth requirements.
According to these results the performance of the
traversal algorithms is limited by a combination of
ALU, memory accesses and bandwidth. However,
the strongest limitation appears to be the number of
traversed nodes, i.e. the number of accesses to the
SSBOs that contain the acceleration structure.
7.2 SAH Costs Comparison
One of the ways to optimize KD-Trees and BVHs
built using the SAH is to tweak the values for traversal
and intersection cost given to the construction func-
tion. Usually, having the intersection cost higher than
the traversal yields better results. To test this we used
four different cost values and a combination of all the
scenes and traversal methods.
As shown in Figure 10, having an intersection cost
lower than the traversal cost provides the best perfor-
mance. The results also show that it is best to keep the
traversal cost only slightly higher than the intersec-
tion cost. Reducing the cost of traversal equates to a
GRAPP 2019 - 14th International Conference on Computer Graphics Theory and Applications
338

higher number of node traversals necessary per pixel.
The performance numbers shown in Figure 10 corrob-
orate the previous results showing that the number of
traversals correlate to the performance of the traversal
algorithm.
8 CONCLUSIONS
Our work focused on providing a performance anal-
ysis of different acceleration data structures for ray
tracing on mobile devices. Our main goal was to es-
tablish a basis for future research into the potential of
mobile environments. As for future work, we want to
explore the performance of construction methods for
dynamics scenes to provide further insight on current
mobile hardware capabilities.
ACKNOWLEDGEMENTS
This work was supported by national funds through
Fundac¸
˜
ao para a Ci
ˆ
encia e T
´
ecnologia (FCT) with ref-
erence UID/CEC/50021/2019.
REFERENCES
Appel, A. (1968). Some techniques for shading machine
renderings of solids. In Proceedings of the AFIPS
Conference, pages 37–45.
Bentley, J. (1975). Multidimensional binary search trees
used for associative searching. Commun. ACM,
18(9):509–517.
Cook, R., Porter, T., and Carpenter, L. (1984). Distributed
ray tracing. In Proceedings of the 11th Annual Con-
ference on Computer Graphics and Interactive Tech-
niques, pages 137–145.
Foley, T. and Sugerman, J. (2005). Kd-tree acceleration
structures for a gpu raytracer. In Proceedings of
the ACM SIGGRAPH/EUROGRAPHICS conference
on Graphics hardware, pages 15–22.
Goldsmith, J. and Salmon, J. (1987). Automatic creation
of object hierarchies for ray tracing. IEEE Comput.
Graph. Appl., 7(5):14–20.
Hapala, M., Davidovi
ˇ
c, T., Wald, I., Havran, V., and
Slusallek, P. (2011). Efficient Stack-less BVH Traver-
sal for Ray Tracing. In Proceedings of the 27th Spring
Conference on Computer Graphics, pages 7–12.
Hapala, M. and Havran, V. (2011). Review: Kd-tree Traver-
sal Algorithms for Ray Tracing. Computer Graphics
Forum, 30(1):199–213.
Horn, D. R., Sugerman, J., Houston, M., and Hanrahan, P.
(2007). Interactive kd tree gpu raytracing. In Proceed-
ings of the 2007 symposium on Interactive 3D graph-
ics and games, pages 167–174.
Kajiya, J. (1986). The rendering equation. In Proceedings
of the 13th Annual Conference on Computer Graphics
and Interactive Techniques, pages 143–150.
Kay, T. L. and Kajiya, J. T. (1986). Ray tracing complex
scenes. In ACM SIGGRAPH computer graphics, vol-
ume 20, pages 269–278.
Laine, S. (2010). Restart Trail For Stackless BVH Traver-
sal. In Proceedings of the Conference on High Perfor-
mance Graphics, pages 107–111.
M
¨
oller, T. and Trumbore, B. (2005). Fast, minimum storage
ray/triangle intersection. In ACM SIGGRAPH 2005
Courses.
Thrane, N. and Simonsen, L. O. (2005). A comparison
of acceleration structures for gpu assisted ray tracing.
Master’s thesis.
Wald, I. and Havran, V. (2006). On building fast kd-Trees
for Ray Tracing, and on doing that in O(N log N).
In Proceedings of the IEEE Symposium on Interactive
Ray Tracing, pages 61–69.
Whitted, T. (1979). An improved illumination model for
shared display. In Proceedings of the 6th Annual Con-
ference on Computer Graphics and Interactive Tech-
niques.
Williams, A., Barrus, S., Morley, R. K., and Shirley, P.
(2005). An efficient and robust ray-box intersection
algorithm. In ACM SIGGRAPH 2005 Courses.
Acceleration Data Structures for Ray Tracing on Mobile Devices
339
