
Comparison of Sparse Image Descriptors for Eyes Detection in Thermal
Images
Mateusz Knapik and Bogusław Cyganek
Department of Electronics, AGH University of Science and Technology, Kraków, Poland
Keywords:
Eye Detection, Sparse Descriptors, Surf Descriptor, Daisy Descriptor, Thermal Imaging, Operator Monitoring.
Abstract:
Eye detection and localization are basic steps in many computer systems aimed at human fatigue monitoring.
In this paper we evaluate performance of two sparse image descriptors for eye detection in the long-range IR
spectrum. In the training phase, sparse descriptors of the training images are computed and used to create fea-
tures vocabulary. Final detections are done using bag-of-words approach and additional heuristic for geometric
constraints. Several thermal video sequences were recorded to allow for quantitive analysis of this approach.
Experimental results show that our method achieves high accuracy in real conditions.
1 INTRODUCTION
Behavior and alertness level of an operator play es-
sential role in both people’s safety as well as in avoi-
ding economic losses. Real-time monitoring of indi-
viduals operating machinery and various vehicles is
a subject of constant innovation in recent years. Such
systems must cope with wide range of difficult con-
ditions like noise, temperature, day and night illumi-
nation (Cyganek, 2007). They must be also able to
provide correct response in presence of variability in
appearance and behavior of human subjects.
For camera-based solutions, thermal long range
IR imaging is gaining attraction in recent years, spur-
ring both industrial solutions and research projects (Ji
and Yang, 2002; Saradadevi and Bajaj, 2008; Azim
et al., 2009; Fan et al., 2009; Cyganek and Gruszczy
´
n-
ski, 2014; Shah et al., 2014; Wang et al., 2013; Str ˛a-
kowska and Str ˛akowski, 2015; Marzec et al., 2016;
Ribeiro et al., 2017). Unlike visible light sensors, long
range IR cameras can operate with no external lig-
hting even in total darkness. On the other hand, they
are insensitive to even extreme visible lighting condi-
tions frequently encountered in car conditions. Other
challenging factors for visible light cameras, like, for
example, skin color or camouflage makeup, are eli-
minated with thermal imaging. This properties makes
them a viable alternative for classic cameras. Also, a
supporting factor is growing availability of low-cost
long-infrared spectrum sensors.
However, proper image processing and analysis
methods are needed to create end-to-end solution. A
system for tiredness level monitoring, which is based
on facial features recognition, is composed of many
smaller subsystems such as data acquisition, image
processing and analysis for behavioral modeling. Al-
most always, one of the task involved in detection of
the facial landmarks is the eye detection step. This
paper evaluates performance of two sparse image des-
criptors when used for human eyes detection and loca-
lization in thermal images. The data processing path
is composed of computation of either the Speeded Up
Robust Features (SURF) (Bay et al., 2008) or DAISY
(Tola et al., 2010) descriptors on a dense grid. Then
clustering to achieve distinctive prototype patterns is
applied. Further on there are modules for matching
to vocabulary, similarity distance computation and fi-
nally geometric constraints verification. Contrary to
other techniques, visibility of both eyes in an image
is not required. The proposed method can be used in
many domains, ranging from surveillance, entertain-
ment or medical imaging.
Rest of this paper is organized as follows:
Section 2 describes the existing state-of-the-art works
that are related to the proposed system. Section 3 is
an overview of the system architecture and theory be-
hind methods used throughout this paper. Section 4
presents the results of conducted experiments to as-
certain scientific validity of presented system. Finally,
Section 5 presents our conclusions.
638
Knapik, M. and Cyganek, B.
Comparison of Sparse Image Descriptors for Eyes Detection in Thermal Images.
DOI: 10.5220/0007576506380644
In Proceedings of the 14th International Joint Conference on Computer Vision, Imaging and Computer Graphics Theory and Applications (VISIGRAPP 2019), pages 638-644
ISBN: 978-989-758-354-4
Copyright
c
2019 by SCITEPRESS – Science and Technology Publications, Lda. All rights reserved

2 RELATED WORKS
In this section general overview of the state-of-the-art
works related to localization of facial areas in infrared
spectrum is presented and discussed.
For near range infrared (NIR) spectra, system for
eye detection was proposed by Cyganek and Grusz-
czy
´
nski (Cyganek and Gruszczy
´
nski, 2014). In order
to detect and localize eyes, NIR images are fed into
cascade of classifiers. Specialized iris-pupil model is
used to determine initial regions of interest. Tensor
classifier is then used to select the most probable pair
of ROIs. Authors reported accuracy of over 96%.
For thermal imaging, currently existing works are
mostly suited for a constrained imaging conditions,
i.e. both eyes have to be present in the frame for algo-
rithm to work correctly.
Wang et al. (Wang et al., 2013) proposed sy-
stem for automatic eyes localization. Haar-like featu-
res boosted with Adaboost algorithm are used for de-
termining 15 subregions of face area, determining the
eyes position. Additionally, for situations when sub-
ject wears glasses, their system first tries to localize
centers of each lens. However, face region is obtai-
ned by binarization and pixel summation, so presence
of any objects with temperature similar to the human
subject can affect the process and decrease its perfor-
mance.
Face tracking method in long-range IR based sy-
stems was proposed by Str ˛akowska et al. (Str ˛akow-
ska and Str ˛akowski, 2015). It is based on a principle,
that corners of the human eyes are the hottest regi-
ons of the face. In their approach, face area is lo-
calized using modified binarization algorithm. Then
H-maxima transformation is used to preprocess the
image and select regions of interests. Final result is
based on calculation of geometrical distances bet-
ween proposed regions.
In 2016, Marzec et al. in (Marzec et al., 2016)
presented new approach for fast eyes localization in
thermal images. Two-stage system consists of face
area detector and classifier based on multilayer per-
ceptron neural network. Authors claims high accu-
racy of their method, however similar constraints as in
Wang’s methods are present, for example, both eyes
have to be visible to obtain regions of interest for furt-
her processing.
On the other hand, face detection in thermal ima-
ging using template matching was recently presented
by Ribeiro et al. (Ribeiro et al., 2017). Their propo-
sed method achieves good accuracy and low compu-
tational complexity. Authors also report that the met-
hod based on the Haar cascades, often used for visi-
ble light spectrum, can yield better results, but trai-
ning process of such classifier requires large amount
of data and can be time consuming.
For features detection, Lowe presented algorithm
called Scale-invariant Feature Transform (SIFT)
(Lowe, 2004). It is one of the most well-known al-
gorithms for detection and descriptor generation of
local features in images. Due to it’s high invariance
to uniform scaling, orientation and illumination chan-
ges it is used in many applications including image-
stitching, video tracking and object detection, to name
a few.
Bay et al. proposed scale- and rotation-invariant
feature descriptor and complementary keypoint detec-
tor called Speeded Up Robust Features (SURF) (Bay
et al., 2008) as much faster alternative to SIFT. For de-
tection of points of interest SURF uses an approxima-
tion of the determinant of the Hessian blob detector.
Authors claims that SURF is more robust than SIFT
against different image transformations while being
several times faster to compute at the same time.
Tola et al. introduced feature descriptor called
DAISY (Tola et al., 2010), designed specifically to be
efficient when computed densely, i.e. for 3D recon-
struction from the wide-baseline image pairs. It requi-
res less computational power than SIFT. In compari-
son to SURF, it is claimed not to introduce artifacts
that degrade matching performance when computed
on a dense grid.
Bag-of-words image categorization methods were
presented in a past by several researchers (Csurka
et al., 2004; Lazebnik et al., 2006; Fulkerson et al.,
2008) colorredboth for image classification as well
as feature detection. Only recently BoW method was
also applied for feature detection in other spectra
(Malpani et al., 2016). In their work, Malpani et al.
presented system for human detection and localiza-
tion in thermal images.
To the best of our knowledge, the presented paper
is a first comparison of SURF and DAISY descriptors
for eye detection in thermal images.
3 EYE LOCALIZATION IN
THERMAL IMAGES
An architecture of the eye detection module descri-
bed in this paper is presented in Fig. 1. Further secti-
ons present detailed description of each of the visible
modules. In our method, SURF and DAISY feature
descriptors are used for feature extraction. Either fea-
ture description technique was used separately on the
same set of images and the results have been com-
pared. Facial-features localization is later done using
sparse representation of a thermal image. Training
Comparison of Sparse Image Descriptors for Eyes Detection in Thermal Images
639

Figure 1: Eye detection system architecture.
images of eyes are used to create vocabulary of des-
criptors in a training phase. Later, descriptors extrac-
ted from new images are compared to the dictionary
to compute the similarity measure. Statistical model-
ling of a training data is used to remove features that
are dissimilar from the trained patterns. High con-
fidence features are gathered into clusters and final
eye candidates are chosen using series of geometrical
checks.
3.1 Contrast Enhancement
One of the main characteristics of thermal images is
their low contrast. Low variance in temperature bet-
ween facial landmarks can decrease the performance
of feature detection modules. In our method, stream
of the thermal images from the acquisition module are
preprocessed using multi-scale local contrast enhan-
cement method proposed by Cvetkovic et al. (Cvet-
kovic et al., 2009).
Every pixel of the input image is processed with
local-spatial filter computed as follows:
o
i
= i
i
+ (i
i
− m(i
i
)) (1)
where i
i
is the input pixel intensity and m is the mean
value around the pixel i
i
in a window of size 3 × 3
pixels calculated using Equation (2). Size of the win-
dow has been chosen empirically to suite the low re-
solution of the input images.
m(i
i
(x, y)) =
1
9
1
∑
s=−1
1
∑
p=−1
i
i
(x + s, y + p) (2)
Images before and after contrast enhancement can
be seen in Fig. 2.
(a)
(b)
Figure 2: Thermal image before (upper) and after contrast
enhancement (lower).
3.2 Vocabulary Extraction
Bag-of-words dictionary is created in the training
phase that starts with a computation of a dense grid
of feature descriptors on the training images of eyes
taken in long-range infrared spectrum. Dimensions
of the grid have been selected empirically and set to
d
desc
. Feature descriptors obtained in such way could
be used directly to form a feature vocabulary, howe-
ver to increase the generalization of our model feature
reduction technique called k-means clustering have
been applied. This iterative process groups together
similar descriptors to form k visual words from the
clusters centroids. Because the size of the dictionary
impacts the detection effectiveness, it was chosen em-
pirically, as will be shown later.
To measure the distance of a single feature from
the dictionary, an Euclidian metric is used. It is calcu-
lated as follows:
d( f , v) = min
"
q
( f
0
− x
0
0
)
2
+ ··· + ( f
n−1
− x
0
n−1
)
2
,
··· ,
q
( f
0
− x
k−1
0
)
2
+ ··· + ( f
n−1
− x
k−1
n−1
)
2
#
(3)
VISAPP 2019 - 14th International Conference on Computer Vision Theory and Applications
640

Table 1: Parameters used in the presented algorithms.
Parameter Value Used in Comment
d
desc
1 to 3 pixels Dense grid sampling
Distance in vertical and horizontal direction between
feature descriptors
w
h
, w
w
2 by 2 Distance comparison
How many neighboring features distances are used
for comparison
v
size
100 to 200 words Distance comparison Number of visual words in the dictionary
d
c
10 or 15 pixels Algorithm 1
Maximal distance in pixels between
neighboring points
g
ecc
0.85 Algorithm 2 Eccentricity limit for cluster
g
min
, g
max
2x2 pixels,
50x50 pixels
Algorithm 2 Cluster length and width constraints
e
min
, e
max
0.8,
3
Algorithm 2 Distance ratio between two eyes
θ
max
60 deg Algorithm 2 Maximal angle between two clusters
where f is new feature, x
i
0
, x
i
1
, ··· , x
i
k−1
are the ele-
ments of ith visual word from the vocabulary, n deno-
tes the size of a single word and k denotes the size of
the whole vocabulary.
3.3 Distance Thresholding
Because human eyes will occupy relatively small area
of the whole image and the fact, that feature descrip-
tors are computed on a dense grid, our system em-
ploys features reduction method based on a statistical
modelling. To reduce number of potential regions of
interest, we compare the distance d( f , v) to a thres-
hold value obtained in a training phase. A mean plus
two standard deviations method described in (Miller,
1991) has been used in experiments presented in this
paper and was computed as follows
t
σ
= D + 2 ·
s
1
N
N
∑
i=1
d( f
i
, v) − D
2
(4)
where N is the number of features in a training set,
d( f
i
, v) is the distance of an ith training feature (be-
fore clustering) from the vocabulary v and D is an
average distance of all training features from voca-
bulary v.
In detection phase, feature or group of features
will not be passed to further processing blocks if it’s
distance from vocabulary is bigger than the t
σ
thres-
hold. To improve robustness, in our experiments we
used sum of distances of w
h
× w
w
features, both to
compute threshold as well as in detection phase.
Visualization of thresholding process can be seen
in Fig. 3(b).
3.4 Detection
Detection and localization tasks can be started after
the training phase is done. For every new image dense
grid of feature descriptors with the same grid dimen-
sions as in a training phase is computed and distance
3 is calculated for every feature. This creates a map of
distances between local descriptors and trained voca-
bulary. A sliding window of size w
x
× w
y
is then used
to compute average distance of neighboring features.
This is compared to the t
σ
threshold and inliers are put
into a priority queue of length L
f
, which is ordered by
the distance value. The lower the value, the higher the
position in the queue.
To further decrease the amount of features, clus-
tering method called Salient Point Clustering (SPC)
is employed and every cluster is additionally approxi-
mated by an ellipse using central moments technique.
Both of these were presented and described in (Cyga-
nek, 2013).
Algorithm 1 shows the implementation details of
the SPC method using following definition of close
neighboring points: two points a and b are considered
as close neighbors if following inequality holds:
N
a, b
≤ d
c
(5)
where N denotes the Euclidean distance and d
c
stands
for an arbitrary chosen threshold.
A center point of a cluster c is computed using the
weighted average of every point, using it’s distance
value as a weight, using the following formulas.
d
max
= max
h
D
c
i
(6)
w
i
= w
max
− d
i
(7)
W =
N
∑
i
w
i
(8)
p
c
=
1
W
N
∑
i
x
i
· w
i
,
1
W
N
∑
i
y
i
· w
i
!
(9)
Comparison of Sparse Image Descriptors for Eyes Detection in Thermal Images
641

where D
c
denotes set of distances of features in a clus-
ter c, d
i
is a distance of ith feature in a cluster, w
i
is
a weight for ith feature, W is the sum of weights, N
is a number of features in a cluster c, x
i
and y
i
denote
the position of an ith feature of cluster c in a dense
features grid, and finally p
c
is the center point of a
cluster c.
Then the inertia tensor can be computed in terms
of the central moments, as follows.
c
ab
=
N
∑
i=1
N
∑
j=1
(x
i
− p
x
c
)
a
(y
i
− p
y
c
)
b
(10)
T =
"
c
20
−c
11
−c
11
c
02
#
(11)
To obtain length l
c
and width w
c
of the cluster c,
following formulas are computed:
l
c
=
p
λ
1
, w
c
=
p
λ
2
, λ
1
≥ λ
2
(12)
where λ
1
and λ
2
are eigenvalues of the inertia tensor
T .
Clusters are then inserted into another priority
queue of length L
c
that is ordered by ascending va-
lue of the median of cluster’s weights w
i
.
Algorithm 1: Salient Point Clustering.
Input: Set of points p
in
. Distance threshold d
c
.
Output: Clusters of points
1: while p
in
has elements do
2: pop last element from p
in
as s
3: for all clusters c do
4: c
0
is a first point in cluster c
5: if inequality (5) holds for s and c
0
then
6: add s to cluster c
7: break
8: if s is still not clustered then
9: create new cluster, add s as a first point
As a last step, simple geometric constraints checks
are made. Clusters must form ellipses of eccentricity
lower than g
ecc
and their length and width must be
within chosen limits. Finally, if more than two clusters
pass this criteria, their relative position, both the dis-
tance and the angle, is checked. These form the pro-
posed eye regions. Detailed description of this process
is shown in Algorithm 2.
4 EXPERIMENTAL RESULTS
The methods proposed in this article were implemen-
ted using Python language and well-known and publi-
cly available libraries like numpy, scipy, scikit-learn
and OpenCV. Experiments presented in this section
Algorithm 2: Geometric verification.
Input: Clusters of points. Constants g
ecc
, g
min
,
g
max
, e
min
, e
max
, θ
max
.
Output: Proposed eye regions
1: for every cluster c do
2: if c eccentricity ≥ g
ecc
then
3: continue
4: if c width ≥ g
max
or length ≥ g
max
then
5: continue
6: if c width ≤ g
min
or length ≤ g
min
then
7: continue
8: add c to correct clusters list
9: if correct clusters length == 0 then
10: return empty list
11: else if correct clusters length == 1 then
12: return one proposed eye region
13: else
14: get first two clusters from correct clusters list
as c
a
and c
b
15: set p
a
, p
b
to respective clusters centroids
16: if atan2(p
a
, p
b
) > θ
max
deg then
17: return empty list
18: D denotes the Euclidian distance between
points
19: if D(p
a
, p
b
) < e
min
or D(p
a
, p
b
) > e
max
then
20: return empty list
were run on a laptop computer equipped with 16GB
of RAM, and 4-core processor i7-6700HQ with the
2.6GHz clock. The 64-bit Windows
R
10 operating
system was used. Future implementations aimed at
speedup are also possible, e.g. by utilizing parallel
computing platforms, like CUDA
R
or OpenCL
R
.
Quantitive evaluation was done using our own
thermal database that consist of over 3500 images
of human faces from three participants with manu-
ally labeled ground-truth frames. Database was cre-
ated using the FLIR
R
A35 camera that produces ima-
ges of resolution 320 × 256 pixels. For the purpose
of our comparison, number of experiments were con-
ducted. The following research questions were stated:
• What is the accuracy of the proposed method?
• Is there a measurable benefit of using feature des-
criptor designed for dense sampling?
Average results of three repetitions of every experi-
ment are presented. Before every test round dataset
was randomly split in half to create training and vali-
dation subsets. Result from every frame was categori-
zed in terms of true-positive (TP), true-negative (TN),
false-positive (FP), and false-negative (FN) parame-
ters and then F value was computed. Each correctly
recognized eye position, that is, the difference bet-
ween region found by an algorithm and the ground
VISAPP 2019 - 14th International Conference on Computer Vision Theory and Applications
642
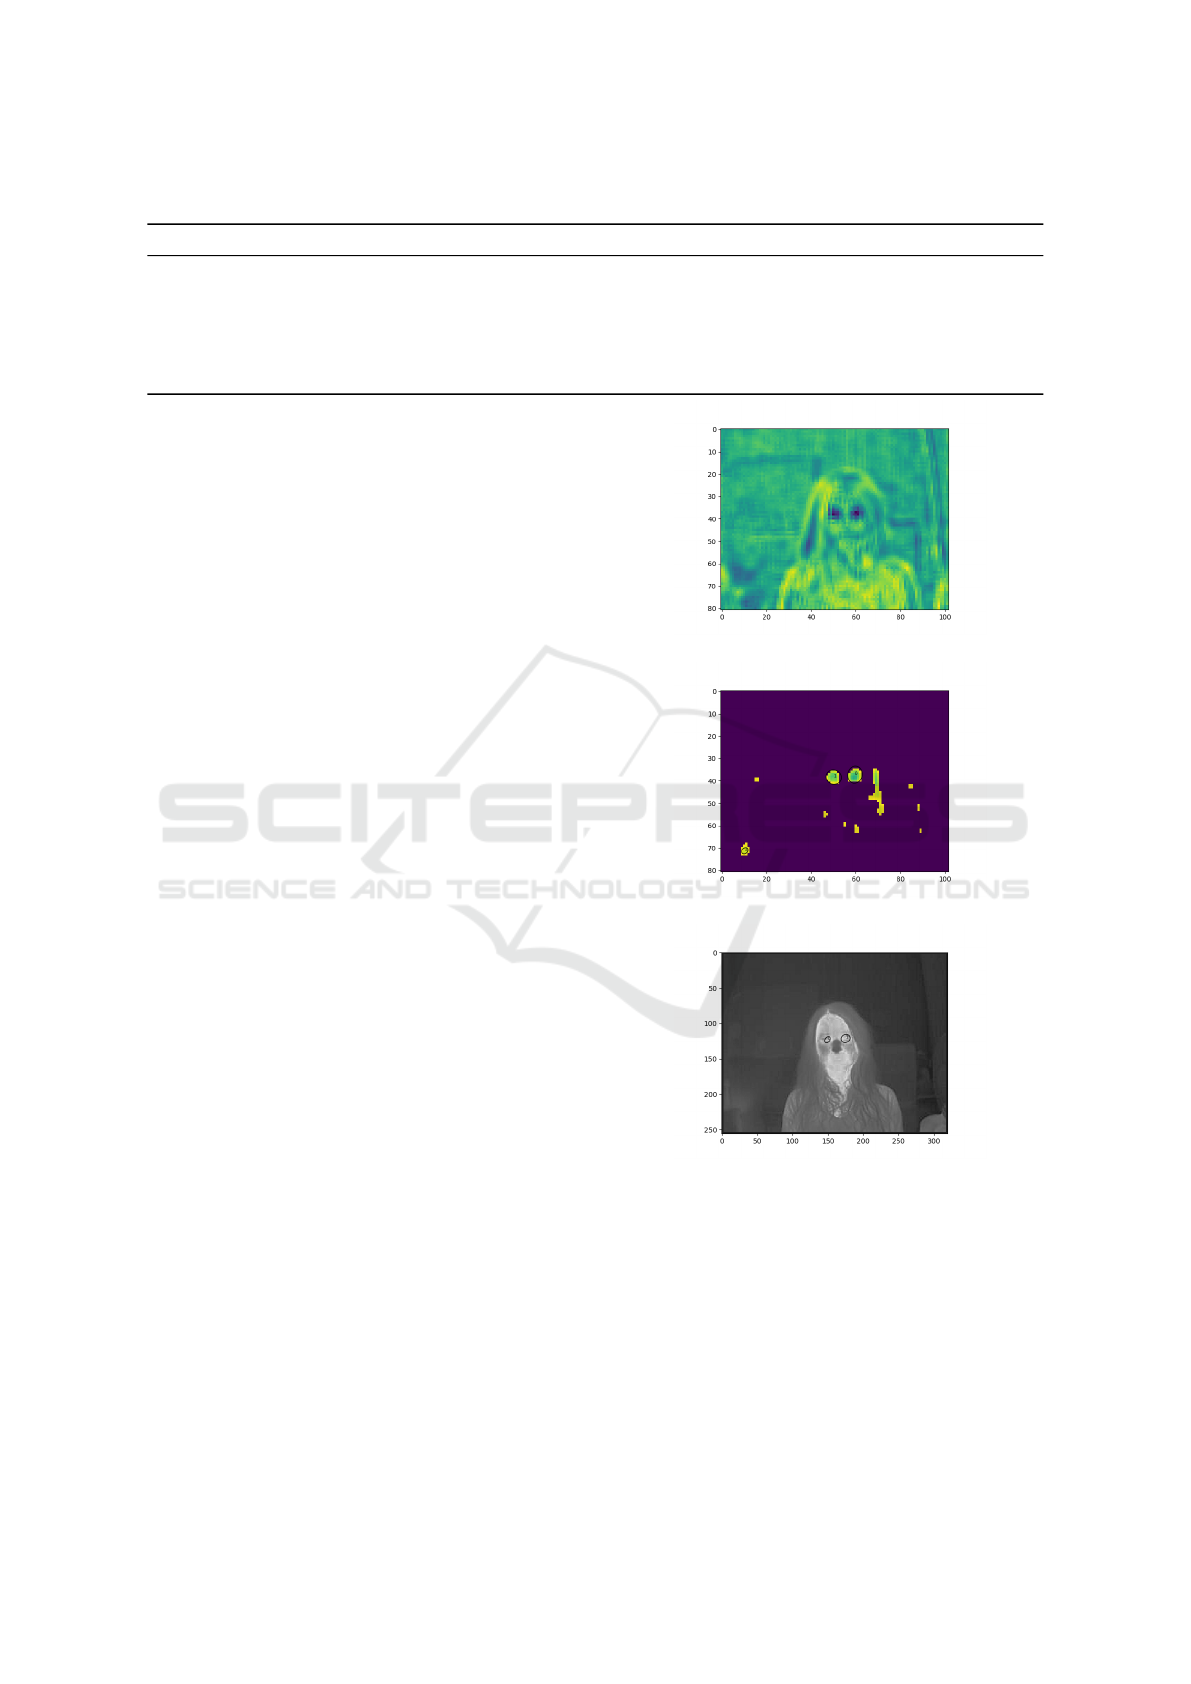
Table 2: Results of detection accuracy experiments.
F-value result
DAISY SURF
Vocabulary 100 150 200 100 150 200
Cluster size 10 15 10 15 10 15 10 15 10 15 10 15
Step size 1 0.808 0.817 0.802 0.795 0.785 0.796 0.784 0.801 0.790 0.791 0.776 0.788
2 0.755 0.931 0.747 0.942 0.747 0.943 0.688 0.846 0.671 0.827 0.677 0.861
3 0.789 0.912 0.786 0.908 0.772 0.908 0.727 0.844 0.735 0.857 0.733 0.858
truth is less than 10 pixels (around 3% given the
size of an input image), is reported as a true-positive.
Every incorrectly detected eye is counted as false-
positive. False-negative is increased when algorithm
fails to detect an eye. Eyes not present in the picture
and not reported by algorithm are counted as true-
negative. Summary of the parameters used in the con-
ducted experiments is presented in Table 1. Full re-
sults of the experiments are presented in Table 2.
To find optimal parameters for each type of feature
descriptor many combinations of parameters were
tested. Three different grid spacing were considered,
from 1 to 3 pixels, alongside three different dictionary
sizes, from 100 to 200 visual words and two sizes of
clustering thresholds, 10 and 15 pixels. Bigger clus-
ters in case of both descriptors increased the perfor-
mance significantly. More features allowed to refine
clusters size and find center point more accurately.
However, it should be noted that clustering threshold
is correlated with grid spacing. Very dense grid results
in small intra-class difference between words. Incre-
ase in spatial distance between features allows for bet-
ter utilization of vocabulary, therefore bigger clusters
can be localized with better precision. This results in
better detector performance. On the other hand, in-
creasing vocabulary size had little effect on the effi-
cacy of detection, even decreasing F-value in some
cases. Low resolution and noise in the input images
decrease the intra-class difference between computed
descriptors, therefore expanding dictionary size does
not bring radical performance increase while being
computationally expensive. We checked the lowest
and highest F-value for both descriptor types. Even
in worst case scenario, the F-value is higher than 0.67
for SURF descriptor and 0.74 for DAISY descriptor
which is quite good considering the vagueness of eye
contours in thermal images. DAISY descriptor achie-
ves around 6% better results on average, reaching
over 0.94 F-value with fine-tuned grid and vocabulary
size (0.86 for SURF). This results answer our second
research question. In our experimental setup, a dicti-
onary with 200 words, combined with cluster size of
15 pixels and grid step of 2 pixels, gave the overall
best results for both types of descriptors.
(a)
(b)
(c)
Figure 3: Distance map (top), corresponding map after
thresholding and clustering (middle) and final detection re-
sult (bottom).
5 CONCLUSION
In this paper two types of local features descriptors
are compared for usage in eye detection in thermal
images system. Dense grid of feature descriptors is
used to create a dictionary of visual words, that are
Comparison of Sparse Image Descriptors for Eyes Detection in Thermal Images
643

then used for eye regions detection and localization.
As shown, the proposed system achieves high accu-
racy as well as proves the benefits of using feature
descriptor designed with dense sampling in mind.
There is also room for improvements in implemen-
tation after which it can operate in real-time. The pro-
posed system can be also used in other domains, such
as medicine, surveillance or operators fatigue monito-
ring.
ACKNOWLEDGEMENTS
This work was supported by the AGH University
of Science and Technology under the grant no.
15/11/421.
REFERENCES
Azim, T., Jaffar, M., Ramzan, M., and Anwar, M. (2009).
Automatic fatigue detection of drivers through yaw-
ning analysis. In Signal Processing, Image Proces-
sing and Pattern Recognition, pages 125–132, Berlin,
Heidelberg. Springer Berlin Heidelberg.
Bay, H., Ess, A., Tuytelaars, T., and Van Gool, L. (2008).
Speeded-up robust features (surf). Comput. Vis. Image
Underst., 110(3):346–359.
Csurka, G., C., R., D., L., F., J., W., and C., B. (2004). Visual
categorization with bags of keypoints. workshop on
statistical learning in computer vision. International
Conference on Computer Vision (ECCV 2004), page
1–22.
Cvetkovic, S., Schirris, J., and With, de, P. (2009). Locally-
adaptive image contrast enhancement without noise
and ringing artifacts. In Proceedings of the IEEE
International Conference on Image Processing (ICIP
2007), October 16-19, 2007, San Antonio, Texas, pa-
ges 557–560, United States. Institute of Electrical and
Electronics Engineers (IEEE).
Cyganek, B. (2007). Soft System for Road Sign Detection,
pages 316–326. Springer Berlin Heidelberg, Berlin,
Heidelberg.
Cyganek, B. (2013). Object Detection and Recognition in
Digital Images: Theory and Practice. Wiley.
Cyganek, B. and Gruszczy
´
nski, S. (2014). Hybrid computer
vision system for drivers’ eye recognition and fatigue
monitoring. Neurocomputing, 126:78–94.
Fan, X., Yin, B.-C., and Sun, Y.-F. (2009). Yawning de-
tection based on gabor wavelets and lda. 35:409–
413+432.
Fulkerson, B., Vedaldi, A., and Soatto, S. (2008). Locali-
zing objects with smart dictionaries. In Forsyth, D.,
Torr, P., and Zisserman, A., editors, Computer Vision
– ECCV 2008, pages 179–192, Berlin, Heidelberg.
Springer Berlin Heidelberg.
Ji, Q. and Yang, X. (2002). Real-time eye, gaze, and face
pose tracking for monitoring driver vigilance. 8:357–
377.
Lazebnik, S., Schmid, C., and Ponce, J. (2006). Beyond
bags of features: Spatial pyramid matching for recog-
nizing natural scene categories. 2006 IEEE Computer
Society Conference on Computer Vision and Pattern
Recognition - Volume 2 (CVPR’06), page 1–22.
Lowe, D. G. (2004). Distinctive image features from scale-
invariant keypoints. Int. J. Comput. Vision, 60(2):91–
110.
Malpani, S., S, A. C., and Narasimhadhan, A. V. (2016).
Thermal vision human classification and localization
using bag of visual word. In 2016 IEEE Region 10
Conference (TENCON), pages 3135–3139.
Marzec, M., Lam
˙
za, A., Wróbel, Z., and Dziech, A. (2016).
Fast eye localization from thermal images using neu-
ral networks. Multimedia Tools and Applications.
Miller, J. (1991). Short report: Reaction time analysis
with outlier exclusion: Bias varies with sample size.
The Quarterly Journal of Experimental Psychology
Section A, 43(4):907–912.
Ribeiro, R. F., Fernandes, J. M., and Neves, A. J. R. (2017).
Face detection on infrared thermal image. In SIGNAL
2017 : The Second International Conference on Ad-
vances in Signal, Image and Video Processing, pages
38–42. IARIA.
Saradadevi, M. and Bajaj, P. (2008). Driver fatigue de-
tection using mouth and yawning analysis. 8.
Shah, A., Kukreja, S., Shinde, P., and Kumari, A. (2014).
Yawning detection of driver drowsiness. 2.
Str ˛akowska, M. and Str ˛akowski, R. (2015). Automatic eye
corners detection and tracking algorithm in sequence
of thermal medical images. Measurement Automation
Monitoring, 61(6):199–202.
Tola, E., Lepetit, V., and Fua, P. (2010). Daisy: An effi-
cient dense descriptor applied to wide baseline stereo.
IEEE TRANS. PATTERN ANALYSIS AND MACHINE
INTELLIGENCE, 32(5).
Wang, S., Liu, Z., Shen, P., and Ji, Q. (2013). Eye localiza-
tion from thermal infrared images. Pattern Recogni-
tion, 46(10):2613 – 2621.
VISAPP 2019 - 14th International Conference on Computer Vision Theory and Applications
644
