
Towards the Modelling of Osseous Tissue
F. D. P
´
erez and J. J. Jim
´
enez
Graphics and Geomatics Group, University of Ja
´
en, Ja
´
en, Spain
Keywords:
Modelling, Image reconstruction, Virtual, Bone, Tissue.
Abstract:
The virtual representation of bone tissue is one of the pending challenges of infographics in the field of trau-
matology. This advance could mean a reduction in the time and effort that is currently used in the analysis of a
bank of medical images, as it is done manually. Our proposal aims to lay the foundations of the elements that
must be taken into account not only geometrically, but also from a medical point of view. In this article we
focus on the segmentation of a bone model, establish the limits for its representation and introduce the main
characteristics of the microstructures that form in the bone tissue.
1 INTRODUCTION
Computer graphics applied to medicine is a field of
research with many open lines and continues to boom
due to the advancement of technologies. In the field of
traumatology, the creation of computer-assisted tech-
niques has made it possible to reduce the intervention
time, minimise the risk of error and advances in re-
search to microscopic levels in order to predict and
reduce the possibility of suffering a fracture. Stud-
ies at microscopic levels are generally based on the
use of computed tomographic images (CT). These im-
ages contain more detailed information than X-rays
and are 2D grayscale images, which can be converted
into a 3D volume, where the intensity of the pixel cor-
responds to the coefficient of absorption of the mate-
rial. In addition to the difficulty of obtaining a quality
image bank to work, the radiation used to obtain the
images can cause serious tissue damage and mean a
significant health risk to patients. Therefore, there is
a need to find a way to replace them. Our main objec-
tive is the generation of virtual bone tissue that will
allow us to advance through the substitution of these
images by providing a much richer and more varied
database than the one traditionally obtained with CT
images without endangering the health of patients. In
addition, it will make it possible to analyse and ob-
tain certain data that normally have to be examined
manually which take a long time. To compare the re-
sults obtained with those of specialists in the study of
bone tissue, the generation of tissue must be in 2D al-
though the importance of certain structural aspects of
the bone and the effects on the different structures that
form the bone at microscopic levels make it necessary
for it to be previous representated in three dimensions.
The structure of the article is as follows: section
2 reviews current knowledge of bone tissue represen-
tation. The representation of the model, the selection
of boundaries and the main characteristics of the mi-
croosseous structures are described below. Finally,
the conclusions obtained as well as the future work
is highlighted.
2 RELATED WORK
2.1 Hierarchy of Osseous Structures
The hierarchical structure of bones is a fundamental
point to take into account for this study. They have a
very complex structure that, in addition to providing
mechanical support, allows the reserve of minerals.
The complexity of this structure causes the bones to
have a great resistance. The following is a description
of the hierarchical structure of bone, from the macro-
scale to the nanoscale (Fig. 1):
• Macroscale: this is the level of the entire bone
that includes both types of bone: cortical and tra-
becular. In cortical bone, the lamellae come to-
gether in concentric circles to form osteons, while
in trabecular bone they come together irregularly
to form trabeculae.
• Mesoscale: this layer represents both the cortical
bone, which is composed of osteons embedded in
the interseptal bone, and the trabecular bone com-
posed of a porous network of trabeculae with ir-
regular shapes (Sabet et al., 2015).
340
Pérez F. and Jiménez J.
Towards the Modelling of Osseous Tissue.
DOI: 10.5220/0007580803400345
In Proceedings of the 14th International Joint Conference on Computer Vision, Imaging and Computer Graphics Theory and Applications (VISIGRAPP 14th International Conference on
Computer Graphics Theory and Applications), pages 340-345
ISBN: 978-989-758-354-4
Copyright
c
14th International Conference on Computer Graphics Theory and Applications by SCITEPRESS – Science and Technology Publications, Lda. All rights reserved
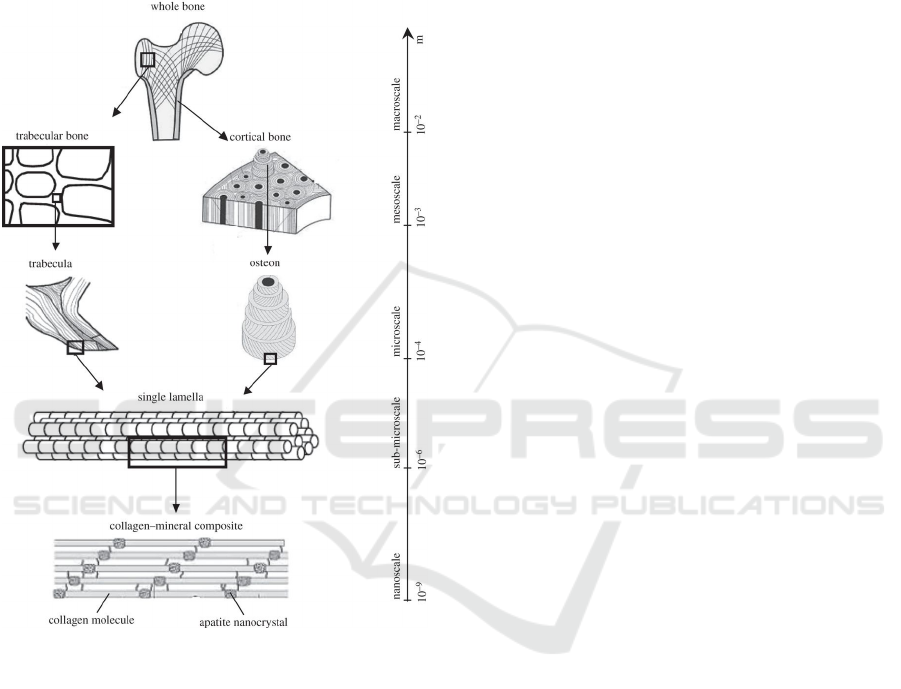
• Microscale: lamellae are assembled to form two
different types of bone tissue: cortical and trabec-
ular.
• Sub-microscale: at this level, collagen fibers are
assembled into sheet-like structures.
• Nanoscale: this level is composed of mineralized
collagen fibers.
Figure 1: Hierarchical structure of the bone, from
macroscale to nanoscale in (Sabet et al., 2015).
Most studies usually focus on predicting the risk
of fracture in a bone or on the influence of mi-
crostructural features on the behaviour of the prop-
agation of a crack through a bone (Ural, 2011).There
seems to be a consensus among the main author on
the fundamental microstructural parameters that influ-
ence fractures such as the percentage of osteonal area
(On.Ar), the density of osteons (On.Dn) and the per-
centage of porosity(Po) (Demirtas et al., 2016; Tong
et al., 2015). Currently, there are no tools to repre-
sent bone tissue and the microscopic structures (mi-
crostructures) that compose it. Therefore, these stud-
ies use approximation of the microstructure, as the
one carried out by Demirtas (Demirtas et al., 2016)
where it uses an approximate representation in which
only the relevant characteristics for its study are in-
cluded, when the importance of their shape is proved
by Raeisi Najafi et al. (Najafi et al., 2007). Some
of the most important microstructures which compose
the cortical bone are osteons, trabeculae, lamellae or
pores, haversian canals, etc. In addition, it must be
borne in mind that the bone structure is not homo-
geneous, so the properties must be determined indi-
vidually according to the structural level taking into
account their involvement at the global level.
2.2 3D Representation of Bone
The irregularity of the cortical bone as well as
some parameters depending on the longitudinal axis
(Gao et al., 2013) of the bone make representation
at macroscale level a fundamental preliminary step
when generating bone tissue. There are many ap-
proaches to obtaining the representation of a bone
structure in three dimensions. All forms of represen-
tation are based on 3d scanning or 2D image analy-
sis. The process to scan a model consists of differ-
ent stages: calibration, scanning, noise removal, scan
alignment and merging of the aligned parts to close
the gaps. Sometimes it is also necessary to close cer-
tain parts manually because of the noise. As for image
analysis, there are different techniques based on the
sheetness measure (Descoteaux et al., 2006), region
growing (Justice et al., 1997) or graph cuts (Boykov
and Funka-Lea, 2006) that allow us to segment and
classify 2D images to obtain a geometric model in
three dimensions. Paulano (Paulano et al., 2014) de-
scribed a method which needs a user to place a seed
within a region that forms a bone. To segment sev-
eral fragments of bone would have to repeat the pro-
cess. After placing the seeds, an algorithm based on
the growth of a 2D region is used for each seed and all
seeds are propagated through the image pile discard-
ing those regions containing a certain noise, in other
words, very small regions. A curvature flow filter is
also applied to each cut before each 2D segmentation
process to smooth the images. This algorithm also re-
solves certain special cases where overgrowth occurs
in the regions.
2.3 Microstructure of Bone Tissue
Our study focuses on the virtual representation of the
cortical part of the bone at microscopic levels. The
two main structural features of the cortical bone are:
the osteons and the Havers canal. There are sev-
eral studies aimed at increasing knowledge of biome-
chanics or the peculiarities of these structures such
as those performed by Britz (Britz et al., 2009) or
Doblar
´
e (Doblar
´
e et al., 2004) which parameters such
Towards the Modelling of Osseous Tissue
341
as the size, shape or distribution of osteons are ana-
lyzed. It is generally accepted that osteons are circu-
lar in cross-section and that deviations of this shape
are attributed to deviations of longitudinal orientation.
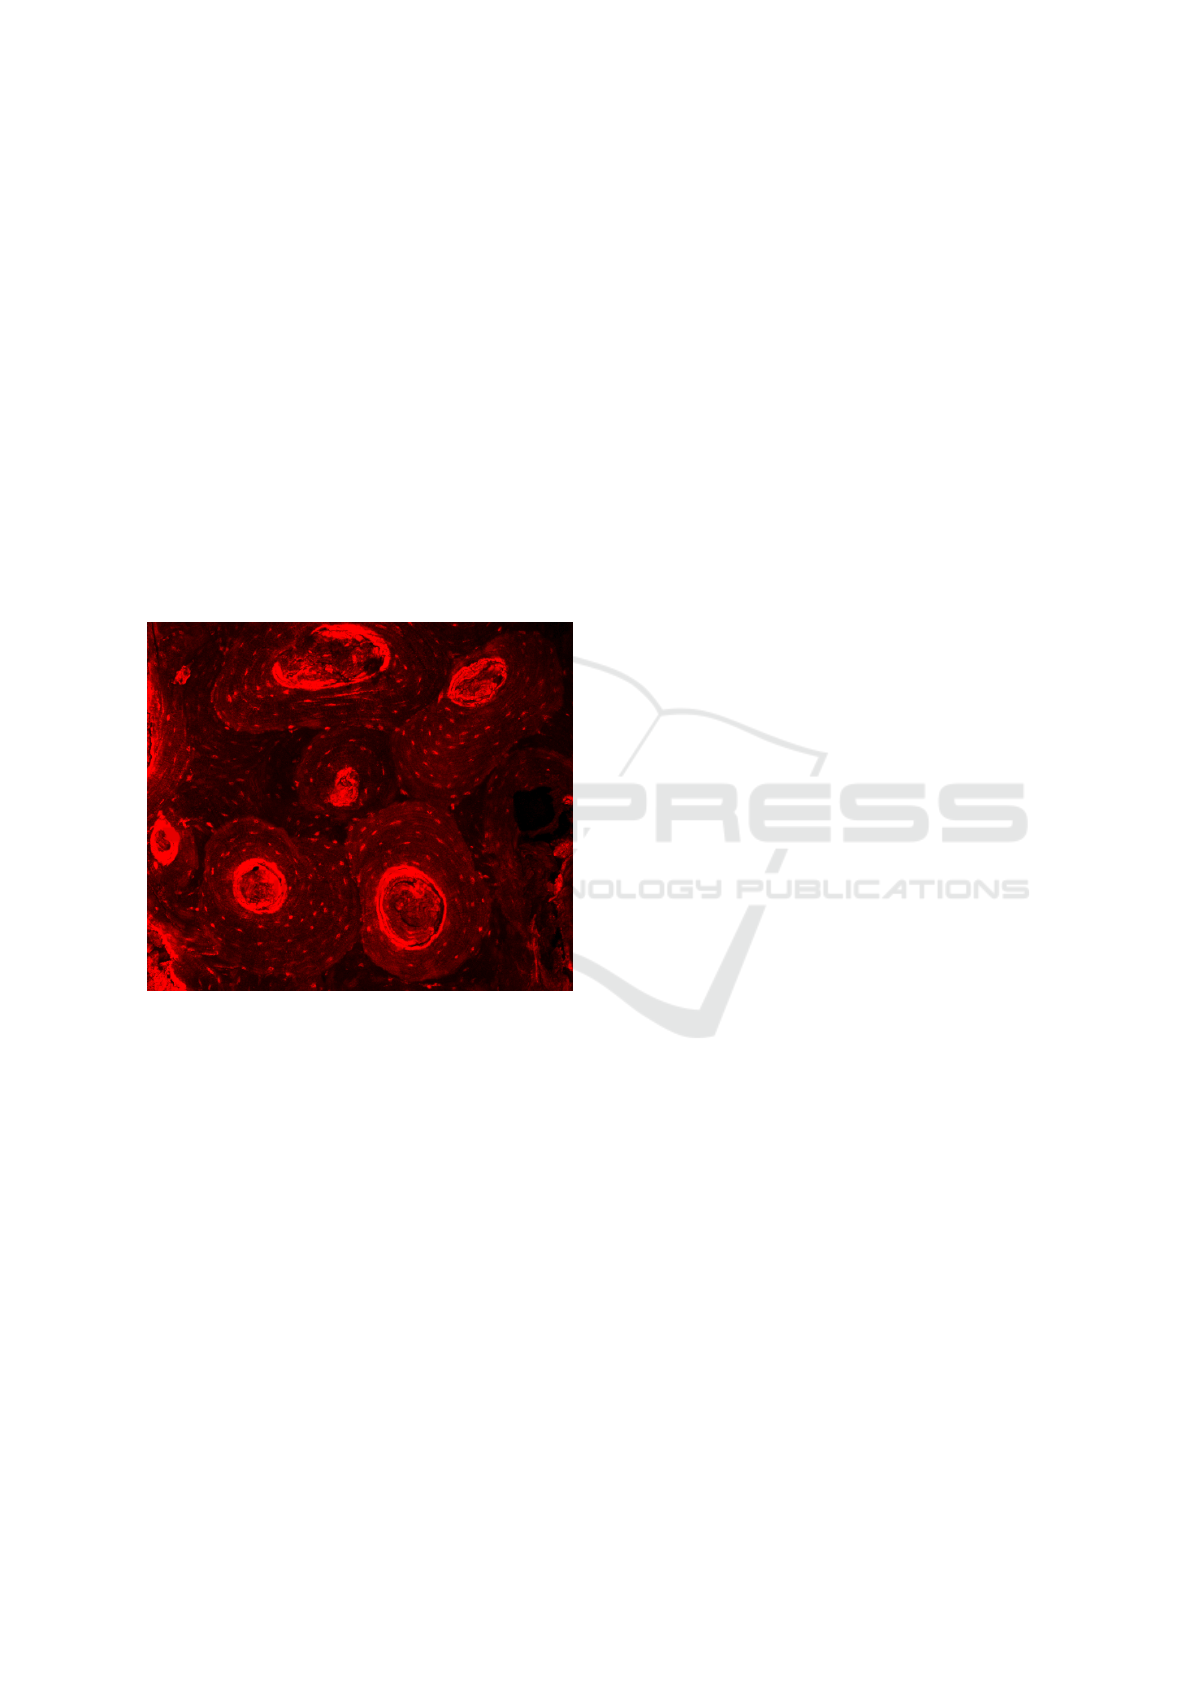
The study conducted by Hennig (Hennig et al., 2015)
shows that osteons are not circular in the cross sec-
tion, but tend to be elliptical in shape, and that there is
no clear way to explain the deviation from the circular
shape(Fig. 2). In the same study, it is also suggested
that parameters such as age most affect the shape of
the osteons regardless of their orientation. Therefore,
the typical and classical idea of representing these
structures as perfect circles is far from their natural
shape. In terms of their distribution, articles such as
written by Gao (Gao et al., 2013) show that osteons
have a random distribution and are embedded in an
interstitial matrix surrounded by a thin layer known
as the cement line.
Figure 2: Computed tomography image (CT).
In most of the studies where CT images have been
used as a reference, the microstructure has been an-
alyzed manually, carrying a slow and tedious pro-
cess for a large volume of data. The work done by
T
¨
ornquist (T
¨
ornquist, 2017), is as similar as we can
find in terms of the virtual representation of bone tis-
sue. T
¨
ornquist performs segmentation, analysis and
modeling of bone tissue through CT images main-
taining the main geometric characteristics and with-
out using approximations as occurs in the studies of
Gao (Gao et al., 2013) and Nobakhti (Nobakhti et al.,
2014) where bone tissue is represented without much
accuracy.
3 MODELLING VIRTUAL BONE
TISSUE
Due to the limitations that currently exist to achieve
advances in the field of health, the generation of vir-
tual bone tissue is a fundamental issue to achieve ad-
vances that are not currently reached due to lack of
data and time. Most of the research at microscopic
levels within the health field focuses on the analysis
of CT 2D and 3D images manually.
3.1 Model Representation
For the generation of virtual bone tissue, it is es-
sential to have good input data. The irregularity of
the bone and the dependence on microstructural fea-
tures such as the distribution of the osteons /cite-
Het1994 or their inclination within the cortical bone
/citeGao2013 make their representation at the macro
level a necessary preliminary step for the generation
of bone tissue. To obtain this representation, we have
studied two different approaches: 3D scanning of a
bone model and segmentation of a bone from CT im-
ages. The biggest problems of the first approach are
the time it takes to perform the scan and the segmen-
tation of the model, the difficulty to have real bones
and that in the model obtained we only have infor-
mation from the external but not the internal corti-
cal part. The second approach solves most of the
problems of the first approach, and although obtain-
ing medical images can be a problem, it is a much
faster, more precise process and allows us to obtain in-
formation about the internal part of the cortical bone.
Paulano (Paulano et al., 2014) conducted a study fo-
cusing on segmentation of fractured bones from CT
images. This study concludes that traditional meth-
ods of segmentation work well for segmentation of
healthy bones, but are unable to identify fractured
bones. Since our input data contain healthy and frac-
tured bones, we have used a method based on 2D re-
gion growing [(Justice et al., 1997),(Fan et al., 2005)],
proposed by Paulano (Paulano et al., 2014), because
the results obtained are better as demonstrated in their
article(Fig. 3).
The segmentation of bone models, besides help-
ing us to generate virtual bone tissue, could also help
us to create a bank of bone fractures using different
methods such as those studied in (P
´
erez et al., 2018)
where the suitability of a library of geometric fractur-
ing is analyzed for the different fracture approaches
of geometric models examined by Paulano (Paulano-
Godino et al., 2017).
GRAPP 14th International Conference on Computer Graphics Theory and Applications - 14th International Conference on Computer
Graphics Theory and Applications
342
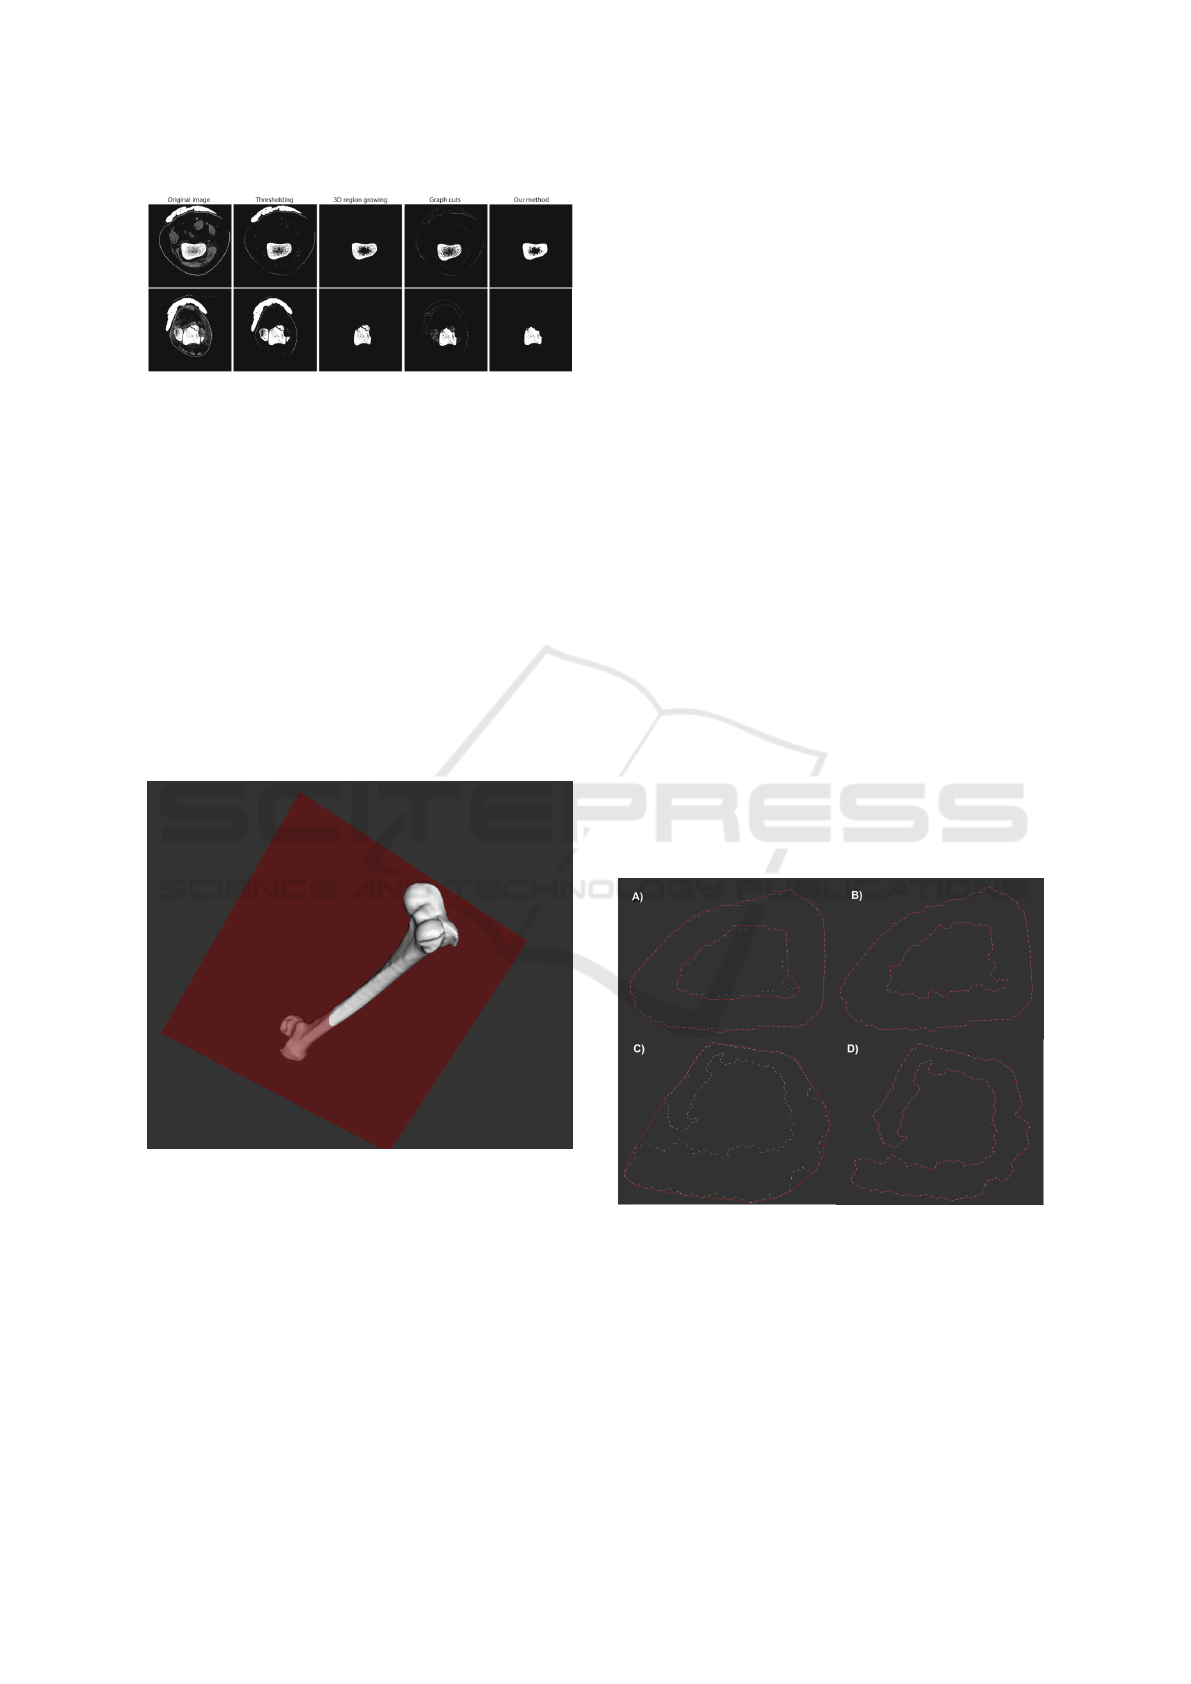
Figure 3: Results obtained by the different methods in
(Paulano et al., 2014). The first row corresponds to a
healthy bone while the second row corresponds to a frac-
tured bone.
3.2 Setting Boundaries
As the automatic generation of all bone tissue from a
bone can be a slow process and most scientific articles
focus on the manual analysis of 2D images, we con-
sider that the generation of virtual bone tissue should
be in 2D. This will allow us to compare the results ob-
tained directly with the values obtained by specialists
when studying bone tissue.Therefore, for the gener-
ation of the tissue we have used a plane to manually
select the area of the bone over which we want to gen-
erate the bone tissue (Fig. 4).
Figure 4: Representation of the bone and the plane to de-
limit the area to be generated.
In order to be able to work in 2D, the points of
contact of the bone and the plane are aligned with
the Z axis by applying a series of simple transforma-
tions. The points of contact between the bone geomet-
ric model and the plane form the inner and outer limits
of the area of the fabric to be generated (Fig. 5). So
we have to use an algorithm to establish which points
form each of the limits like the alpha shape algorithm
[(Edelsbrunner et al., 1983), (Akkiraju et al., 1995)],
based on the extraction of polygons from a cloud of
points. The criterion used to obtain the smallest value
with which the algorithm is capable of detecting both
parts has been to start from the mean distance between
the different points forming the collision zone and re-
duce the value iteratively by a percentage established
by default at 1. The problem with this approach is
that it greatly decreases the precision of the areas de-
limiting the cortical part of the bone and is not valid
for obtaining limits in areas where the bone is frac-
tured (Fig. 5c). Therefore, the criterion that we have
followed has been the union of the adjacent points
by distances. In some cases it may be necessary to
manually clean some points, which would cause a cer-
tain loss of precision, but the morphology of a natural
bone and the process to virtualize it followed through-
out this article make this type of cases very isolated.
To determine the points that form part of the different
limits that can form part of the virtual bone tissue, we
have used the smallest value that the alpha shape algo-
rithm needs to generate two polygons. From the outer
limit of the bone structure calculated with the alpha
shape algorithm and this value, we can delimit which
points are within and out of range, thus generating the
inner and outer limits. As can be seen in (Fig. 5), the
algorithm used improves precision and has no prob-
lems when it comes to delimiting the limits for gener-
ating bone tissue in fractured areas. This will allow us
to obtain measurements of greater weight compared
to other studies based on approximate representations.
Figure 5: Comparison between the results obtained with the
alpha shape algorithm(A,C) and with our method(B,d). Im-
ages A and B correspond to a healthy bone while images C
and D correspond to a fractured area. The white dots are ob-
tained by projecting the areas of contact between the bone
and the plane while the red lines delimit the contour of the
area where the bone tissue will be generated.
Once the limits have been established, we can take
the next step in our research and focus on the cre-
ation of the different microstructures that make up the
Towards the Modelling of Osseous Tissue
343
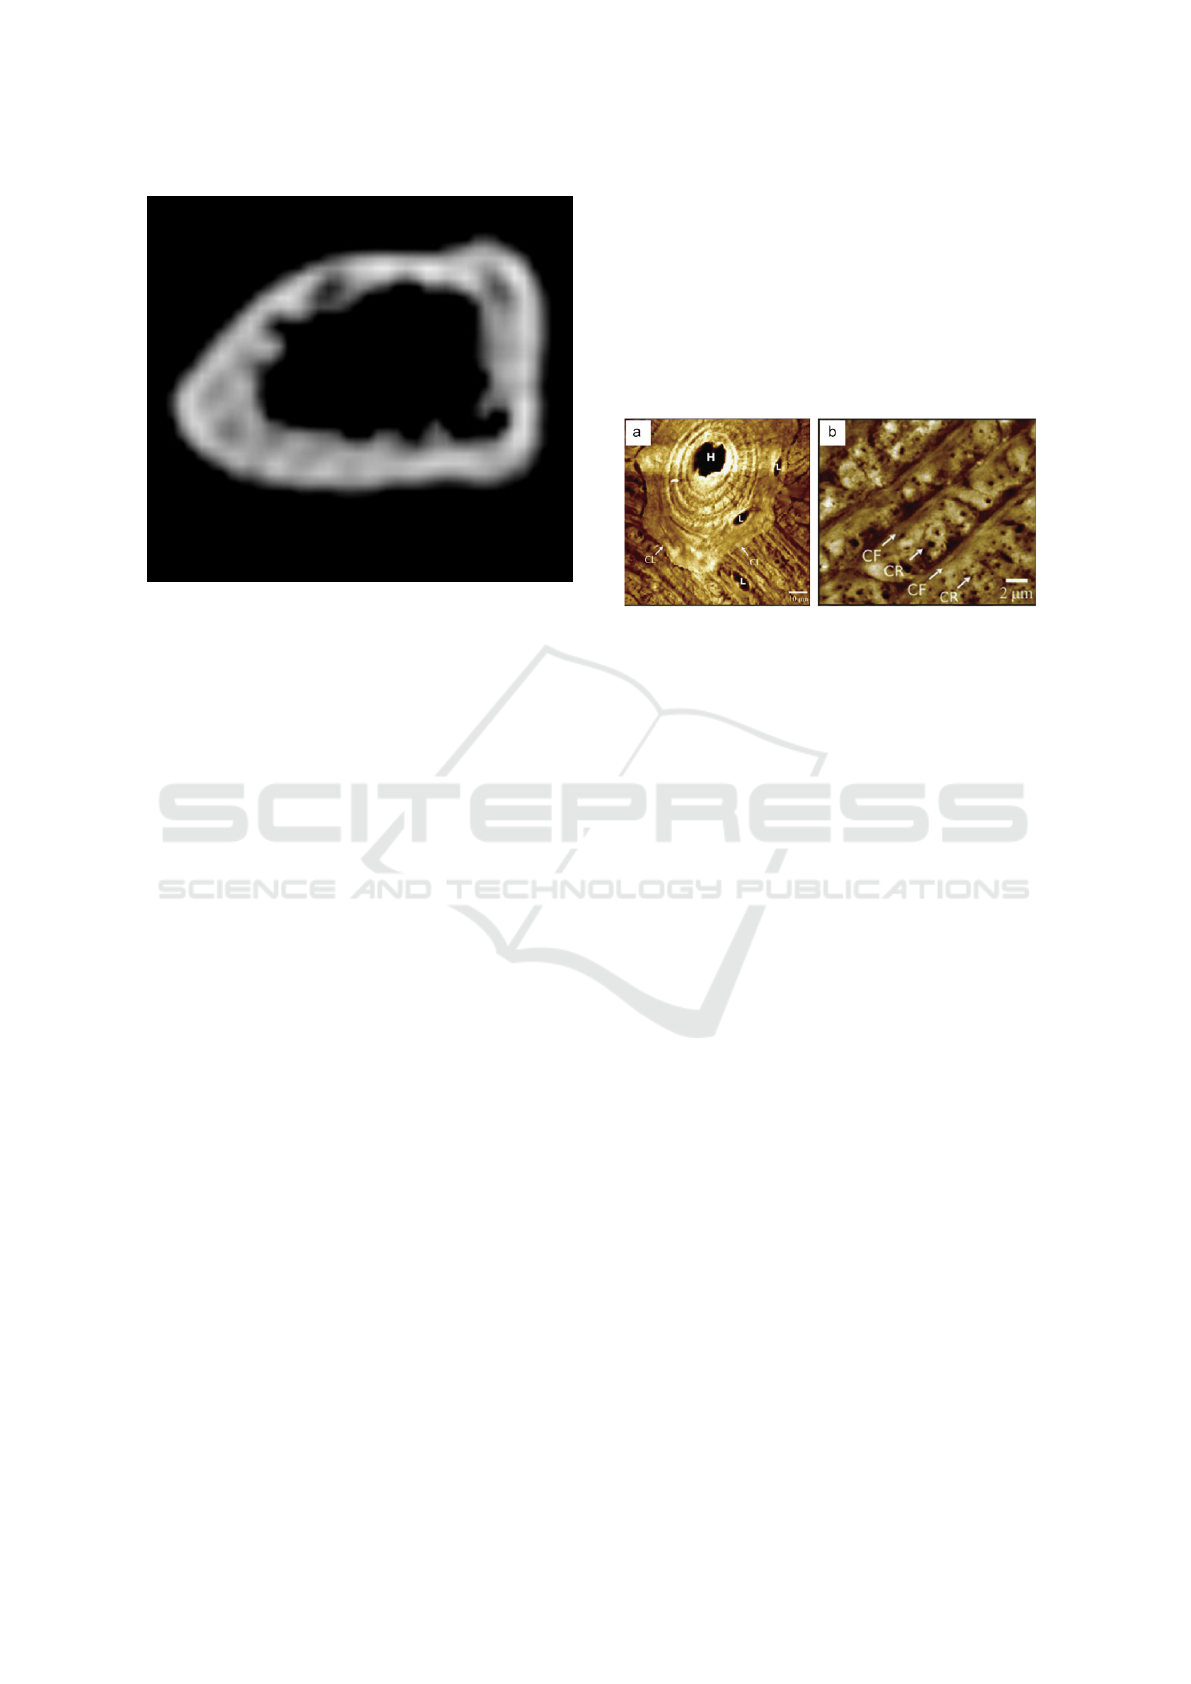
Figure 6: CT image used to obtain the model with which
tests have been carried out.
bones, taking into account all their characteristic fea-
tures, without using perfect or accepted forms that
may cause changes in the morphology of the bone
structure, and thus achieve the creation of a quality
virtual bone tissue that facilitates future research. Our
study could be validated since we limit ourselves to
the use of real medical images of human bones, so
the geometric models we use are replicas as similar
as possible to the real ones. Figure 7 (Fig. 6) cor-
responds to an image of the computed axial tomog-
raphy scan (CAT) used to recreate one of the models
used throughout this study. As can be seen, the limits
of the bone are almost identical those obtained by the
study in figure (Fig. 5d).
3.3 Microstructure Modelling
Most studies study the modelling of microstructures
at sub-microscale and smaller scales which collagen
fibers are assembled into sheet-like structures. In this
section we will focus on the different characteristics
and inputs that must be taken into account for the rep-
resentation of the cortical bone tissue at microscopic
levels. Osteons are the most important structure of
the compact bone. The shape of the osteons is a key
point in studies of the spread of fractures through the
cortical bone (Najafi et al., 2007). They consist of a
series of concentric layers called lamellae, which sur-
rounding a central canal, which is a cavity through
which blood vessels and nerves pass, known as the
Havers canal. Osteons are limited by a line known
as the cement line that separates them from the rest
of the bone tissue. The part of the osseous tissue be-
tween two osteons is formed by some layers known
as interstitial laminae. These parameters can be stud-
ied through image analysis such as the study about
bone porosity by Cardoso (Cardoso et al., 2013) or
the study conducted by Lin (Lin and Xu, 2010) that
focused on the analysis of the lacunar-canalicular net-
work (Fig. 7). Although they do not focus on the
microstructures that make up the bone tissue directly,
their different characteristics are studied due to their
importance and involvement in them.
Figure 7: Microscopic images of the osseous structures ob-
tained from Cardoso’s study (Cardoso et al., 2013) Labels in
panel a indicate the Haversian canal (H), lacuna (L), and ce-
ment line (CL). In panel b, canaliculi rich (CR) and canali-
culi free (CF) areas are distinguished.
For the representation of the virtual osseous tissue
it is necessary to know the characteristics of different
elements that compose the tissue. In addition to geo-
metrical parameters such as dimensions, shape or dis-
tribution of them, it is necessary to know other param-
eters such as porosity (Po), osteons density(On.Dn),
osteonal area (On.Ar), tissue volume (TV), canal vol-
ume (Ca.V) or bone volume(BV) as demonstrated in
the studies of Demirtas or Tong (Demirtas et al., 2016;
Tong et al., 2015) . These parameters are key to ob-
taining a realistic tissue as well as for its study in
fields such as fracturing. So, to represent the vir-
tual osseous tissue realistically, it is necessary to go
beyond the geometric representation of the structures
allowing it to be useful and to replace the basis for
future research.
4 CONCLUSIONS
The generation of virtual bone tissue is an unexplored
field. There are many studies that focus on micro-
scopic analysis of bones. In these studies, manual
analysis of CT images is performed. The develop-
ment of a virtual bone generation tool can help signif-
icantly reduce the time spent analyzing microscopic
images of bones and provide more information for
further analysis. In addition, most of the geometric
representations that exist on the bone tissue, use ap-
proximations and do not follow the standards that are
GRAPP 14th International Conference on Computer Graphics Theory and Applications - 14th International Conference on Computer
Graphics Theory and Applications
344

used within traumatology, so their validity when rep-
resenting these microstructures remain in no man’s
land and can not be exploited by specialists. This
study aims to lay the foundations for the virtual gener-
ation of bone tissue not only from a geometric point of
view, but also from a medical point of view. The study
of the segmentation of the bone model, how it should
be generated in order to evaluate and compare it later,
and the establishment of a series of limits serve as a
starting point for achieving this ambitious objective.
For the future it would be interesting to generate the
different microstructures that make up the bone tis-
sue taking into account all those elements that are
scientifically relevant such as the different measures
used. What other types of structural parameters could
be included to make the tissue generated more useful
within the different fields of study?
ACKNOWLEDGEMENTS
This work has been subsidized by the Ministry of
Economy and Competitiveness and the European
Union (via ERDF funds) through the research project.
DPI2015-65123-R.
REFERENCES
Akkiraju, N., Edelsbrunner, H., Facello, M., Fu, P., Mucke,
E., and Varela, C. (1995). Alpha shapes: definition
and software. IEEE Transactions on Information The-
ory, 63(1):66–70.
Boykov, Y. and Funka-Lea, G. (2006). Graph cuts and effi-
cient n-d image segmentation.
Britz, H. M., Thomas, C. D. L., Clement, J. G., and Cooper,
D. M. (2009). The relation of femoral osteon geome-
try to age, sex, height and weight. Bone, 45(1):77–83.
Cardoso, L., Fritton, S. P., Gailani, G., Benalla, M., and
Cowin, S. C. (2013). Advances in assessment of bone
porosity, permeability and interstitial fluid flow. Jour-
nal of Biomechanics, 46(2):253–265.
Demirtas, A., Curran, E., and Ural, A. (2016). Assessment
of the effect of reduced compositional heterogeneity
on fracture resistance of human cortical bone using
finite element modeling. Bone, 91:92–101.
Descoteaux, M., Audette, M., Chinzei, K., and Siddiqi, K.
(2006). Bone enhancement filtering: Application to
sinus bone segmentation and simulation of pituitary
surgery. Computer Aided Surgery, 11(5):247–255.
Doblar
´
e, M., Garc
´
ıa, J., and G
´
omez, M. (2004). Modelling
bone tissue fracture and healing: a review. Engineer-
ing Fracture Mechanics, 71(13-14):1809–1840.
Edelsbrunner, H., Kirkpatrick, D., and Seidel, R. (1983).
On the shape of a set of points in the plane. IEEE
Transactions on Information Theory, 29(4):551–559.
Fan, J., Zeng, G., Body, M., and Hacid, M.-S. (2005).
Seeded region growing: an extensive and comparative
study. Pattern Recognition Letters, 26(8):1139–1156.
Gao, X., Li, S., Adel-Wahab, A., and Silberschmidt, V.
(2013). Effect of random microstructure on crack
propagation in cortical bone tissue under dynamic
loading. Journal of Physics: Conference Series,
451:012033.
Hennig, C., Thomas, C. D. L., Clement, J. G., and Cooper,
D. M. L. (2015). Does 3d orientation account for vari-
ation in osteon morphology assessed by 2d histology?
Journal of Anatomy, 227(4):497–505.
Justice, R., Stokely, E., Strobel, J., Ideker, R., and Smith, W.
(1997). Medical image segmentation using 3d seeded
region grow-ing. Medical Imaging 1997: Image Pro-
cessing, 3034:900–910.
Lin, Y. and Xu, S. (2010). AFM analysis of the lacunar-
canalicular network in demineralized compact bone.
Journal of Microscopy, 241(3):291–302.
Najafi, A. R., Arshi, A., Eslami, M., Fariborz, S., and
Moeinzadeh, M. (2007). Micromechanics fracture in
osteonal cortical bone: A study of the interactions
between microcrack propagation, microstructure and
the material properties. Journal of Biomechanics,
40(12):2788–2795.
Nobakhti, S., Limbert, G., and Thurner, P. J. (2014). Ce-
ment lines and interlamellar areas in compact bone
as strain amplifiers – contributors to elasticity, frac-
ture toughness and mechanotransduction. Journal of
the Mechanical Behavior of Biomedical Materials,
29:235–251.
Paulano, F., Jim
´
enez, J. J., and Pulido, R. (2014). 3d seg-
mentation and labeling of fractured bone from CT im-
ages. The Visual Computer, 30(6-8):939–948.
Paulano-Godino, F., Jim
´
enez-P
´
erez, J. R., and Jim
´
enez-
Delgado, J. J. (2017). Issues on the simulation of geo-
metric fractures of bone models. In VipIMAGE 2017,
pages 467–475. Springer International Publishing.
P
´
erez, F. D., Jim
´
enez, J. J., and Jim
´
enez, J. R. (2018).
Blast Features and Requirements for Fracturing Os-
seous Models. In Garc
´
ıa-Fern
´
andez, I. and Ure
˜
na,
C., editors, Spanish Computer Graphics Conference
(CEIG). The Eurographics Association.
Sabet, F. A., Najafi, A. R., Hamed, E., and Jasiuk, I.
(2015). Modelling of bone fracture and strength at
different length scales: a review. Interface Focus,
6(1):20150055.
Tong, X., Burton, I. S., Isaksson, H., Jurvelin, J. S., and
Kr
¨
oger, H. (2015). Cortical bone histomorphome-
try in male femoral neck: The investigation of age-
association and regional differences. Calcified Tissue
International, 96(4):295–306.
T
¨
ornquist, E. (2017). Segmentation, analysis, and mod-
elling of microstructure in cortical bone, based on x-
ray microtomography. Student Paper.
Ural, A. (2011). Cohesive modeling of bone fracture at mul-
tiple scales. Procedia Engineering, 10:2827–2832.
Towards the Modelling of Osseous Tissue
345
