
Towards a Single Solution for Polyp Detection, Localization and
Segmentation in Colonoscopy Images
Willem Dijkstra
1
, Andr
´
e Sobiecki
1,2
, Jorge Bernal
3
and Alexandru C. Telea
2
1
Bernoulli Institute, University of Groningen, The Netherlands
2
ZiuZ Visual Intelligence, Gorredijk, The Netherlands
3
Image Sequence Evaluation laboratory, Computer Vision Center and Universitat Aut
´
onoma de Barcelona, Spain
Keywords:
Machine Learning, CNNs, Polyp Detection, Polyp Segmentation, Colonoscopy.
Abstract:
Colorectal cancer is one of the main causes of cancer death worldwide. Early detection of its precursor
lesion, the polyp, is key to ensure patient survival. Despite its gold standard status, colonoscopy presents
some drawbacks such as polyp misses. While several computer-based solutions in this direction have been
proposed, there is no available solution tackling lesion detection, localization and segmentation at once. We
present in this paper a one-shot solution to characterize polyps in colonoscopy images. Our method uses
a fully convolutional neural network model for semantic segmentation. Next, we apply transfer learning
to provide detection and localization. We tested our method on several public datasets showing promising
results, including compliance with technical and clinical requirements needed for an efficient deployment in
the exploration room.
1 INTRODUCTION
Colorectal cancer (CRC) is the second leading cause
of cancer death in the USA and is estimated to
have caused 50260 deaths in 2017 only, according
to American Cancer Society (Siegel et al., 2017).
Most CRCs develop from adenomatous polyps that
can appear anywhere in the colon. Early detec-
tion and removal of polyps is of great significance
when performing colonoscopy for prevention and
timely treatment of CRC. However, the average polyp
miss-rate in colonoscopy is estimated to be up to
25% (Leufkens et al., 2012). Missing polyps can
lead to a late diagnosis of CRC with low survival
rates (Rabeneck et al., 2003).
Computational systems can assist clinicians in
polyp detection and thus decrease the polyp miss-rate.
However, automatic polyp detection in colonoscopy
videos is very challenging due to high variations in
polyp appearance (size, colour, shape, texture) and the
presence of other endoluminal scene structures (e.g.,
colon walls, specular highlights and air bubbles).
In the past few decades, many algorithms have
been developed to automate the detection, localiza-
tion, and segmentation of polyps in colonoscopy im-
ages. Significant progress has been made in recent
years. End-to-end learning methods seem to give the
best results for automatic detection and localization of
polyps (Bernal et al., 2017). Polyp segmentation has
not attracted yet the same level of attention. However,
segmentation has an advantage over detection and lo-
calization, as it also gives information about a polyp’s
shape and it could be used as a preliminary stage for
in-vivo diagnosis.
We propose in this paper to use polyp segmen-
tation as the main output from which polyp detec-
tion and localization can be derived. Our proposal
is based on a convolutional neural network (CNN), in
our case a residual network (ResNet50). We validate
our method against several publicly available datasets
for detection, localization and/or segmentation.
2 RELATED WORK
Existing algorithms for polyp characterization can
be grouped in three categories (Bernal et al., 2017):
hand-crafted features, end-to-end learning, and hy-
brid, as follows. For each method class, we also list
its comparative advantages and limitations.
616
Dijkstra, W., Sobiecki, A., Bernal, J. and Telea, A.
Towards a Single Solution for Polyp Detection, Localization and Segmentation in Colonoscopy Images.
DOI: 10.5220/0007694906160625
In Proceedings of the 14th International Joint Conference on Computer Vision, Imaging and Computer Graphics Theory and Applications (VISIGRAPP 2019), pages 616-625
ISBN: 978-989-758-354-4
Copyright
c
2019 by SCITEPRESS – Science and Technology Publications, Lda. All rights reserved
2.1 Hand-crafted Features
These methods are based on the extraction of features
(based on shape, color, or texture) from the image that
are explicitly defined by the user. Such features are
next fed into a ML system that provides the desired
inference (e.g., classification or segmentation) based
on a mix of user-specified and learned parameter
values.
Advantages:
• no (large) training dataset is needed;
• if strongly discriminating features of an object are
explicitly known (e.g. colour or shape), extracting
the object is relatively easy and computationally
efficient;
Disadvantages:
• specialist experts are needed for feature design;
• no single hand-crafted feature might solve the
problem, so multiple hand-crafted features are
typically needed. Finding the right mix and set-
tings of such a feature set is challenging.
2.2 End-to-end Learning
End-to-end learning systems, such as neural net-
works, merge all intermediate stages present in
classical ML systems, such as data preprocessing,
feature engineering and extraction, and actual in-
ference. Inference is done exclusively based on
(internal) parameters which are learned from a
training set.
Advantages:
• once correctly set up (trained), such systems can
deliver very high accuracy at high speed, and with
limited or no user intervention;
Disadvantages:
• large amounts of (labeled) training data is needed;
• little control exists over how the system learns to
infer;
• training can be computationally expensive;
• understanding how these systems infer can be
hard.
2.3 Hybrid Approaches
Hybrid methods combine hand-crafted features
(mainly to provide a first rough object detec-
tion) with end-to-end learning (to discrimi-
nate those detected objects likely to be polyps).
Advantages:
• aim to get the best of ‘both worlds’ (hand-crafted
features and end-to-end learning), thus requiring
less training effort;
Disadvantages:
• the amount of required training data can still be
large;
• parameter tuning can be hard.
Following the above, we have produced a sur-
vey that organizes methods for polyp detection, local-
ization, and segmentation along the aforementioned
three method classes. Tables 1 and 2 show the identi-
fied methods. For each method, we indicate the types
of used features, ML technique it is based on, and
amount of data the method was tested with. Next, we
rank each method along two desirable criteria – val-
idation (V) and reproducibility (R) – using a 5-point
ordinal Likert scale (−−,−,+/−,+,++). As visi-
ble from this survey, no single method scores well on
both criteria for all three tasks of polyp detection, lo-
calization, and segmentation.
3 PROPOSED METHOD
Architecture: For polyp semantic segmentation,
we propose to use Fully Convolutional Networks
(FCNs), implemented with Keras and TensorFlow.
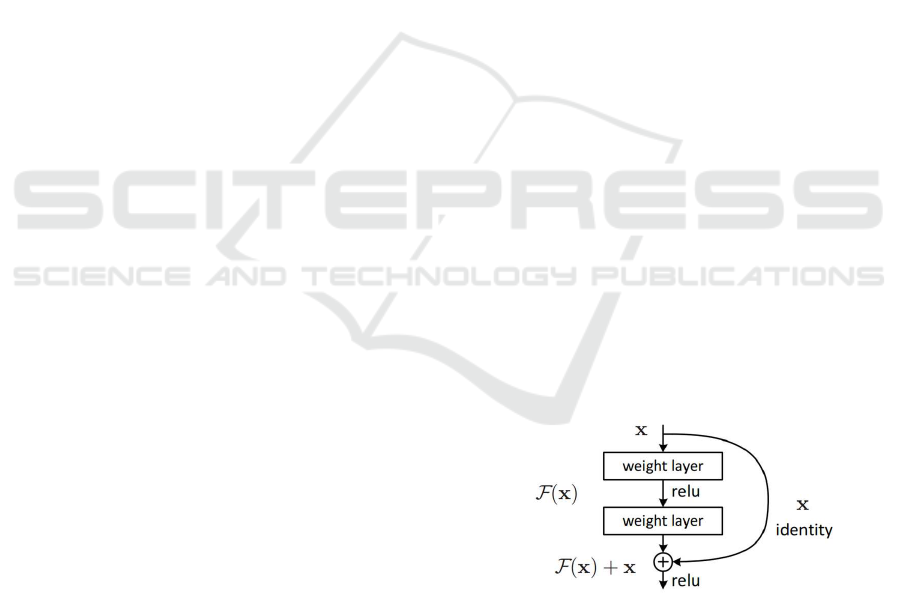
In traditional CNNs, an operating block would
compute from am input x an output F(x) which is
a completely new representation that does not keep
any information about the input x. In contrast, FCNs
compute a ‘delta’ or slight change x + F(x) of the
original input x (Fig. 1). It is proved that training
Figure 1: A residual block (He et al., 2016).
this form of networks (FCNs) is easier than training
general CNNs. Also, FCNs resolve better the issue
of degrading accuracy (He et al., 2016). We use
ResNet50 which specifically is a residual network
which consists of 50 layers. We next outline the
optimization and training of the network. Table 3
gives an overview of all relevant parameters.
Towards a Single Solution for Polyp Detection, Localization and Segmentation in Colonoscopy Images
617
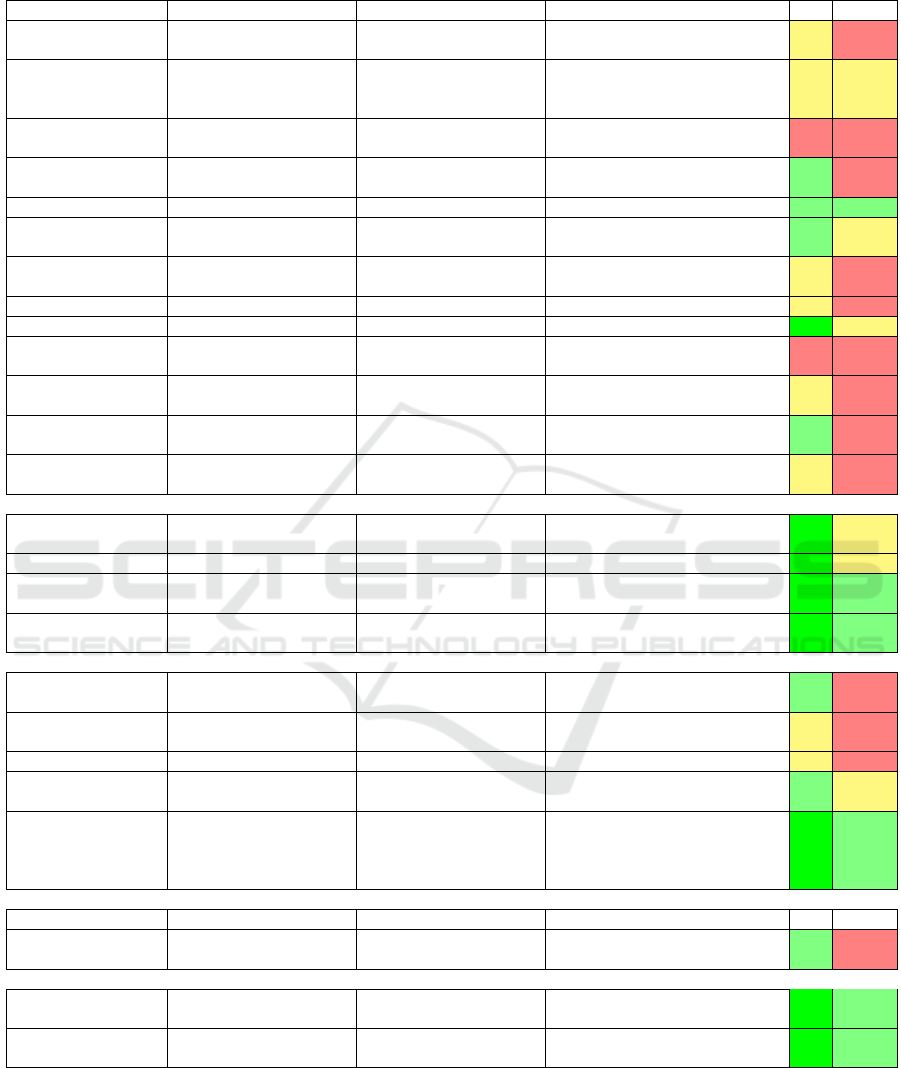
Table 1: Comparison of different methods for polyp detection. V = Validation and R = Reproducibility.
POLYP DETECTION Hand-crafted features
Method Descriptors Features Classification Database V R
(Tjoa and Krishnan,
2003)
Texture spectrum, color
histograms
NN
12 images (no-polyp) and 54 images
(polyp)
+/- -
(Dhandra et al., 2006)
Number of regions after
morphological watershed
segmentation
-
50 images (no-polyp) and 50 images
(polyps)
+/- +/-
(Hwang et al., 2007)
Curve direction, curvature,
edge distance, intensity
- 27 images (polyps) - -
(Alexandre et al., 2007)
RGB-values and coordinates
of each pixel
SVM 35 images + -
(Alexandre et al., 2008) Color and position features SVM with REF kernel 4600 images from 35 videos + +
(Karargyris and
Bourbakis, 2009)
Curvature features
Based on segmentation from
log-Gabor and SUSAM
40 images without polyp, 10 images
with polyp
+ +/-
(Hwang and Celebi,
2010)
Geometric feature Rule based 128 images +/- -
(Eskandari et al., 2012) Geometric feature Rule based 18 images +/- -
(Wang et al., 2014) Edge profiles SVM, GLM 1513 images ++ +/-
(Zhou et al., 2014) Statistical information SVM
359 VCE frames 294 for training and 65
for testing (performance)
- -
(Mamonov et al., 2014) Radios best fit ball Binary classifier
Total 18968 images with 18738 images
without and 230 images with polyps
+/- -
(Iakovidis and
Koulaouzidis, 2014)
Color features around SURF
points
SVM 137 images + -
(Ratheesh et al., 2016)
HSV thresholding, Markovian
Random Field
SVM 10 Videos of each 2100 frames +/- -
End-to-end learning
(Tajbakhsh et al., 2015) Learned features (CNN) Voting
7,000 frames with polyps and 28,000
frames with no polyps
++ +/-
(Yu et al., 2017) Learning features (3D - FCN ) - ASU-Mayo ++ +/-
(OUS) (Bernal et al.,
2017)
Learning features (CNN) Sliding-window strategy
CVC-CLINIC, ETIS-LARIB,
ASU-Mayo
++ +
(CUMED) (Bernal et al.,
2017)
Learning features (CNN) Pixel-wise
CVC-CLINIC, ETIS-LARIB,
ASU-Mayo
++ +
Hybrid methods
(Maroulis et al., 2003)
GLCM-features and discrete
wavelet transform in CoLD
ANN - + -
(Karkanis et al., 2003)
Color wavelet covariance
(CWC)
-
2 images (no-polyp) and 4 images
(polyp)
+/- -
(Magoulas et al., 2004) GLCM-features NN - +/- -
(Iakovidis et al., 2005)
Color wavelet covariance
(CWC)
LDA 1380 images + +/-
(Silva et al., 2014)
(ETIS-LARIB) (Bernal
et al., 2017)
ROI, based on shape and size
features; hough transform
(detection), Texture analysis
Ad-hoc classifier
(boosting-based learning
process (co-ocurrence
matrix))
CVC-CLINIC, ASU-Mayo ++ +
POLYP SEGMENTATION Hand-crafted features
Method Descriptors Features Classification Database V R
(Ganz et al., 2012)
(Shape-UCM)
Boundary detection and
segmentation
-
Two datasets (58 images for training, 87
images for testing)
+ -
End-to-end learning
(V
´
azquez et al., 2017) Learned features (CNN) Tune an existing classifier
CVC-ColonDB, CVC-ClinicDB,
CVC-EndoSceneStill
++ +
(Brandao et al., 2017) Learned features (CNN) Tune an existing classifier
CVC-ClinicDB, ETIS-LARIB,
ASU-Mayo
++ +
Optimizer: To optimize our network, we use the
well-known Adam optimizer (Kingma and Ba, 2014).
Adam is an optimizer that converges fast due to using
a larger effective step size. The disadvantage with
this optimization algorithm, however, is that it is
computational expensive as it uses moving averages
of the parameters.
GIANA 2019 - Special Session on GastroIntestinal Image Analysis
618
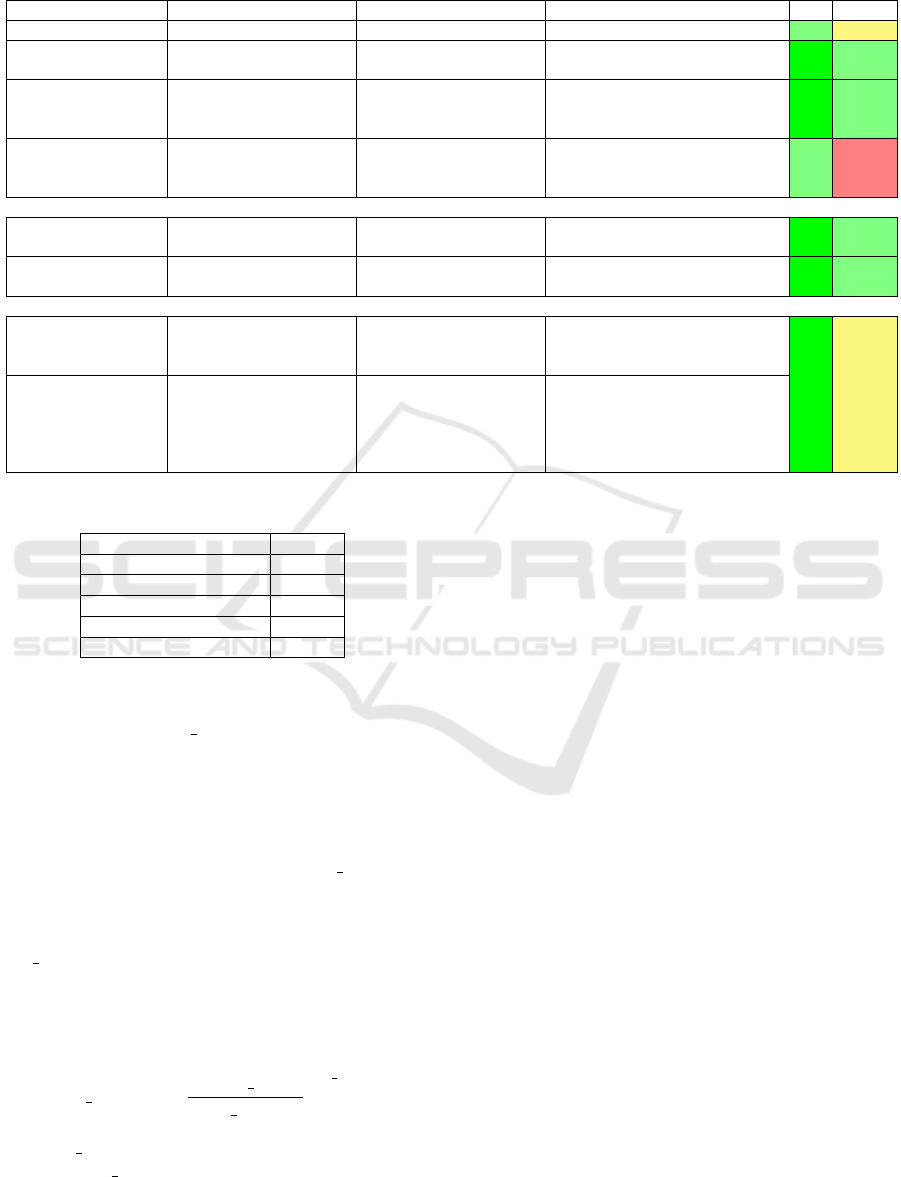
Table 2: Comparison of different methods for polyp localization and segmentation. V = Validation and R = Reproducibility.
POLYP LOCALIZATION Hand-crafted features
Method Descriptors Features Classification Database V R
(Park et al., 2012) Eigen-space representation CRF 35 videos (1.2-25 million frames) + +/-
(Tajbakhsh et al., 2014)
ID discrete cosine transform
(DCT)
Random Forest classifier CVC-ColonDB ++ +
(Bernal et al., 2015)
(CVC-CLINIC) (Bernal
et al., 2017)
Protruding surfaces,
boundaries defined from
intensity valleys detection
Continuity, completeness,
concavity and robustness
against spurious structures
CVC-CLINIC, ETIS-LARIB,
ASU-Mayo
++ +
(Tarik et al., 2016)
ROI’s based on Gaussian
Mixture Model, Esperance
Maximization
- 100 images of different types of polyps + -
End-to-end learning
(SNU) (Bernal et al.,
2017)
Learning features (CNN) Binary classifier
CVC-CLINIC, ETIS-LARIB,
ASU-Mayo
++ +
(UNS-UCLAN) (Bernal
et al., 2017)
Learning features (CNN) Multilayer perceptron (MLP) CVC-CLINIC ++ +
Hybrid methods
(Tajbakhsh et al., 2016)
(ASU) (Bernal et al.,
2017)
Geometric features, Ensemble
of CNNs
Voting ETIS-LARIB ++ +/-
- (PLS) (Bernal et al.,
2017)
Global image features
(detection), Sequence of
preprocessing filters
(localization)
Means of the maximum
values in the energy map
computed using the elliptical
shape of the polyp’s usual
appearance
CVC-CLINIC, ASU-Mayo,
ETIS-LARIB
++ +/-
Table 3: Training parameters used by our network.
Parameter Value
Maximum epochs 250
Learning rate base 0.0001
Learning rate power 0.9
Batch size 5
Batchnorm momentum 0.9
Early Stopping: We set the maximum number of
training epochs to max epochs = 250. However, in
order to prevent the network from overfitting, we use
early stopping. This technique monitors a specified
metric and stops network training when its loss is
not decreasing. Early stopping requires two param-
eters: (1) the minimum change in the monitored met-
ric that qualifies as an improvement (min delta) and
(2) the number of epochs with no improvement af-
ter which training is stopped (patience). In our ex-
periments, we set the metric to be monitored with
min delta = 0.0001 and patience = 25.
Learning Rate: During training, we slowly de-
crease the learning rate lr as
lr = lr base ·
1 −
current epoch
max epochs
lr power
(1)
where lr base, the starting learning rate, is set to
0.0001 and lr power = 0.9.
Data Augmentation: We propose to apply data aug-
mentation as previous studies show that it leads to bet-
ter results in terms of mean Jaccard and mean global
accuracy (V
´
azquez et al., 2017). We use the follow-
ing types of data augmentation: (1) image zoom (from
0.9 to 1.1), (2) image random cropping, (3) image ro-
tation (from 0 deg to 180 deg), and (4) image shear
(from 0 to 0.4).
Post-processing: As a last stage, we postprocess
the resulting segmentation masks aiming to increase
the quality of the results. We have tested two specific
methods: (1) fill holes in the resulting masks and (2)
compute convex hulls of the masks.
4 EXPERIMENTAL SETUP
We next describe the experimental setup used to train
and validate the FCN model. This consists of metrics
used for quality measurement (Sec. 4.1) and datasets
used for training and testing (Sec. 4.2). As men-
tioned before, we address the problem of polyp char-
acterization as a segmentation problem, since seg-
mentation also gives information about the shape of a
polyp. Hence, our model outputs a binary segmenta-
tion mask. From this mask, we derive polyp detection
and localization.
Towards a Single Solution for Polyp Detection, Localization and Segmentation in Colonoscopy Images
619

4.1 Performance Metrics
We evaluate polyp segmentation using the Jaccard in-
dex (V
´
azquez et al., 2017) and the S
¨
orensen-Dice co-
efficient (V
´
azquez et al., 2017). With respect to polyp
detection and localization, we follow the guidelines
in (Bernal et al., 2017): We compare the output of
the segmentation to the ground truth (labeled image):
For detection, we only care about the presence of a
mask in the ground truth to account for frame-based
metrics. For polyp localization, we also consider the
position of the output. A true positive in polyp de-
tection occurs when the segmentation output overlaps
with the ground-truth mask. A true positive in polyp
localization occurs when the centroid of the output
segmentation mask should falls within the ground-
truth mask. It is worth to mention that only one true
positive is accounted for each polyp, whereas many
false positives can appear in a single image. Once
frame-based metrics are defined, we can easily cal-
culate aggregated metrics such as Precision, Recall,
Specificity, Accuracy, and F-scores.
4.2 Datasets
We employ two criteria when considering the use of a
specific dataset for training/validation: (1) the dataset
should be publicly available and (2) the dataset should
have been properly annotated. Considering this,
we use in our experiments several public datasets
that have been presented in the context of MICCAI
challenges on Automatic Polyp Detection and Gas-
trointestinal Image Analysis. For standard defini-
tion (SD) images, we use the CVC-EndosceneStill
dataset (V
´
azquez et al., 2017) for still frame analy-
sis. With respect to video analyis, we use the training
subset of CVC-VideoClinicDB (Bernal et al., 2018)
for network training and the first 9 videos of the test-
ing set using the results provided by the online eval-
uation tool prepared by challenger organizers. For
high definition (HD) images, we use the ETIS-Larib
dataset (Bernal et al., 2017). It has to be noted that,
in the CVC-VideoClinicDB dataset, the ground truth
represents an approximation of the polyp in the image
using ellipses. Given this, the model trained by this
dataset is evaluated against detection and localization
metrics instead of segmentation ones.
5 RESULTS
5.1 Polyp Segmentation
Table 4 overviews our experiments regarding polyp
segmentation. They consist of four experiments
(1..4). In each one, a different database is used for
training the network. In all experiments, we use 80%
of the dataset for training, and the remaining 20% for
validation. Note that the ETIS-Larib database is used
in two different ways: For experiment 1.2, we use the
original images. For experiment 2, we resize these to
50% while keeping the aspect ratio. This resizing is
performed aiming to avoid impact of image resolution
differences in method performance.
Figure 2 shows various resulting segmentations
given by the trained model. As visible, polyps of quite
different shapes, locations, orientations, colors, and
lighting are segmented well.
Figure 3 shows the Jaccard index boxplots for ex-
periments 1.1 and 2. We can infer that resizing has a
significant influence on the segmentation mask qual-
ity, as the resulting Jaccard index seems to be signif-
icantly higher than of the original size dataset. The
DICE coefficient follows the same trend. It should
be noted, however, that the standard deviation of the
resized results is also higher. This is probably due
to the fact that the network is trained with SD data,
whereas the testing HD data captures more texture,
which might interfere with the resulting segmenta-
tion.
Table 6 shows the overall localization results for
each applied post-processing method. We can observe
that the selection of the largest blob leads to a signifi-
cant improvement in precision and specificity, for the
paid price of a small decrease in recall results.
The input dataset is preprocessed in Experiment 2,
by a filter that enhance the image quality by removing
specular highlights. (S
´
anchez et al., 2017). As Figure
3 shows, it seems that this has a slight impact on the
quality of the final segmentation mask. In this case,
performance on the preprocessed dataset is slightly
lower than in the original one.
5.2 Polyp Detection and Localization
For polyp detection and localization we consider the
following three types of result mask post-processing:
(1) no post-processing, (2) small morphological open-
ing to remove small-scale noise, and (3) selection
of the largest connected component. Table 5 shows
the overall detection results for each applied post-
processing method. From this, we can see that the
small opening leads to a slight improvement in preci-
sion, specificity, and mean reaction time, and a small
decrease in recall and accuracy.
It is difficult to put these results in the context of
other methods, as quantitative results and full datasets
of GIANA 2017 and 2018 challenges are not public
GIANA 2019 - Special Session on GastroIntestinal Image Analysis
620
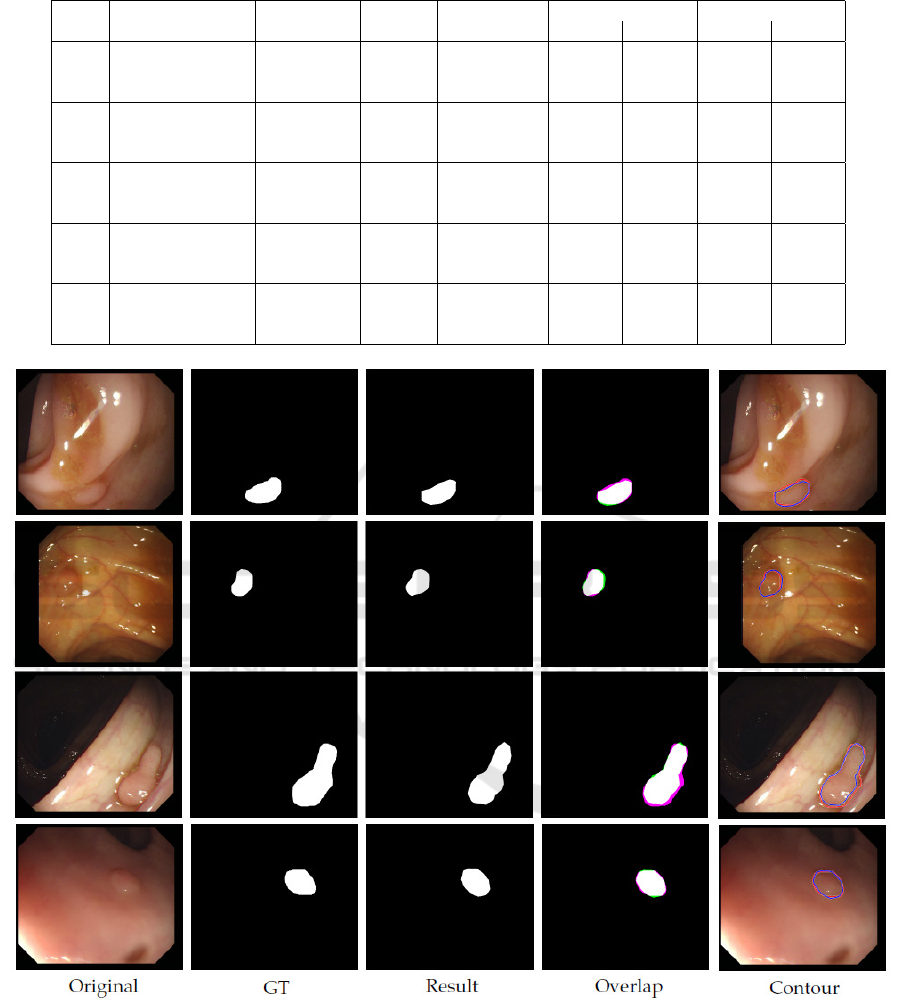
Table 4: Experiments and results of polyp segmentation (Sec. 5.1).
Exp. Database Training & Testing Post- Jaccard Dice
Validation processing Mean std Mean std
1.1
CVC-EndoSceneStill 612 300 None 0.5819 0.2727 0.6905 0.2678
Fill holes 0.5820 0.2727 0.6906 0.2678
Convex hull 0.5798 0.2733 0.6884 0.2692
1.2
CVC-EndoSceneStill 612 - None 0.2258 0.2111 0.3230 0.2672
ETIS-Larib - 196 Fill holes 0.2257 0.2111 0.3228 0.2672
Convex hull 0.2250 0.2171 0.3198 0.2717
2
CVC-EndoSceneStill 612 - None 0.3694 0.3214 0.4579 0.3536
Resized ETIS-Larib - 196 Fill holes 0.3695 0.3215 0.4579 0.3537
Convex hull 0.3759 0.3284 0.4623 0.3584
3
CVC-EndoSceneStill 300 612 None 0.4670 0.2889 0.5754 0.3153
Fill holes 0.4671 0.2890 0.5756 0.3154
Convex hull 0.4782 0.2922 0.5853 0.3172
4
CVC–EndoSceneStill 612 300 None 0.5635 0.2631 0.6786 0.2559
(preprocessed) Fill holes 0.5635 0.2631 0.6787 0.2558
Convex hull 0.5561 0.2658 0.6713 0.2597
Figure 2: Examples of resulting segmentations. Original = Original input image. GT = Ground-truth image. Result =
Resulting image. Overlap = Overlap between GT and Result with overlapping pixels between GT and Result in white; pixels
in GT but not in Result in magenta (true positives); and pixels in Result but not in GT in green (false positives). Contour =
Boundaries of the GT (red) and Result (blue) on the original image.
yet and there are not other fully publicly available
datasets. Nevertheless, current performance shows
the ability of the proposed configuration to detect all
different polyps, regardless of their size and appear-
ance. Moreover, the use of computationally-light post
processing methods show a significant improvement
with respect to the reduction of false alarms, specially
for the case of polyp localization.
Towards a Single Solution for Polyp Detection, Localization and Segmentation in Colonoscopy Images
621
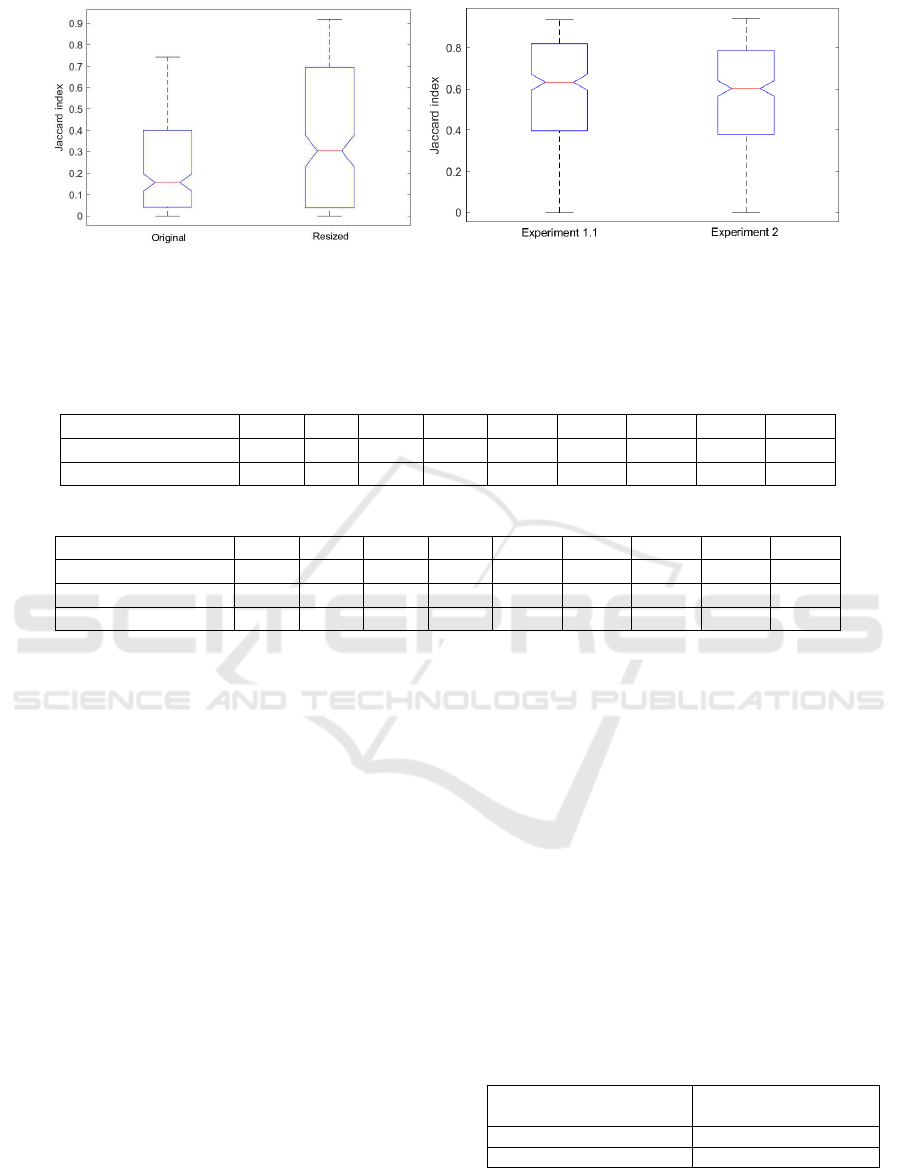
(a) experiment 1.2, original size and resized (b) experiment 1.1 and experiment 2
Figure 3: Boxplots: Jaccard index for (a) experiments 1.2 (original images against resized images) and (b) 2 and Experiment
1.1 against experiment 2.
Table 5: Summary of resulting metrics for detection, for each post-processing method: True positives (TP), false positives
(FP), true negatives (TN), false negatives (FN), precision (PR), recall (REC), specificity (SP), accuracy (ACC), and mean
response time (RT).
Post-processing TP FP TN FN PR REC SP ACC RT
No post-processing 4366 485 2879 2189 90.00 66.60 85.58 73.04 33.11
Small opening 4315 465 2899 2240 90.27 65.82 86.17 72.79 33.11
Table 6: Summary of resulting metrics for localization for each post-processing method. See Tab. 5 for legend.
Post-processing TP FP TN FN PR REC SP ACC RT
No post-processing 3953 1317 2879 2602 75.00 60.30 68.61 63.54 34.77
Small opening 3916 1225 2899 2639 76.17 59.74 70.29 63.81 33.66
Largest blob 3876 904 2899 2679 81.08 59.13 76.22 65.40 33.66
6 DISCUSSION
We have shown how our methodology is able to pro-
vide good results for all the three tasks that have been
targeted. Several observations follow. We can see that
specific aspects of the different datasets being used
can visibly affect the obtained results. For video se-
quences, the lack of precisely annotated data has im-
pacted the performance of our method, as it is asked to
provide an accurate pixel-wise segmentation while it
is trained with some pixels that actually do not belong
to the polyp class. We predict that having pixel-wise
masks for the video dataset could lead to an improve-
ment in performance.
Performance metrics alone do not represent the
actual usefulness of a given system in a clinical
environment. Apart from frame-based metrics, we
should also consider the feasibility of our solution in
both technical and clinical contexts. Our proposed
network was trained and executed during inference
on an Intel Core i7 PC at 2.60GHz having a NVIDIA
GeForce GTX 960m GPU card with 2 GB RAM.
This is a reasonably affordable platform that could be
deployed in clinical practice at a relatively low cost.
In order for a detection method to be used in the
exploration room, it should process images in real-
time so the exploration is not delayed. Considering
that videos are recorded at 25 fps, processing time
should not exceed 40 ms. Table 7 shows the average
computational time in milliseconds for inferring a sin-
gle image on a trained model. As visible, the current
results are still slower than the 40 ms target. However,
we should note that, for HD images, if we are seeking
for a posterior in-vivo histology prediction, real-time
requirements could be relaxed. Separately, we note
that typical year-over-year performance increases of
GPUs will actually bring the computation time of SD
images well within the target range within likely one
year, without increasing the GPU price range.
Table 7: Average computation time (ms).
Image type Average computation
time (ms)
Standard Definition (SD) 125
High Definition (HD) 905
With respect to clinical constraints, the most im-
portant metric here is the mean reaction time (RT),
i.e., the number of frames the method needs to accu-
GIANA 2019 - Special Session on GastroIntestinal Image Analysis
622
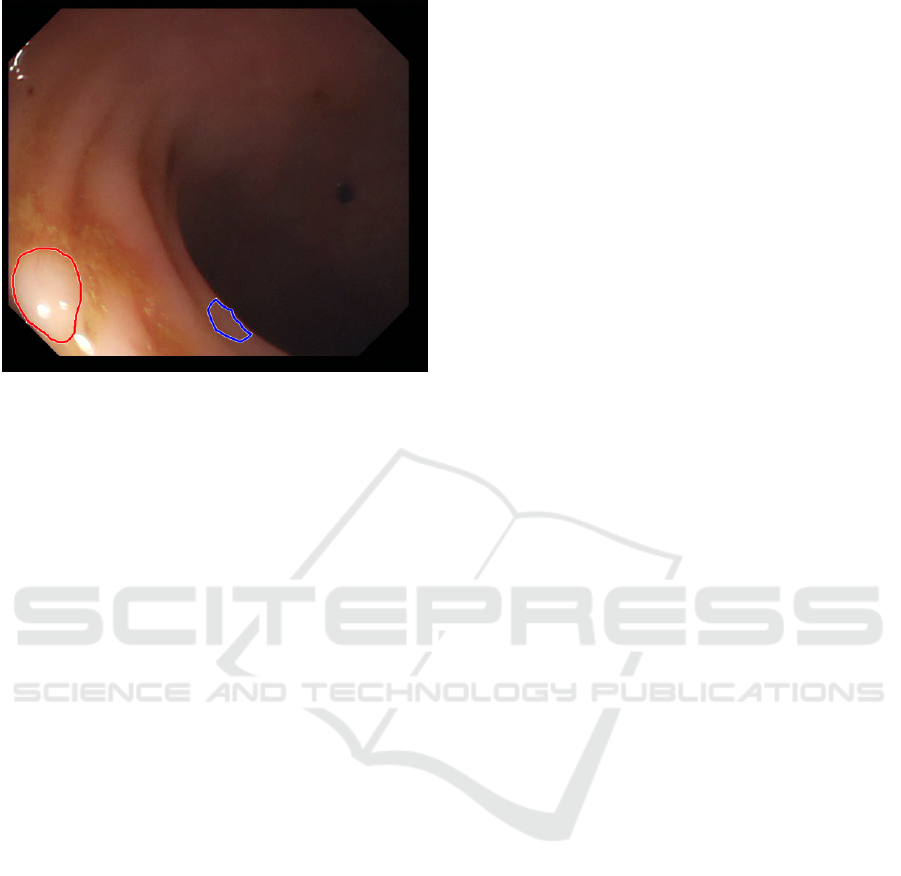
Figure 4: An example of FP and FN result. Red shows the
(missed, FN) ground truth and blue shows our FP result.
rately detect a polyp. In our experiments, our method
achieves a RT of 33.11 frames for detection and a RT
of 33.66 seconds for localization, respectively (Ta-
bles 5 and 5). Good RT values in clinical practice
should range around one second, so the tool’s re-
sponse is perceived as instantaneous. Our current re-
sults are a little over a second though it has to be noted
that, for 7 out of 9 videos, RT is of 0 frames. Mean
RT is damaged by one specific video with a RT of 298
frames so, for the majority of the videos, the method
provides an instantaneous response.
6.1 Limitations
Figure 4 shows an example of a FP and a FN result.
Currently, it is hard to tell what is the reason behind
the appearance of such results, apart from the obvious
observation that, for FNs, there are polyps whose ap-
pearance, under the given lighting conditions, is very
similar to healthy surrounding gastrointestinal skin
texture. Concerning both FP and FN results, we be-
lieve that these can be improved by using a larger and
more diverse training set, as typical in deep learning.
7 CONCLUSIONS
Several computational methods for polyp character-
ization in colonoscopy have been proposed but, to
the best of our knowledge, none of them tackles the
complete polyp characterization task using the same
methodology. We have presented in this paper a
first approach to polyp characterization using a sin-
gle methodology, encoded by a single neural network
architecture (ResNet50).
We have tested our method on several public avail-
able datasets. Results shows that our method can de-
tect and locate various types of polyps appearing in
various types of input imagery, providing accurate
segmentation masks, especially when the method is
tested in still frames. Nevertheless, the actual config-
uration of our method does not comply with the tech-
nical constraints needed for an efficient deployment in
the exploration room. Efforts should be undertaken to
decrease processing time while keeping, and ideally
increasing, performance levels.
One of the reasons of the slightly lower perfor-
mance of segmentation network in video sequences is
the lack of pixel-wise masks for the available datasets.
Additional annotations might be gathered to improve
this data, which could also lead to an improvement of
the performance of the proposed method.
REFERENCES
Alexandre, L. A., Casteleiro, J., and Nobreinst, N. (2007).
Polyp detection in endoscopic video using svms. In
European Conference on Principles of Data Mining
and Knowledge Discovery, pages 358–365. Springer.
Alexandre, L. A., Nobre, N., and Casteleiro, J. (2008).
Color and position versus texture features for endo-
scopic polyp detection. In BioMedical Engineer-
ing and Informatics, 2008. BMEI 2008. International
Conference on, volume 2, pages 38–42. IEEE.
Bernal, J., Histace, A., Masana, M., Angermann, Q.,
S
´
anchez-Montes, C., Rodriguez, C., Hammami, M.,
Garcia-Rodriguez, A., C
´
ordova, H., Romain, O., et al.
(2018). Polyp detection benchmark in colonoscopy
videos using gtcreator: A novel fully configurable tool
for easy and fast annotation of image databases. In
Proceedings of 32nd CARS conference.
Bernal, J., S
´
anchez, F. J., Fern
´
andez-Esparrach, G., Gil,
D., Rodr
´
ıguez, C., and Vilari
˜
no, F. (2015). Wm-dova
maps for accurate polyp highlighting in colonoscopy:
Validation vs. saliency maps from physicians. Com-
puterized Medical Imaging and Graphics, 43:99–111.
Bernal, J., Tajkbaksh, N., S
´
anchez, F. J., Matuszewski,
B. J., Chen, H., Yu, L., Angermann, Q., Romain, O.,
Rustad, B., Balasingham, I., et al. (2017). compar-
ative validation of polyp detection methods in video
colonoscopy: results from the miccai 2015 endo-
scopic vision challenge. IEEE transactions on med-
ical imaging, 36(6):1231–1249.
Brandao, P., Mazomenos, E., Ciuti, G., Cali
`
o, R., Bianchi,
F., Menciassi, A., Dario, P., Koulaouzidis, A., Arezzo,
A., and Stoyanov, D. (2017). Fully convolutional neu-
ral networks for polyp segmentation in colonoscopy.
In Medical Imaging 2017: Computer-Aided Diagno-
sis, volume 10134, page 101340F. International Soci-
ety for Optics and Photonics.
Towards a Single Solution for Polyp Detection, Localization and Segmentation in Colonoscopy Images
623

Dhandra, B. V., Hegadi, R., Hangarge, M., and Malemath,
V. S. (2006). Analysis of abnormality in endoscopic
images using combined hsi color space and watershed
segmentation. In Pattern Recognition, 2006. ICPR
2006. 18th International Conference on, volume 4,
pages 695–698. IEEE.
Eskandari, H., Talebpour, A., Alizadeh, M., and Soltanian-
Zadeh, H. (2012). Polyp detection in wireless cap-
sule endoscopy images by using region-based active
contour model. In Biomedical Engineering (ICBME),
2012 19th Iranian Conference of, pages 305–308.
IEEE.
Ganz, M., Yang, X., and Slabaugh, G. (2012). Automatic
segmentation of polyps in colonoscopic narrow-band
imaging data. IEEE Transactions on Biomedical En-
gineering, 59(8):2144–2151.
He, K., Zhang, X., Ren, S., and Sun, J. (2016). Deep resid-
ual learning for image recognition. In Proceedings of
the IEEE conference on computer vision and pattern
recognition, pages 770–778.
Hwang, S. and Celebi, M. E. (2010). Polyp detection
in wireless capsule endoscopy videos based on im-
age segmentation and geometric feature. In Acoustics
Speech and Signal Processing (ICASSP), 2010 IEEE
International Conference on, pages 678–681. IEEE.
Hwang, S., Oh, J., Tavanapong, W., Wong, J., and
De Groen, P. C. (2007). Polyp detection in
colonoscopy video using elliptical shape feature. In
Image Processing, 2007. ICIP 2007. IEEE Interna-
tional Conference on, volume 2, pages II–465. IEEE.
Iakovidis, D. K. and Koulaouzidis, A. (2014). Automatic le-
sion detection in wireless capsule endoscopy—a sim-
ple solution for a complex problem. In Image Pro-
cessing (ICIP), 2014 IEEE International Conference
on, pages 2236–2240. IEEE.
Iakovidis, D. K., Maroulis, D. E., Karkanis, S. A., and
Brokos, A. (2005). A comparative study of texture
features for the discrimination of gastric polyps in en-
doscopic video. In Computer-Based Medical Systems,
2005. Proceedings. 18th IEEE Symposium on, pages
575–580. IEEE.
Karargyris, A. and Bourbakis, N. (2009). Identification of
polyps in wireless capsule endoscopy videos using log
gabor filters. In Life Science Systems and Applications
Workshop, 2009. LiSSA 2009. IEEE/NIH, pages 143–
147. IEEE.
Karkanis, S. A., Iakovidis, D. K., Maroulis, D. E., Karras,
D. A., and Tzivras, M. (2003). Computer-aided tumor
detection in endoscopic video using color wavelet fea-
tures. IEEE transactions on information technology in
biomedicine, 7(3):141–152.
Kingma, D. P. and Ba, J. (2014). Adam: A
method for stochastic optimization. arXiv preprint
arXiv:1412.6980.
Leufkens, A., van Oijen, M., Vleggaar, F., and Siersema, P.
(2012). Factors influencing the miss rate of polyps
in a back-to-back colonoscopy study. Endoscopy,
44(05):470–475.
Magoulas, G. D., Plagianakos, V. P., and Vrahatis, M. N.
(2004). Neural network-based colonoscopic diagno-
sis using on-line learning and differential evolution.
Applied Soft Computing, 4(4):369–379.
Mamonov, A. V., Figueiredo, I. N., Figueiredo, P. N., and
Tsai, Y.-H. R. (2014). Automated polyp detection in
colon capsule endoscopy. IEEE transactions on med-
ical imaging, 33(7):1488–1502.
Maroulis, D. E., Iakovidis, D. K., Karkanis, S. A., and Kar-
ras, D. A. (2003). Cold: a versatile detection sys-
tem for colorectal lesions in endoscopy video-frames.
Computer Methods and Programs in Biomedicine,
70(2):151–166.
Park, S. Y., Sargent, D., Spofford, I., Vosburgh, K. G.,
Yousif, A., et al. (2012). A colon video analysis
framework for polyp detection. IEEE Transactions on
Biomedical Engineering, 59(5):1408–1418.
Rabeneck, L., El-Serag, H. B., Davila, J. A., and Sandler,
R. S. (2003). Ooutcomes of colorectal cancer in the
united states: No change in survival (1986–1997). The
American journal of gastroenterology, 98(2):471.
Ratheesh, A., Soman, P., Nair, M. R., Devika, R., and
Aneesh, R. (2016). Advanced algorithm for polyp de-
tection using depth segmentation in colon endoscopy.
In Communication Systems and Networks (ComNet),
International Conference on, pages 179–183. IEEE.
S
´
anchez, F. J., Bernal, J., S
´
anchez-Montes, C., de Miguel,
C. R., and Fern
´
andez-Esparrach, G. (2017). Bright
spot regions segmentation and classification for spec-
ular highlights detection in colonoscopy videos. Ma-
chine Vision and Applications, 28(8):917–936.
Siegel, R. L., Miller, K. D., Fedewa, S. A., Ahnen, D. J.,
Meester, R. G., Barzi, A., and Jemal, A. (2017). Col-
orectal cancer statistics, 2017. CA: a cancer journal
for clinicians, 67(3):177–193.
Silva, J., Histace, A., Romain, O., Dray, X., and Granado,
B. (2014). Toward embedded detection of polyps in
wce images for early diagnosis of colorectal cancer.
International Journal of Computer Assisted Radiology
and Surgery, 9(2):283–293.
Tajbakhsh, N., Gurudu, S. R., and Liang, J. (2014). Au-
tomatic polyp detection using global geometric con-
straints and local intensity variation patterns. In In-
ternational Conference on Medical Image Computing
and Computer-Assisted Intervention, pages 179–187.
Springer.
Tajbakhsh, N., Gurudu, S. R., and Liang, J. (2015). Au-
tomatic polyp detection in colonoscopy videos using
an ensemble of convolutional neural networks. In
Biomedical Imaging (ISBI), 2015 IEEE 12th Interna-
tional Symposium on, pages 79–83. IEEE.
Tajbakhsh, N., Gurudu, S. R., and Liang, J. (2016). Au-
tomated polyp detection in colonoscopy videos using
shape and context information. IEEE transactions on
medical imaging, 35(2):630–644.
Tarik, G., Khalid, A., Jamal, K., and Benajah, D. A. (2016).
Polyps’s region of interest detection in colonoscopy
images by using clustering segmentation and region
growing. In Information Science and Technology
(CiSt), 2016 4th IEEE International Colloquium on,
pages 455–459. IEEE.
GIANA 2019 - Special Session on GastroIntestinal Image Analysis
624

Tjoa, M. P. and Krishnan, S. M. (2003). Feature extraction
for the analysis of colon status from the endoscopic
images. BioMedical Engineering OnLine, 2(1):9.
V
´
azquez, D., Bernal, J., S
´
anchez, F. J., Fern
´
andez-
Esparrach, G., L
´
opez, A. M., Romero, A., Drozdzal,
M., and Courville, A. (2017). A benchmark for endo-
luminal scene segmentation of colonoscopy images.
Journal of healthcare engineering, 2017.
Wang, Y., Tavanapong, W., Wong, J., Oh, J., and De Groen,
P. C. (2014). Part-based multiderivative edge cross-
sectional profiles for polyp detection in colonoscopy.
IEEE Journal of Biomedical and Health Informatics,
18(4):1379–1389.
Yu, L., Chen, H., Dou, Q., Qin, J., and Heng,
P. A. (2017). Integrating online and offline three-
dimensional deep learning for automated polyp detec-
tion in colonoscopy videos. IEEE journal of biomedi-
cal and health informatics, 21(1):65–75.
Zhou, M., Bao, G., Geng, Y., Alkandari, B., and Li, X.
(2014). Polyp detection and radius measurement
in small intestine using video capsule endoscopy.
In Biomedical Engineering and Informatics (BMEI),
2014 7th International Conference on, pages 237–
241. IEEE.
Towards a Single Solution for Polyp Detection, Localization and Segmentation in Colonoscopy Images
625
