
The Evaluation of a Teaching Maturity Model in the Context of
University Teaching
Elisa Reci and Andreas Bollin
Institute of Informatics Didactics, Facutly of Technical Science, Universit
¨
at Klagenfurt, Austria
Keywords: Maturity Model, Teaching Quality, Assessment.
Abstract:
Maturity models are a way to address the quality of teaching. They are used either as self-assessment tools for
teachers or as assessment tools for accrediting courses and institutions. By collecting best practices of com-
puter science teachers in school, a Teaching Maturity model (TeaM) was developed. The paper evaluates this
model in the context of university teaching. It investigates its applicability and presents hints for improvement.
To do so, computer science lectures at Universit
¨
at Klagenfurt were selected and assessed based on the TeaM
Model. Additionally, the students’ feedback for these courses was collected, and the results were statistically
compared. In this setting, it turned out that the TeaM model can be applied to university teaching, but it should
also be improved in terms of regrouping the process areas.
1 INTRODUCTION
Tools for assessing learning and improving the quality
of teaching by providing also accreditation of courses
and institutions are an ongoing field of research. The
major part of the existing tools considers only spe-
cific factors (like teacher preparation, course layout,
environment, etc.) (Rec¸i and Bollin, 2017). A re-
cent study emphasizes the fact that a better quality
of teaching is achieved when considering the teach-
ing process as a whole (Chen et al., 2014; Chen
et al., 2012). Chen et al. came up with the idea of
a maturity model for teaching. Their model is based
on a model from the Software Engineering Institute
(SEI) of Carnegie Mellon University. SEI worked
for years to build up a Capability Maturity Model
(CMM) for quality assurance of processes producing
software, and they still work on the improvement of
the model (Forrester et al., 2011). The model of Chen
et al. seems to be useful, but indeed, it has some lim-
itations (Chen et al., 2014). First, its content was not
built for school teachers (only for university teach-
ers). Secondly, they conducted only an exploratory
study and no review, and finally, no empirical inves-
tigation is done so far for the developed model. But,
spurred by the work of Chen et al. (Chen et al., 2014),
a Teaching Maturity Model (TeaM) was created (Rec¸i
and Bollin, 2017). The TeaM model tries to over-
come the above limitations, and it expands the focus
to both, university and school teachers. Within the
TeaM model, the “teaching process” is composed of
four main phases:
• Initialization - administrative issues are managed.
• Preparation - the course is planned and prepared
by teachers.
• Enactment - the implementation of the teaching
unit takes place.
• Quality and Incident Control - possible incidents
and the teaching process itself are observed, ana-
lyzed and refined.
In this paper, the TeaM model address the quality of
teaching by assessing and improving the teaching pro-
cess. For each phase of the teaching process, factors
related to teaching are defined, and in the TeaM model
they represent the basic components named Process
Areas (PAs). The TeaM model has in total 12 PAs,
and each consists of some goals and the related prac-
tices (Rec¸i and Bollin, 2017). The set of practices was
built by the collection of best practices from experi-
enced school teachers and university teachers. The
implementation of these practices and the associated
goals is done by two representation forms: continued
representation (Capability Level - CL), where only
one PA is assessed and further managed for improve-
ment, and stage representation (Maturity Level - ML),
where a group of PAs associated to a specific ML are
assessed. There are 5 Maturity Levels determined
within the range from 1 to 5, (where 5 is the high-
est level). Following the idea of the TeaM model, a
360
Reci, E. and Bollin, A.
The Evaluation of a Teaching Maturity Model in the Context of University Teaching.
DOI: 10.5220/0007699303600367
In Proceedings of the 11th International Conference on Computer Supported Education (CSEDU 2019), pages 360-367
ISBN: 978-989-758-367-4
Copyright
c
2019 by SCITEPRESS – Science and Technology Publications, Lda. All rights reserved

teaching process is mature to a certain level when all
the PAs corresponding to that level reach the maxi-
mum level of Capability (Rec¸i and Bollin, 2017).
When talking about the “quality of teaching”, then
quality indicates the learners’ satisfaction, the learn-
ing outcomes, and the consistency of best practices of
teachers. In this paper we focus on learners’ satisfac-
tions and on practices applied by teachers. The ob-
jective now is to evaluate these two dimensions of the
quality of teaching in the context of university courses
with the use of the TeaM model. This means applying
the model and looking for improvements based on re-
sults. To do so, a study was conducted with computer
science courses (bachelor and master) from the Fac-
ulty of Technical Science at the institutes of informat-
ics at Universit
¨
at Klagenfurt. The TeaM model was
used by the teachers of these courses, and their ma-
turity results were compared with students’ rating of
their classes.
The rest of the paper is organized as follows: Sec-
tion 2 presents the related work. A detailed descrip-
tion of the study and the results from the statistical
analysis are presented in Section 3. In Section 4, the
outcomes of the study and its validity are discussed
in details. Section 5 ends up with some conclusions
and recommendations for teachers, and for further im-
provement of the TeaM model.
2 RELATED WORK
There is a considerable work on assessment tools and
models which address the quality of teaching by also
producing course and institution accreditation. They
focus either on teachers (preparation, communication,
engagement), or pupils/students, or course content or
the environment. Taking a closer look at the existing
work, we can divide these models in several groups.
There are models that, for addressing the quality
of teaching, focus only on school teachers. Some of
them are: The AQRT model which address the quality
of teaching by assessing the teacher teaching practices
(Chen et al., 2012). The competence based model
is another model which assesses the teaching quality
through teacher-licensure tests (Mehrens, 1990).
Furthermore, there is the TALIS model which
assesses the quality based on working condition of
teachers and the learning environment (OECD, 1961).
On the other side we know that the quality of
teaching is more than just teachers assessment. Other
elements influence it as well. For that reason, other
researchers address the quality by consider also the
pupils/students and the teachers’ interactions. The
CEM model is one of them. It assesses teacher qual-
ity based on students’ outcomes (Azam and Kingdon,
2014). The assessment of teacher competences and
students learning and feelings is another model pre-
sented by Snook et al. (Snook et al., 2013). TEQAS
is onter one, where quality is addressed by assessing
the teaching education (Dilshad, 2010).
Beyond the assessment models mentioned above,
some maturity models based on the CMMI’s prin-
ciples were created. Researchers, in the field of
computer science education mainly, created matu-
rity models to assess and to improve the curricula or
the institution itself (Duarte and Martins, 2011; Ling
et al., 2012; Lutteroth et al., 2007). The validation
of the models is referred to a later stage and so far
no results are published yet. While Ling et al. ap-
plied their model through a case study in a private in-
stitution of Higher Learning (IHL) in Malaysia and
mentioned that a larger participation of IHLs will be
used in future for a better validation of the model
(Ling et al., 2012). The adaption of CMMI in edu-
cational domain is seen also for courses design either
in a classroom environment (Petrie, 2004) or online
(Marshall and Mitchell, 2004; Neuhauser, 2004). The
model of Petrie is also not validated yet (Petrie, 2004).
Neuhauser did the validation of the model in relation
to usability, and the answers from the questionnaires
revealed that 88 percent of the responders agree with
the suggested process areas (Neuhauser, 2004). Sim-
ilarly, Marshall and Mitchell validated the processes
and the model in the analysis of an e-learning module
at New Zealand University (Marshall and Mitchell,
2004).
Likewise, in primary and secondary schools, some
CMMI-like implementation models with the focus on
the institutional level or on the syllabus (Montgomery,
2003; Solar et al., 2013) were created as well. Mont-
gomery applied her model in six schools for defin-
ing the level of using computers and technologies in
schools. The models provides goals and practices
for making improvements (Montgomery, 2003). So-
lar et al. conducted a pilot study to test the validity
of the model and its associated web-support tool (So-
lar et al., 2013). They tested the applicability of the
model in different schools and obtained positive feed-
back from them.
Some of the above models demonstrated their ap-
plicability in practice and some not (Rec¸i and Bollin,
2018). A new way of looking at the quality of teach-
ing derived by the work of Chen et al. They estab-
lished a maturity model for observing the teaching
process with the focus on university teachers and lim-
ited to a subset of possible Process Areas (Chen et al.,
2014). In their paper, Chen et al. address the im-
plementation of a model for primary and secondary
The Evaluation of a Teaching Maturity Model in the Context of University Teaching
361
schools, but to the best of our knowledge, such a
model has not been implemented and/or published
yet.
Spurred by the shortcomings of the aforemen-
tioned models the Teaching Maturity Model was es-
tablished (Rec¸i and Bollin, 2017). Within such a
model the quality of teaching is addressed by look-
ing at the teaching process as a whole, and in contrast
to Chen et al. it considers not only university teachers
but primary and secondary teachers as well. Unlike a
part of the above models, an evaluation of the TeaM
model is done in order to learn from and improve it.
3 THE STUDY
In order to investigate the applicability of the TeaM
model in the context of university teaching, a study
was conducted. The study made use of computer sci-
ence courses at Universit
¨
at Klagenfurt. There, the
students have the possibility to provide feedback for
each course, which is electronically collected in a
platform called ZEUS. For 19 of these courses, the
TeaM model was applied, and a correlation between
the students’ feedback and the TeaM model result was
investigated.
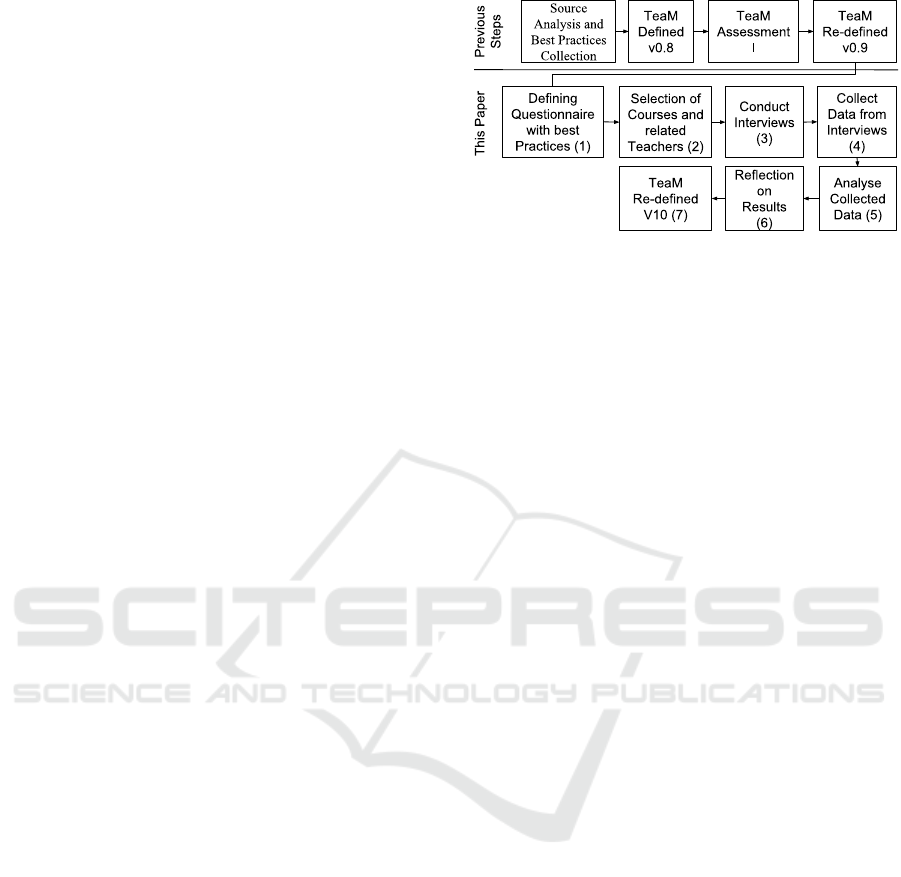
Figure 1 shows the steps that were already taken
in order to ensure the quality of the model and the
relation to this paper. The first half of Figure 1 (Previ-
ous Steps), shows the processes for creating the TeaM
model based on source analysis and best practices col-
lection (Rec¸i and Bollin, 2017), and its first valida-
tion and re-definition with teachers (Rec¸i and Bollin,
2018). The second half of Figure 1 is related to this
paper. It presents the layout of the study when running
the TeaM appraisal at the university level. Keeping in
mind the TeaM structure, the practices of the model
are presented in form of a questionnaire (1). The
courses were randomly selected (2), and the question-
naire was used during the interviews with the teachers
of these courses (3). All the feedback was collected
and analyzed (4)(5). Reflection on the results (6) con-
tributed to the improvement of the model (7).
3.1 Research Objectives
The TeaM model was defined by collecting the teach-
ers’ best practices in preparation and teaching. It
trunks from computer science discipline and the stan-
dards were created following best practices of school
teachers. All in all with the aim to address the quality
of teaching. Within the scope of the TeaM model, the
quality of teaching means to
(a) adhere to the state of the art of teaching
Figure 1: A description of the study processes for con-
ducting the TeaM appraisal in computer science university
courses.
(b) enable learners to acquire competences easily
(c) ensure that learners are satisfied with the courses
In this study we consider two of the dimensions,
(a) and (c) respectively. The question now is, if the
Teaching Maturity model really addresses the qual-
ity of teaching (for these two dimensions) in com-
puter science courses at universities. For this issue, a
comparison between the students’ feedback (ZEUS)
and the results generated from the TeaM appraisal for
some computer science courses in Universit
¨
at Kla-
genfurt is evaluated. We looked at the practices of PAs
implemented by the university teachers (referring to
(a)) and at the students’ perspective (referring to (c))
A relevant part of this study is to learn from the
results and to further improve the TeaM model. For
doing that, we looked in details if a regrouping of PAs
into MLs is necessary and if there are certain correla-
tion between PAs that need additionally revision. So,
within the scope of this paper the following two ques-
tions are raised:
• Are all the process areas suitable for teachers at
Universit
¨
at Klagenfurt?
• To what extend are the results from the Maturity
Level and students perception of the course corre-
lated?
For answering these questions, the TeaM model
was applied to computer science courses at Univer-
sit
¨
at Klagenfurt and the results are presented here-
inafter.
3.2 Settings
As mentioned in Section 1, the model has 12 Process
Areas (PAs), and each PA contains one or more goals
to be fulfilled during the teaching process. And, ev-
ery goal contains at least one practice. Every prac-
tice was tested by a question. For instance, the prac-
tice “SP2.2.1.1 Research and Collect Materials” for
defining the learning content is represented in the
CSEDU 2019 - 11th International Conference on Computer Supported Education
362

questionnaire as “18. For defining the learning con-
tent, do you search for and collect materials?” (Rec¸i
and Bollin, 2016). In total there were 76 Yes/No ques-
tions. The questions were provided in an electronic
format using Google forms. This makes the ques-
tionnaire public and accessible by those who are in-
terested to use such a model
1
. The participation is
anonymous as no personal data is collected.
The study looked at a total of 19 computer science
courses from the Bachelor and Master program at the
Universit
¨
at Klagenfurt. The courses were randomly
selected, and were of a variety of types like seminar,
selected topics, labs, tutorials, etc. For each of these
courses, the students’ feedback was collected from
the ZEUS system. The assessment of these courses
with the TeaM model was applied only once and at
the end of the course.
The ZEUS system aims at defining the level of sat-
isfactions that students have for a specific course. It is
composed of 6 fixed questions, and provides the op-
portunity to add supplementary questions from teach-
ers. Within this, 4 questions have the possibility to be
answered in a range of evaluation from “very good”
to “no response”. The questions deal with the reason
why students attend the course, the progress students
make, the overall evaluation of the course, and the
equality of treatment between students by their teach-
ers. The 2 remaining questions are text field leaving
some space for students to provide suggestions for
course improvement.
The questionnaire covering the practices and goals
of the TeaM model was distributed to the lecturers
of these courses. There were three interviewees, all
of them members of the department of informatics
didactics in Klagenfurt, who ran the questionnaire.
The questions were answered by the teachers, and
they were free to give additionally free-text answers,
which were recorded and used for later analysis. The
duration of each interview was 30 to 40 minutes. Ev-
erything was electronically documented.
Within the scope of this contribution four sta-
tistical tests were used to assess the selected data.
First, the normal distribution of data was controlled.
The Anderson-Darling normality test was used for
this purpose (Tolikas and Heravi, 2008). Secondly,
the Pearson’s Correlation Coefficient, the Spearman’s
Correlation Coefficient and the Kendall’s Correlation
Coefficient were applied to the data. And finally, a
regression analysis (Backward Elimination) was con-
ducted to define which PAs are statistically significant
and contribute to the model.
1
Interested readers can join and give their personal ex-
perience in form of practices by visiting the web-site of the
TeaM project (Rec¸i and Bollin, 2016)
The Pearson’s correlation coefficient Rho (Rp)
looks only on a linear correlation between the vari-
ables and assumes a normal distribution of the values
(Rees, 2000). The test works even when the data is
not normally distributed, but it looks only at the linear
correlation. The results might indicate no correlation
if the data is correlated in a nonlinear manner.
To handle the cases when the data is not normally
distributed, the Spearman’s rank correlation coeffi-
cient Rho (Rs) is used (Rees, 2000). It is a non-
parametric version of Pearson, and uses a monotonic
function to describe the correlation between variables.
The sample data are ranked separately for each vari-
able and then the correlation is defined.
An alternative of the Spearman’s test is the
Kendall correlation coefficient Rho (Rk) (Norman
et al., 1997). It is also a non-parametric test and de-
fines the relation among pairs of data. The data is
ranked relatively and partial correlation is possible to
be detected.
In the rest of this paper, the correlation coefficient
is explained as follows:
• When Rho is between [0.7, 1.0], the correlation is
interpreted as strong relation.
• When Rho is between [0.4, 0.7), the correlation is
interpreted as medium relation.
• When Rho is between [0.0, 0.4), the correlation is
interpreted as weak relation.
In the interpretation of the results, besides the
above values, the significance value (p) of the null
hypothesis is considered. The null hypothesis aims at
showing that there is no statistical evidence between
the variables. The p-value is been defined equal to
0.05 and any probability of the value Rho smaller or
equal to p-value indicates stronger evidence against
the null hypothesis.
The p-value interprets also the results from the
regression analysis using the backward elimination
steps (Yuan and Lin, 2006). The regression analysis
defines which of the independent variables are related
to the dependent variable. The backward elimination
keeps all the independent variable in the equation and
eliminates (once a time) those that have a bigger value
than the significant value (p).
3.3 Results
The fifth step of this study was the analysis of the col-
lected data from the interviews. The implementation
of 76 questions (practices) was calculated to deter-
mine if the goals of the model were fulfilled. The cal-
culations followed the CMMI principle of appraisal,
The Evaluation of a Teaching Maturity Model in the Context of University Teaching
363
meaning that, in our situation, 80% of the ques-
tions should have been answered with “Yes”. From
this derived the determination if and which goals are
achieved. The same strategy was applied to goals to
see which PAs are satisfied. This means 80% of goals
related to a PA should have been achieved. The sat-
isfaction of a group of PAs established the Maturity
Level for each course.
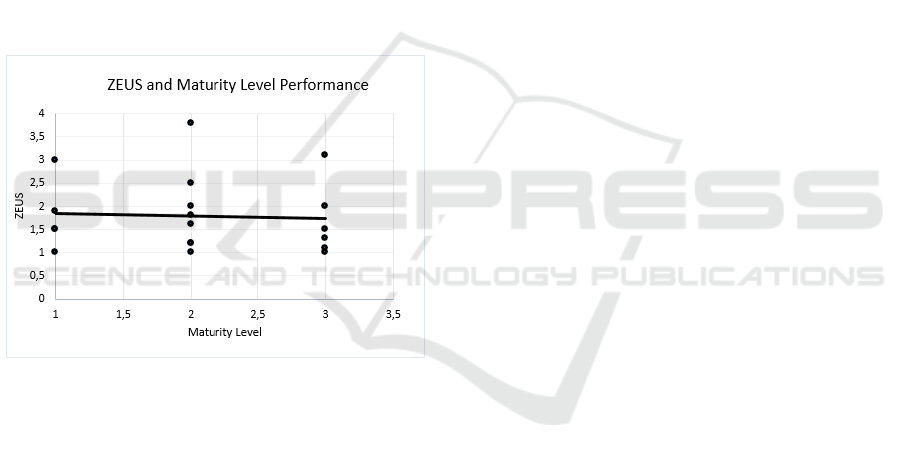
In a first step, a scatter plot (see Figure 2) was pro-
duced to present the relation between Maturity Levels
and the ZEUS grades. This helps us to get a first feel-
ing about possible relations and differences between
them. On the y-axis are the ZEUS grades on a scale
from 1 to 5, where, according to the Austrian grading
system, 1 means the highest achievement. The linear
trend-line in Figure 2 indicates a slightly decreasing
linear line between the ZEUS grades and the Matu-
rity Level. In other words, the higher the Maturity
Level is, the lower is the ZEUS grade, which means
that the students were more satisfied.
Figure 2: Scatter-plot for visualizing the relation between
the Maturity Levels and the ZEUS feedback. The Maturity
Level rangs from 1 to 5 but no course reached levels 4 or 5,
so it is not presented in the figure.
The Scatter plot was useful for getting a first feel-
ing, but there are quite some data points spread away
from the trend-line. During the statistical tests, the 12
PAs of the TeaM model have been always considered
as variables. The null hypothesis in the Anderson-
Darling test assumes that the variable from which the
sample was extracted follows a normal distribution.
For every A-square value of the test which is smaller
than the p-value, the null hypothesis is rejected. Con-
sidering the results from the Anderson-Darling’s test,
P2.2 Content Planning has a mean of 0.731 and a stan-
dard deviation of 0.161. Due to the p-value (0.385)
the null hypothesis is rejected, meaning that this PA
is normally distributed. P4.1 Observing the Teaching
Process is also normally distributed due to the p-value
(0.0957). It has a mean of 0.538 and a standard devia-
tion of 0.197. The last distributed PA is P4.3 Improve
Teaching (p-value (0.092)) with a mean of 0.598 and
a standard deviation of 0.192.
For finding a correlation between the set of vari-
ables (PAs, ML and ZEUS), statistical tests (Pearson,
Spearman and Kendall) where applied. Due to space
limitation, only the results from the Spearman test are
presented in the paper (see Figure 3). It presents the
Rho-values for the Spearman test. The Rho-values
marked bold have a p-value smaller then 0.05. This
means that the null hypothesis is rejected and that the
Rho-values show some statistical evidence between
the variables. The other Rho-values (not marked)
have a p-value bigger then 0.05 and have to be inter-
preted with care. This study focused and considered
only those Rho-values that have statistical evidence.
Following the objective of this study, the relation
between ZEUS grades and the Maturity Level ML (in-
cluding its PAs) was of importance. When looking at
Pearson’s results, there is only one relation, the pos-
itive medium relation between the ZEUS grades and
P2.2 Content Planning (0.491). The results detail in-
formation concerning the relation PAs and ML. The
Maturity Level has a positive strong correlation with
P1.3 Discovering Needs (0.691), P2.4 Incident Man-
agement (0.815), P4.1 Observing the Teaching Pro-
cess (0.851) and P4.3 Improve Teaching (0.671). Fur-
thermore, Maturity Level has a positive medium rela-
tion with P2.1 Design Objectives, P3.1 Delivery and
Consolidation, P1.1 Determining Commitment, and
P4.2 Reflecting on the Teaching Process. The rest of
the PAs have a weak relation with the ML.
The Spearman’s correlation coefficient test is rec-
ommended in situations when the variables are not
normally distributed, and there is a nonlinear rela-
tion. The results are shown in Figure 3. Unlike the
Perason test, the Spearman test shows that there is a
positive strong relation between the ZEUS grades and
P2.2 Content Planning (0.683). When looking at the
correlation between ML and the PAs, we noticed that
the Maturity Level has a positive strong relation with
the P2.4 Incident Management (0.767), P4.1 Observ-
ing the Teaching Process (0.862), P1.3 Discovering
Needs (0.736) and P4.3 Improve Teaching (0.680).
On the other side there is a positive medium rela-
tion of ML with P2.1 Design Objectives (0.566), P3.1
Delivery and Consolidation (0.538), P1.1 Determin-
ing Commitment (0.509) and P4.2 Reflecting on the
Teaching Process (0.619). The rest of the PAs have a
weak relation with the ML.
In this study we also did a Kendall test. The test
was used to check for nonlinear partial relations. Un-
like Spearman, but like Pearson, Kendall’s test shows
a positive medium relation between ZEUS grades and
CSEDU 2019 - 11th International Conference on Computer Supported Education
364

Figure 3: Spearman Rho for the 12 PAs, ML and ZEUS grades. The results marked bold have a p-value smaller then 0.05 and
indicate a correlation between variables (n=14).
P2.2 Content Planning (0.506). This test (similar to
Pearson and Spearman) confirms once again that there
is only one relation between ZEUS and PAs. While
examining the relation ML and PAs, the results from
this test reveal that there are strong relation of ML
with P4.1 Observing the Teaching Process (0.787),
P2.4 Incident Management (0.669) and P1.3 Discov-
ering Needs (0.671). Some medium relation are found
between the ML and P2.1 Design Objectives (0.502),
P3.1 Delivery and Consolidation (0.504), P1.1 Deter-
mining Commitment (0.468), P4.2 Reflecting on the
Teaching Process (0.505) and P4.3 Improve Teaching
(0.580). The rest of the PAs have a weak relation with
the ML.
We were wondering which PAs contribute to the
model. For this reason a regression analysis using a
backward elimination algorithm was performed. The
12 PAs, formed the independent variables, and those
with the highest p-value (always considered those
with p-value bigger then 0.05) were eliminated. The
dependent variable was the ZEUS grade. The results
from the test demonstrated that only P2.2 Content
Planning is of statistically significance in the model,
something we expected seeing the results from the
other tests performed earlier. It has a medium corre-
lation of 0.491 and it shows that 24% of all the varia-
tion of ZEUS-values are explained by the independent
variable P2.2 Content Planning.
Finding the correlation of PAs with the ML-s and
how they can be rearranged in ML was also of inter-
est. The results of the study suggested that the split
of PAs into Maturity Level should be changed. Four
changes were applied in the reconstruction of MLs.
The PA Methodology Selection was moved from ML
2 to ML 4. Determining Commitment changed the
ML from 3 to 2. Observing te teaching Process moved
to ML4 and finally, Reflecting on the Teaching Pro-
cess was shift to ML5. Basically, the revised version
of ML is now presented in Table 1.
Table 1: The relevant Process Areas for each Maturity
Level.
Maturity Level Process Areas
Chaotic (1) No relevant PAs.
Initial (2)
Availability of Resources
Design Objectives
Content Planning
Delivery and Consolidation
Assessment Management
Determining Commitment
Repeatable (3)
Discovering Needs
Incident Management
Stable (4)
Methodology Selection
Observing the Teaching Process
Optimizing (5)
Reflecting on the Teaching Process
Improving Teaching
4 REFLECTION
The previous section gave us the first interpretation
of the data set. In this section we discuss about the
findings and the threats to the validity.
4.1 Discussion
For answering the two questions raised in this pa-
per, we considered all the possible variables and we
looked in details which of them contribute to the
TeaM model. The results were somehow expected.
In contrast to the TeaM model, ZEUS focuses on one
aspect of the quality of teaching (that of students mo-
tivation and satisfaction). The assessment is gener-
ated based on the students’ perception. On the other
hand, the TeaM model considered all the processes
that influence the quality of teaching and the assess-
ment relies on standards, avoiding personal feedback.
When considering the results from the three tests
(Pearson, Spearman, Kendall), we see that there are
some similarities and differences between them. A
The Evaluation of a Teaching Maturity Model in the Context of University Teaching
365

difference is seen in the relation ZEUS - PAs, where,
unlike Pearson and Kendall, Spearman suggests a
strong relation of the ZEUS grades and P2.2 Content
Planning Process Area. The correlation values of the
three tests slightly differs, but the Spearman’ result
is closer to that of Kendall. However, the three of
them confirm that the Maturity model is appropriate
in the context of university teaching when at least one
Process Area is considered. This means that our uni-
versity teachers pay attention only to the process for
planning the course content. The result is reinforced
also by the regression analysis. In Austria, University
teachers also have to publish a lot. So we assume that
in our setting they put more efforts in their research
then on teaching.
Differences are to be found also in the relations
of PAs between them. The Pearson test presents a
medium correlation between P2.1 Design Objectives
and P1.3 Discovering Needs. Such a relation is not
presented neither in the Spearman test, nor in Kendall
test. Logically, this relation should make sense as the
discovered learners’ needs should be taken into ac-
count while designing the course objectives. Similar,
the relation P3.1 Delivery and Consolidation and P1.3
Discovering Needs is treated by Pearson and Spear-
man, but not by Kendall. Also here, the learners’
needs should be considered when delivering and con-
solidating the teaching units.
Quite a surprising relation is that of P1.1 Deter-
mining Commitment and P2.4 Incident Management.
The relation is of medium strength in the Pearson and
Kendall tests. Actually, it is somehow difficult to
understand how the management of incidents might
influence the duties of stakeholders included in the
teaching process. On the other side it is natural that
one of the duties of a teacher is also to be prepared for
the incident.
The Pearson test shows a medium correlation be-
tween P2.1 Design Objectives and P4.1 Observing the
Teaching Process: such a correlation is not at all in
Spearman and Kendall tests. This relation is impor-
tant as the results by the observation of the teaching
process will be considered next time when defining
the objectives of the course.
Pearson and Spearman tests show a strong corre-
lation between P3.1 Delivery and Consolidation and
P4.3 Improve teaching, but in the Kendall test this
correlation is of a medium strength. Considering the
educational domain, it makes sense that such a rela-
tion is strong as changes on improving teaching mean
also changes on improving delivery and consolida-
tion.
4.2 Validity
There are many factors contributing to the results of
the study. The respondents come from two different
domains. ZEUS results are generated by students and
the results might not have been given objectively. The
TeaM questionnaire was answered by teachers and we
assume them being honest, as no ranking was pro-
duced. However, they also might have had a bias. Fi-
nally, the questions in ZEUS are only related to the
satisfaction level for a course. So, only one aspect of
the quality is considered. Other areas of the teach-
ing process are not considered by the students. An-
other factor that might have influenced the results was
the number of participants (19 in total). Last but not
least, the answer form might have had an effect. Only
“Yes/No” answers limited the interviewee, and we no-
ticed that they confused them a bit. Future evaluations
will have a 6-type scale.
5 CONCLUSION AND
RECOMMENDATION
Making use of a Maturity Model aims at helping
teachers to evaluate and improve their teaching pro-
cess by their own. It can also be used by the edu-
cational institution to evaluate the quality of teaching
and, when required, to produce a ranking.
This paper aims at testing for the applicability of
the model also in a university setting and asks two
questions: firstly, if all the process areas are suit-
able for teachers at Universit
¨
at Klagenfurt, secondly,
the extend of correlation between the results from the
Maturity Level and students perception of the course.
The results show that the model is applicable in the
context of universities, but limited to a number of Pro-
cess Areas. University teachers are concentrated on
one Process Area, that of planning the content of their
course. Only some of them looked tangentially on the
other Process Areas.
Regarding the second question of the paper, the
results show that the extent of correlation between the
Maturity Level and the students’ perception of the
course is only weak. But, on the other hand, they
show that the extent of correlation between the stu-
dents’ perception and PAs (P2.2 Content Planning) is
strong based on Spearman test, and medium based on
Pearson and Kendall test. Nevertheless, we believe
that teaching is a process that comprises many process
areas. Those areas contribute as well to the quality of
teaching. Thus, university teachers are encouraged to
think and use the proposed areas as factors that will
improve their teaching quality of the courses, too.
CSEDU 2019 - 11th International Conference on Computer Supported Education
366

Furthermore, the results proposed some changes
on the way how process areas should be grouped in
their corresponding MLs. Additionally evaluation of
the TeaM model with a larger number of participants
should take place in order to continue optimizing it.
We are currently developing a web application
of the TeaM model accessible by every teacher who
wants to do a self assessment of his/her teaching qual-
ity. As a future work, this web should be adapted to
be used also by educational institutions for producing
a ranking based on evidences. Within the scope of
improvement, further evaluation of the TeaM model
in schools and universities in Austria and broader is
planned.
REFERENCES
Azam, M. and Kingdon, G. (2014). Assessing the
Teaching Quality in India. Azam, Mehtabul
and Kingdon, Geeta Gandhi, Assessing Teacher
Quality in India (October 21, 2014). Available
at SSRN: https://ssrn.com/abstract=2512933 or
http://dx.doi.org/10.2139/ssrn.2512933 .
Chen, C.-Y., Chen, P.-C., and Chen, P.-Y. (2014). Teaching
Quality in Higher Education: An Introductory Review
on a Process-Oriented Teaching-Quality Model. To-
tal Quality Management & Business Excellence, 25(1-
2):36–56.
Chen, W., Mason, S., Staniszewski, C., Upton, A., and Val-
ley, M. (2012). Assessing the Quality of Teachers’
Teaching Practices. Educational Assessment, Evalua-
tion and Accountability, 24(1):25–41.
Dilshad, R. M. (2010). Assessing Quality of Teacher Ed-
ucation: A Student Perspective. Pakistan Journal of
Social Sciences, 30(1):85–97.
Duarte, D. and Martins, P. (2011). A Maturity Model
for Higher Education Institution. In Proceedings of
the 23rd International Conference on Advanced In-
formation Systems Engineering Doctoral Consortium
(CAISE), pages 25–45.
Forrester, E. C., Buteau, B. L., and Shrum, S. (2011). CMMI
for Services: Guidelines for Superior Service. Pearson
Education.
Ling, T. C., Jusoh, Y. Y., Abdullah, R., and Alwi, N. H.
(2012). A Review Study: Applying Capability Matu-
rity Model in Curriculum Design Process for Higher
Education. Journal For The Advancement Of Science
& Arts, 3(1):46–55.
Lutteroth, C., Luxton-Reilly, A., Dobbie, G., and Hamer, J.
(2007). A Maturity Model for Computing Education.
In Proc. of the 9th Australasian Conf. on Comput-
ing Education-Volume 66, pages 107–114. Australian
Computer Society, Inc.
Marshall, S. and Mitchell, G. (2004). Applying SPICE to e-
learning: An e-learning Maturity Model? In Proceed-
ings of the Sixth Australasian Conference on Comput-
ing Education-Volume 30, pages 185–191. Australian
Computer Society, Inc.
Mehrens, W. A. (1990). Assessment of Teaching: Pur-
poses, Practices, and Implications for the Profession,
chapter Assessing the Quality of Teacher Assessment
Tests, pages 77–136. DigitalCommonsUniversity of
Nebraska - Lincoln.
Montgomery, B. (2003). Developing a Technology Inte-
gration Capability Maturity Model for K-12 Schools.
PhD thesis, Concordia University.
Neuhauser, C. (2004). A Maturity Model: Does it Provide
a Path for Online Course Design. The Journal of In-
teractive Online Learning, 3(1):1–17.
Norman, F. E., Pfleeger, S., et al. (1997). Software Metrics:
a Rigorous and Practical Approach. PWS Pub.
OECD (1961). TALIS Techn. Rep. Teach-
ing and Learning International Survey.
http://www.oecd.org/education/talis (accessed on
06.08.2018).
Petrie, M. (2004). A Model for Assessment and Incremen-
tal Improvement of Engineering and Technology Ed-
ucation in the Americas. In Proceedings of Second
LACCEI International Latin American and Caribbean
Conference for Engineering and Technology (LAC-
CEI’2004).
Rec¸i, E. and Bollin, A. (2016). Department of
Informatics-Didactics, Universit
¨
at Klagenfurt.
http://iid.aau.at/bin/view/Main/Projects (accessed on
01.06.2018).
Rec¸i, E. and Bollin, A. (2017). Managing the Qual-
ity of Teaching in Computer Science Education. In
CSERC‘17 Proc. of the 6th Computer Science Educa-
tion Research Conf., pages 38–47.
Rec¸i, E. and Bollin, A. (2018). A Teaching Process Ori-
ented Model for Quality Assurance in Education - Us-
ability and Acceptability. In IFIP TC 3 – Open Con-
ference on Computers in Education, OCCE .
Rees, D. G. (2000). Essential Statistics, volume 50. CRC
Press.
Snook, I., O’Neill, J., Birks, K. S., Church, J.,
and Rawlins, P. (2013). The Assessment of
Teacher Quality: An Investigation into Current Is-
sues in Evaluating and Rewarding Teachers. Edu-
cation Policy Response Group, Institute of Educa-
tion, Massey University, 2013. Available at SSRN:
https://ssrn.com/abstract=2326315.
Solar, M., Sabattin, J., and Parada, V. (2013). A Maturity
Model for Assessing the Use of ICT in School Educa-
tion. Journal of Ed. Tech. & Society, 16(1):206–218.
Tolikas, K. and Heravi, S. (2008). The Anderson–Darling
Goodness-of-Fit Test Statistic for the Three-Parameter
Lognormal Distribution. Communications in Statis-
tics—Theory and Methods, 37(19):3135–3143.
Yuan, M. and Lin, Y. (2006). Model Selection and Estima-
tion in Regression with Grouped Variables. Journal
of the Royal Statistical Society: Series B (Statistical
Methodology), 68(1):49–67.
The Evaluation of a Teaching Maturity Model in the Context of University Teaching
367
