
Georeferencing of Road Infrastructure from Photographs using
Computer Vision and Deep Learning for Road Safety Applications
Simon Graf
1
, Raphaela Pagany
1,2
, Wolfgang Dorner
1
and Armin Weigold
1
1
Institute for Applied Informatics, Technische Hochschule Deggendorf, Grafenauer Str. 22., Freyung, Germany
2
Department of Geoinformatics Z_GIS, Salzburg University, Salzburg, Austria
Keywords: Crash Barrier, Fence, Georeferencing, Infrastructure Documentation, Computer Vision, Deep Learning and
Neural Network.
Abstract: Georeferenced information of road infrastructure is crucial for road safety analysis. Unfortunately, for
essential structures, such as fences and crash barriers, exact location information and extent is often not
available hindering any kind of spatial analysis. For a GIS-based study on wildlife-vehicle collisions
(WVCs) and, therein, the impact of these structures, we developed a method to derive this data from video-
based road inspections. A deep learning approach was applied to identify fences and barriers in photos and
to estimate the extent and location, based on the photos’ metadata and perspective. We used GIS-based
analysis and geometric functions to convert this data into georeferenced line segments. For a road network
of 113 km, we were able to identify over 88% of all barrier lines. The main problems for the application of
this method are infrastructure invisible from the road or hidden behind vegetation, and the small sections
along the streets covered by photos not depicting the tops of higher dams or slopes.
1 INTRODUCTION
Road safety analysis, such as accident analysis of
wildlife-vehicle collisions (WVCs), strongly relies
on the availability of road infrastructure
documentation such as fences or crash barriers. For
the majority of German roads, this information is not
available to be processed automatically by GIS or
other software applications. Documentations are
usually based on individual construction plans or in
table format and often lack georeferences. For over
230,000 km of public roads in Germany, a classical
manual georeferencing would be costly. Hence, we
propose in this paper a deep learning and computer
vision driven approach to automatically
georeference crash barriers and fences using photos
from official road inspections. While this material is
either available or can be easily produced for
projects, this form of digital material might provide
a data basis for automatic processing, in contrast to
the digitisation and analysis of lists or reports.
Then, the geolocation of the photos is used to apply
basic geometric analysis to estimate position and
extent of fences and crash barriers as linear road
accompanying structures in GIS. The objective is to
produce a line geometry representing extent and
location of crash barriers and fences that can be used
for later spatial analysis of WVCs. The automatic
detection or analysis of the design, quality or status
of these structures is not in the scope of this work.
The paper is structured as follows: After an
introduction of the GIS and road safety based
motivation of this research, we present different
computer vision applications used in other
disciplines, suitable to be applied to this problem.
Further, we introduce the available photo material
from video road inspections used in a test region.
After the description of the algorithmic approach
and the system components used for the automatic
analysis and data extraction, results of the analysis
are presented and discussed. Finally, we draw
conclusions with regard to the general purpose of the
approach from a geomatics' and infrastructure
documentation's perspective, and regarding the
specific advantages for the application in WVC
research.
Graf, S., Pagany, R., Dorner, W. and Weigold, A.
Georeferencing of Road Infrastructure from Photographs using Computer Vision and Deep Learning for Road Safety Applications.
DOI: 10.5220/0007706800710076
In Proceedings of the 5th International Conference on Geographical Information Systems Theory, Applications and Management (GISTAM 2019), pages 71-76
ISBN: 978-989-758-371-1
Copyright
c
2019 by SCITEPRESS – Science and Technology Publications, Lda. All rights reserved
71
2 LITERATURE AND STATE OF
THE ART
2.1 Infrastructure Analysis
Using computer vision to extract road and
infrastructure information from aerial photos, road
inspection photos, videos or car cams has a long
tradition. Also the combination of feature extraction
from photographs and georeferencing of
infrastructure, as a combination of computer vision
and GIS, was already tested, e.g. for the
identification of pavement distress (Obaidat and Al-
kheder, 2006) and automated building and control of
road inventories, with regard to road marking as one
example (Šegvic et al., 2010). A main application of
computer vision for the identification of road
inventory are traffic signs (de la Escalera et al.,
1997; Fang et al., 2003; Greenhalgh and Mirmehdi,
2012). Therefor also deep learning neural networks
were applied (Vitabile et al., 2002; Wu et al., 2013).
Georeferenced information about WVC relevant
road infrastructure, such as crash barriers and fences,
are a limiting factor for diverse studies. Most studies
dealing with fences only include small areas or a
limited number of test sites (Villalva et al., 2013).
Several publications relating on WVCs focus on
other parameters, such as traffic data, and the
spatiotemporal analysis of WVCs (Garriga et al.,
2017; Hothorn et al., 2015; Huijser et al., 2016;
Kruuse et al., 2016), which may indicate that a lack
of infrastructure data restricts the type of studies.
2.2 Artificial Intelligence
In the ImageNet competition, images are classified
with a DNN and exceeded the accuracy of
conventional algorithms for the first time. The
Inception V3 and V4 networks deliver currently the
best results and significantly higher recognition rates
than conventional image classification algorithms
(Canziani et al., 2016).
By using transfer learning, a net with a large number
of images is pre-trained, usually with the ImageNet
dataset. This includes more than 15 million images
trained on about 22,000 classes that can be used
freely. This is the basis for a stable classification of
new data. (Krizhevsky et al., 2017; Lagunas and
Garces, 2018)
For the application on specific new categories, only
hundreds of additional photos are needed for transfer
learning to achieve almost identical results. This
approach is interesting in the presented case because
a small training dataset must be classified manually,
in contrast to build an individual DNN from the
scratch. The dataset with the own categories can be
used for retraining the pre-trained DNN.
3 MATERIAL
Due to the focus of the underlying project on WVCs,
we selected the Bavarian Forest as a test site.
Nonetheless, results should be transferable to other
regions or states. The district Freyung-Grafenau is a
WVC prone area. In this district, we have three
federal highways (B 12, 85 and 533) with a total
length of 113 km. While the majority of WVCs
takes place at roads of second (federal highways)
and third order (district roads) and there, the
majority of fences and barriers are located, we
decided to focus on these road classes and not to
consider smaller rural roads.
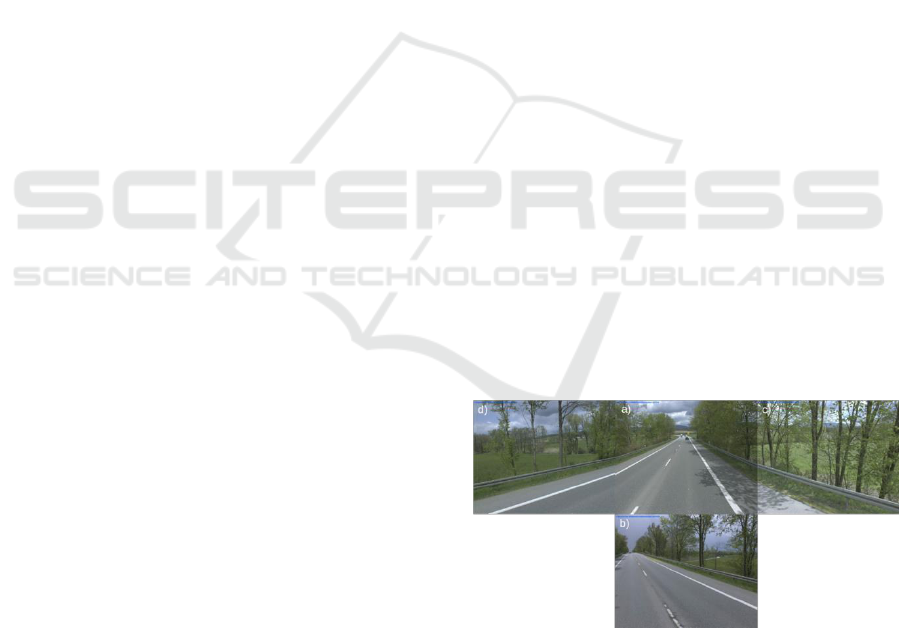
For these roads, photos from road inspections of the
Bavarian Ministry of Living, Building and
Transportation from 2015 were available for all parts
of the federal road network. The data set consists of
a front and rear view, plus two side views (front to
the left and front to the right) for each position
(Figure 1). The resolution of the photos was 1,280 to
1,024 pixels with a colour depth of 24 bit. The
inspection was recorded with a quite constant speed
of around 80 km per hour to get similar distances
between two inspection points, which are close
enough together (around 20 meters) for deriving a
complete road picture on the federal highways. In
total, 5,596 inspection positions with two photos
each (right and left for each position) were used for
the analysis (front and rear sides were ignored).
Figure 1: Road inspection photos from one position taken
in four directions a) front, b) rear, c) front right, and d)
front left.
GISTAM 2019 - 5th International Conference on Geographical Information Systems Theory, Applications and Management
72

4 PROPOSED METHOD
DNNs depend on a set of pre-classified data to train
the network. The set of classified photographs was
too small to be split into a training, validation and a
test data set and to apply machine learning. Transfer
learning was used to train the data set with a larger
set of thematically unspecific photos. As a DNN
Framework, we used TensorFlow (TF) in the version
1.8.0.
The ImageNet data set with 1.2 million images
(Lagunas and Garces, 2018) was used for the pre-
training. The network was trained to about 1,000
categories and forms, the basis for own classes
during transfer learning. This provides the pre-
trained model Inception V3, and can be used for
transfer learning.
Afterwards the last part of the net was re-trained
with an own dataset. The initial weights of the
neurons are taken from the pre-trained net. The
parallelization from TensorFlow is used to further
reduce the training duration. A high degree of
automation in training and validation is achieved by
using Python scripts.
The underlying training material stems from road
inspections and consists of four images taken every
20 m. Images are automatically georeferenced, using
the camera position. The lateral images are used, as
these are the best for the detection of the structures.
The Inception V3 model requires images with a size
of 299 x 299 pixels as input, whereby automatic
scaling is applied to the input data from TensorFlow.
The investigations and behaviour monitoring of the
training have shown that 6,000 training steps are
sufficient, since an increase of training steps no
longer results in an increase of the recognition rate.
The detection of crash barriers and fences was split
up to two separate DNNs, as this produced better
results than the distinction of crash barriers, fences
or neither of them in a single DNN.
Fence detection was performed using 398 images
with fences, 211 from recordings of the left roadside
and 187 images from the right roadside, and 418
without fences on the picture.
For the detection of crash barriers, 455 images with
crash barriers and 380 without crash barriers were
manually classified and used for transfer learning.
The images were divided into 80% training data,
10% validation data and 10% test data. The training
data was shuffled so that left and right images were
used alternately.
The determination of whether the barrier is on the
left or right side of the street is determined by the
recording direction of the input image. The detection
accuracy between left and right fences differs due to
the distance from the fence to the camera. The
shortest distance to fences on the right side is about
2.5 m, and on the left side about 6.5 m, depending
on the width of the road and the distance from the
fence to the road. Crash barriers are almost always
closer to the camera and more visible because of the
structure. For this reason, the classification accuracy
does not differ significantly on right to left images
for crash barrier detection.
After the image classification, the data was imported
into a GIS system for georeferencing and building of
the line segments, and for further spatial analysis on
the impact of the barrier structures on wildlife-
vehicle collisions. Image points with identified
barrier information are connected to polylines to
derive closed barrier lines. The labelling from both
pictures at one site are connected to get an explicit
information of an existing crash barrier (true or
false) and fence (true or false). To eliminate single
false classified images, a distance of smaller than
10 m between two inspection points is set as
minimum threshold impeding a barrier line creation.
Line lengths large than 80 m are also deleted. The
probability is very high in such a case that the
barriers in between the inspection points are
disconnected or two points, which are not directly in
a row, are connected falsely. This is done to get a
documentation of barriers as realistic as possible.
Although the inspection coordinates are not
necessarily identical with the visible barriers on the
image, the approach approximates the position of the
barrier to the real geolocation with a minor
inaccuracy of the barriers’ beginnings and endings.
The whole image data set with all its 5,596 images
from road inspections was classified manually to
gather training data for the DNN, and test data, to
analyse the classification quality.
5 RESULTS AND DISCUSSION
Over 92% of the images were classified correctly by
the DNN to recognize crash barriers. Fences were
identified with a rate of nearly 63% (Table 1). The
reason for the lower classification rate of fences may
be caused by invisible parts of fences, hidden by
vegetation and also because of the fragile and
different structure of fences, in contrast to the
massive crash barriers. The detection rate of fences
for the validation data is much higher (95%) than for
the test area (63%). A possible cause could be
overfitting, whereby the neuronal network does not
react generally enough to fences, but to special
Georeferencing of Road Infrastructure from Photographs using Computer Vision and Deep Learning for Road Safety Applications
73
features of the training data. Nevertheless, the
training of the neuronal net with 1000 instead of
6000 training steps resulted in a recognition of
41.9% in the test region, indicating that overfitting
does not take an effect, but the net cannot detect
fences accurately.
One reason could be differences between the images
from the training and the images from the test
region. In order to keep this aspect as low as
possible, the training data was already selected
spatially and temporally randomly.
Normally, crash barriers are in a near distance to the
road and they are very similar structured, in
comparison to fences (different types like game
fences, pasture fences etc.). Furthermore, the
resolution of the images and especially the number
of input neurons of the DNN limits the recognition
rate. The spatial resolution, i.e. the distance between
the images, limits the improvement of the DNN
results by GIS solutions.
Table 1: Quality of auto-classification of images for Bar =
Crash Barrier and Fen = Fence in %.
In
%
Bar
left
Bar
right
Bar
total
Fen
left
Fen
right
Fen
total
False
7.7
7.7
7.7
55.2
19.5
37.4
True
92.3
92.3
92.3
44.8
80.5
62.6
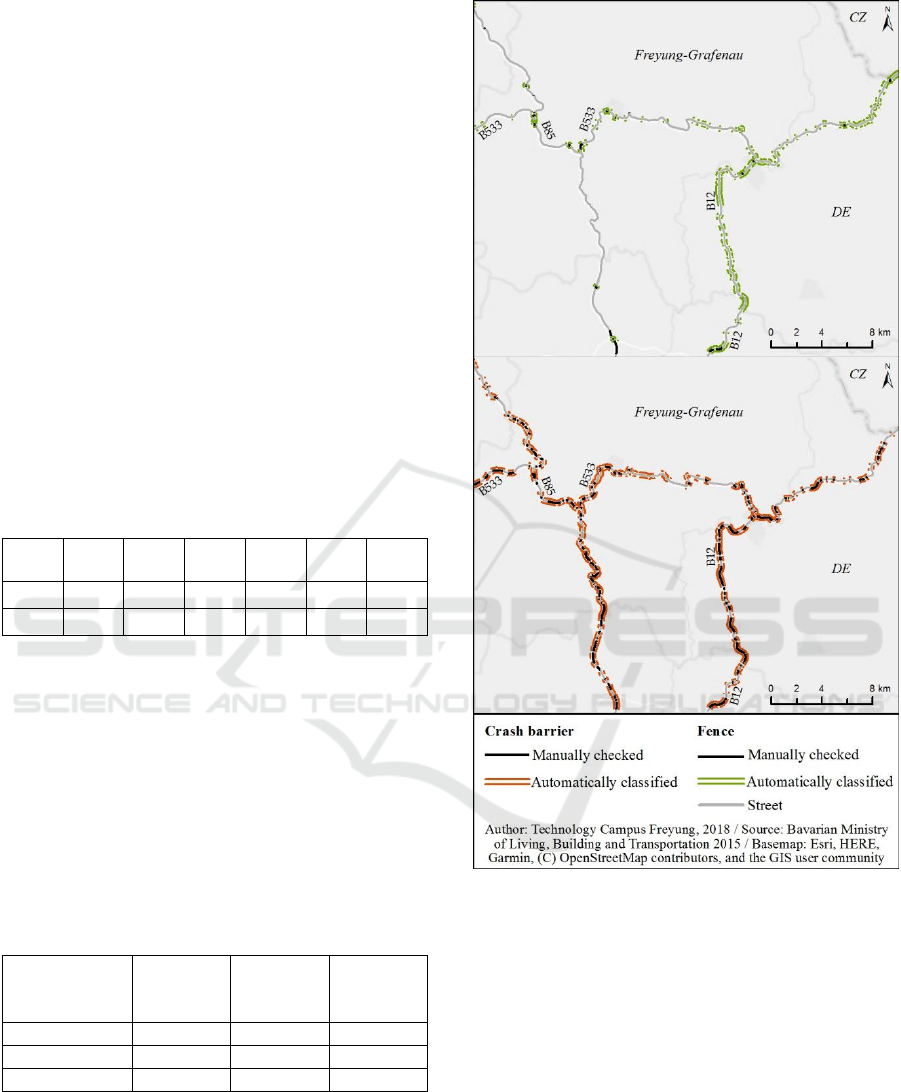
Table 2 shows the comparison of actual crash
barriers and fences, in contrast to the detected ones,
based on the GIS line segments (see also Figure 2).
Individual outliers were filtered out with the aid of
spatial models. For example, a detected barrier
surrounded by images without detected barriers is
very unlikely, since crash barriers and fences usually
have a certain minimum length. Conversely, gaps in
recognition can be closed based on the same
principle.
Table 2: Comparison between automatic classified and
manual checked barrier lines in GIS.
Road sections
(in km) with:
Correct
classified
Reality
(manual
checked)
Correct
in %
Crash barriers
67
72.5
92.4%
Fences
7
11.4
61.4%
Total
74
83,9
88.2%
Figure 2 also shows the crash barriers of federal
highways detected in the test area and the actual
crash barriers. The detection rate was 92% from the
detected in comparison to the actual crash barriers.
Figure 2: Maps of classified fences (green, above) and
crash barriers (red, below) in comparison to reality (black
lines).
For the reasons mentioned, the detection rate of
fences is only 61.4% (Figure 3). This leads to an
overall detection rate of over 88% of real barrier
lines. Finally, the results show that barriers along
streets can be classified using DNN. The results can
be used for georeferenced documentation of road
barriers in GIS and can be partially improved using
GIS techniques.
The combined approach of DNN and GIS ensures an
overall good quality of the results by filtering and by
transferring the DNN results into geodata. While the
example of crash barriers shows already the
GISTAM 2019 - 5th International Conference on Geographical Information Systems Theory, Applications and Management
74
potential of the approach, the results for fences fall
short with regard to overall quality and completeness
(coverage of real fence segments). While camera
inspections are normally performed during daylight
and good weather conditions, the quality of the
recording does not show any potential for
improvement. One significant shortcoming for
identifying fences is the low resolution of images
used by ImageNet. Second, the classification scheme
of fence, while searching for animal protection
fence, might influence the results, because fences
can differ strongly in their visual appearance. Also
an increase in the amount of training material might
contribute to improve classification accuracy.
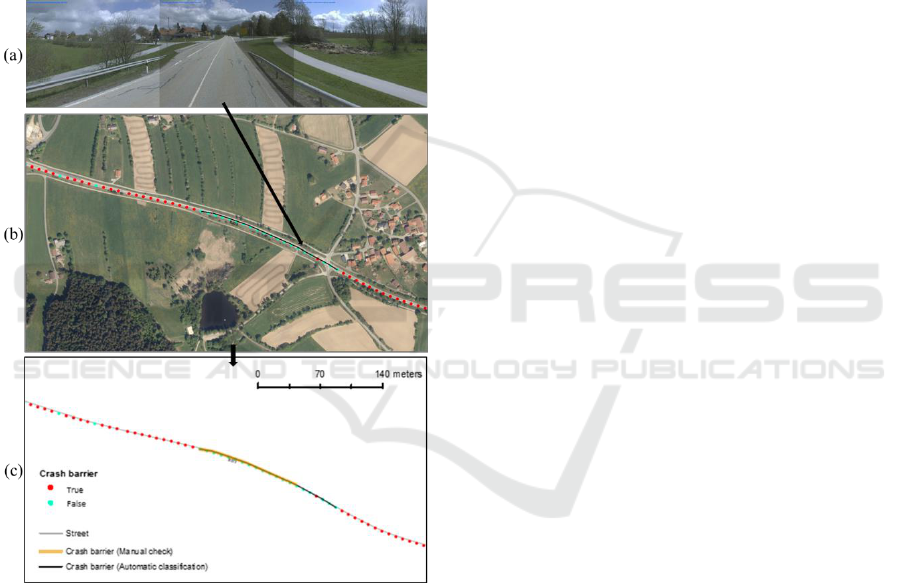
Figure 3: Map of a road section with image point
information (Crash barrier true or false); (a) images (left,
middle, and right) of one inspection point; (b) aerial
photograph and converted barrier line information in GI;
(c) the same section with classified and manual checked
barrier information in comparison.
6 CONCLUSIONS AND
RECOMMENDATIONS
This research intended to test a methodology to
automatically derive a georeferenced inventory of
road side infrastructure such as crash barriers and
fences. Using a DNN and applying it, based on
transfer learning, on road inspection photos, we were
able to detect the structures in the images. Based on
the coordinates of the photo and using GIS, we
derived barrier lines as a georeferenced inventory.
Although the detection quality should be further
improved and, hence, the quality of the overall
inventory, the results are promising due to an
automatized documentation of road inventory on a
large scale.
Potentials for improvement are in the quality of
images as input material, the quantity of data used
for training, and a more differentiated training
strategy. Currently, we did not consider differences
in the resolution of images from the left and from
the right hand side of the car, and we did not
distinguish between different fence types. Images
from different sides have different resolutions for the
same type of object. With regard to fences, this
might be already an issue because the differences in
distance between object and camera result in 50-60
pixel resolution for the breadth of a fencepost at the
right hand side of the street and the right camera. A
fencepost at the left hand side with the same distance
to the street, and depicted in the left camera image,
shows a resolution between 10-18 pixels only.
Further on, types of fences, acting as barriers to
animals, show slightly different patterns. As a
consequence, training material for each fence type is
significantly smaller than expected. Nonetheless, the
methodology provided the relevant material to
analyse WVCs, where in the beginning no data
about these roadside infrastructures was available. It
should be possible to transfer results also to other
countries. It needs to be tested, what the impact of
different design concepts for fences and barriers
means for the automatic detection. Maybe a transfer
would require an additional learning phase with
specific images for the countries’ infrastructure and
its design.
ACKNOWLEDGEMENTS
Research was financed by the German Federal
Ministry of Transport and Digital Infrastructure
(BMVI) as part of the mFund project “WilDa –
Dynamic Wildlife-vehicle collision warning, using
heterogeneous traffic, accident and environmental
data as well as big data concepts” grant number
19F2014A.
Accident data provided by The Bavarian
Ministry of the Interior, for Sport and Integration
and the Bavarian Police; photo material provided by
Georeferencing of Road Infrastructure from Photographs using Computer Vision and Deep Learning for Road Safety Applications
75

Bavarian Ministry of Living, Building and
Transportation.
REFERENCES
Canziani, A., Paszke, A., Culurciello, E., 2016. An
Analysis of Deep Neural Network Models for
Practical Applications. arXiv:1605.07678 [cs].
de la Escalera, A., Moreno, L.E., Salichs, M.A., Armingol,
J.M., 1997. Road traffic sign detection and
classification. IEEE Transactions on Industrial
Electronics 44, 848–859.
https://doi.org/10.1109/41.649946
Fang, C.-Y., Chen, S.-W., Fuh, C.-S., 2003. Road-sign
detection and tracking. IEEE Transactions on
Vehicular Technology 52, 1329–1341.
https://doi.org/10.1109/TVT.2003.810999
Garriga, N., Franch, M., Santos, X., Montori, A., Llorente,
G.A., 2017. Seasonal variation in vertebrate traffic
casualties and its implications for mitigation measures.
Landscape and Urban Planning 157, 36–44.
https://doi.org/10.1016/j.landurbplan.2016.05.029
Greenhalgh, J., Mirmehdi, M., 2012. Real-Time Detection
and Recognition of Road Traffic Signs. IEEE
Transactions on Intelligent Transportation Systems 13,
1498–1506.
https://doi.org/10.1109/TITS.2012.2208909
Hothorn, T., Müller, J., Held, L., Möst, L., Mysterud, A.,
2015. Temporal patterns of deer–vehicle collisions
consistent with deer activity pattern and density
increase but not general accident risk. Accident
Analysis & Prevention 81, 143–152.
https://doi.org/10.1016/j.aap.2015.04.037
Huijser, M.P., Fairbank, E.R., Camel-Means, W., Graham,
J., Watson, V., Basting, P., Becker, D., 2016.
Effectiveness of short sections of wildlife fencing and
crossing structures along highways in reducing
wildlife–vehicle collisions and providing safe crossing
opportunities for large mammals. Biological
Conservation 197, 61–68.
https://doi.org/10.1016/j.biocon.2016.02.002
Krizhevsky, A., Sutskever, I., Hinton, G.E., 2017.
ImageNet classification with deep convolutional
neural networks. Communications of the ACM 60,
84–90. https://doi.org/10.1145/3065386
Kruuse, M., Enno, S.-E., Oja, T., 2016. Temporal patterns
of wild boar-vehicle collisions in Estonia, at the
northern limit of its range. European Journal of
Wildlife Research 62, 787–791.
https://doi.org/10.1007/s10344-016-1042-9
Lagunas, M., Garces, E., 2018. Transfer Learning for
Illustration Classification. arXiv:1806.02682 [cs, stat].
https://doi.org/10.2312/ceig.20171213
Obaidat, M.T., Al-kheder, S.A., 2006. Integration of
geographic information systems and computer vision
systems for pavement distress classification.
Construction and Building Materials 20, 657–672.
https://doi.org/10.1016/j.conbuildmat.2005.02.009
Šegvic, S., Brkić, K., Kalafatić, Z., Stanisavljević, V.,
Ševrović, M., Budimir, D., Dadić, I., 2010. A
computer vision assisted geoinformation inventory for
traffic infrastructure, in: 13th International IEEE
Conference on Intelligent Transportation Systems.
Presented at the 13th International IEEE Conference
on Intelligent Transportation Systems, pp. 66–73.
https://doi.org/10.1109/ITSC.2010.5624979
Villalva, P., Reto, D., Santos-Reis, M., Revilla, E., Grilo,
C., 2013. Do dry ledges reduce the barrier effect of
roads? Ecological Engineering 57, 143–148.
https://doi.org/10.1016/j.ecoleng.2013.04.005
Vitabile, S., Gentile, A., Sorbello, F., 2002. A neural
network based automatic road signs recognizer, in:
Proceedings of the 2002 International Joint
Conference on Neural Networks. IJCNN’02 (Cat.
No.02CH37290). IEEE, Honolulu, HI, USA, pp.
2315–2320.
https://doi.org/10.1109/IJCNN.2002.1007503
Wu, Y., Liu, Y., Li, J., Liu, H., Hu, X., 2013. Traffic sign
detection based on convolutional neural networks, in:
The 2013 International Joint Conference on Neural
Networks (IJCNN). IEEE, Dallas, TX, USA, pp. 1–7.
https://doi.org/10.1109/IJCNN.2013.6706811
GISTAM 2019 - 5th International Conference on Geographical Information Systems Theory, Applications and Management
76
