
Investigating Mobile Applications Quality in Official and Third-party
Marketplaces
Fausto Fasano
1
, Fabio Martinelli
2
, Francesco Mercaldo
2,1
and Antonella Santone
1
1
Department of Bioscience and Territory, University of Molise, Pesche (IS), Italy
2
Institute for Informatics and Telematics, National Research Council of Italy (CNR), Pisa, Italy
Keywords:
Mobile, Software, Quality, Metrics, Android.
Abstract:
One of the winning factors of Android was the use of the Java programming language and the XML language
for application development. Furthermore, the open-source license and the availability of reverse engineering
tools stimulated the proliferation of third-party markets where users can download for free repackaged version
of commercial app, facilitating the phenomenon of plagiarism. In this paper we present an empirical study
aimed to define whether there are differences from the quality point of view in Android applications available
in the official market and in third-party ones, investigating whether supervised and unsupervised models built
with a set of features belonging to four categories (i.e., dimensional, complexity, object oriented and Android)
are effective in app store detection.
1 INTRODUCTION
Mobile devices are nowadays present in every activ-
ity of our everyday life. For each activity we are in-
terested to perform, there exists an app than can sup-
port us. This huge spread of mobile applications is
largely due to the capillary diffusion of the Android
operating system. As a matter of fact, in September
2018 76.61% of the mobile operating system market
share worldwide is belonging to Android, while only
20.66% is related to iOS (statcounter, 2018). This
success is also due to the immense number of apps
available on the official market of Google. In March
2018, the number of available apps in the Google Play
Store
1
was most placed at 2.6 million apps, after
just surpassing 1 million apps in July 2013 (statista,
2018). Google Play was launched in October 2008
under the name Android Market. As Google’s official
app store it offers a range applications and digital me-
dia including music, magazines, books, film and TV.
These factors, together with its open source nature, al-
lowed the spread of phenomena such as repackaging.
Basically, in repackaging the developer decom-
piles a legitimate application in order to obtain the
source code, then perform some kind of modifica-
tion, and he /she compiles the application back with
the payload to make it available on various alternat-
1
https://play.google.com/store?hl=it
ive market, and sometimes even on the official market
(Canfora et al., 2015c).
The user is often encouraged to download repack-
aged applications because they are free versions of
famous and legitimate applications sold on the offi-
cial market.
Among the most common modifications per-
formed in the repackaged version of the app we find:
replacing an API library with an adversary owned lib-
rary; redirecting the advertisement (ads) revenue of
the app, in case the app uses some ads; adding some
ads to the app; introducing malicious code inside
existing method(s) (Canfora et al., 2018), (Cimitile
et al., 2017); adding method/class specially for intro-
ducing malware code (Rastogi et al., 2016), (Canfora
et al., 2014).
After the necessary modifications
’
the adversary
can prepare a package (APK file) again in an easy
way, using well-known open-source reverse engin-
eering tools (e.g., apktool (apktool, 2018)). The ad-
versary signs the app with her private key so that the
public key in the META-INF directory corresponds
to this private key. This app is then released on some
unofficial market where the user fall prey to it.
Considering that proliferation of repackaged ap-
plications in third-party marketplaces (that it is usu-
ally potentially resulting in a poor quality code), in
this paper we want to investigate whether there is
a difference from the quality point of view between
Fasano, F., Martinelli, F., Mercaldo, F. and Santone, A.
Investigating Mobile Applications Quality in Official and Third-party Marketplaces.
DOI: 10.5220/0007757601690178
In Proceedings of the 14th International Conference on Evaluation of Novel Approaches to Software Engineering (ENASE 2019), pages 169-178
ISBN: 978-989-758-375-9
Copyright
c
2019 by SCITEPRESS – Science and Technology Publications, Lda. All rights reserved
169

apps belonging to different marketplaces.
To this aim, we defined a set of metrics belonging
to four different categories (dimensional, complexity,
object oriented, and Android) to empirically evaluate
whether an app belonging to different marketplaces
exhibits different values for the considered metrics.
Furthermore, using supervised and unsupervised
machine learning techniques, we want to asses
whether the considered metrics can be used to dis-
tinguish between application belonging to official or
unofficial marketplaces.
The paper proceeds as follows: Section 2 dis-
cusses the related literature about the detection of re-
packaged application in the mobile environment, Sec-
tion 3 presents the designed methodology, in Sec-
tion 4 the results of the experiment are discussed. Fi-
nally, Section 5 draws conclusion and future lines of
research.
2 RELATED WORK
Several researchers proposed in last years, the use of
quality code metrics.
For instance, Mercaldo et al. (Mercaldo et al.,
2018) consider the same metric set considered in our
paper to evaluate the code quality between malicious
and legitimate mobile applications. From their point
of view, authors state that also malicious developer
consider code quality in the malicious software im-
plementation.
Scandariato and Walden (Scandariato and
Walden, 2012) consider metrics related to the number
of methods in class, the lack of cohesion of methods,
the average cyclomatic complexity, the number of
Java statements in a class, the unweighted class size,
the number of instance variables defined in the class,
the number of packages, the number of responses per
class, the coupling between objects and the number
of lines of code and comments with the final aim
to predict whether which classes of an Android
application are vulnerable.
Taba et al (Taba et al., 2014) propose metrics
at two different granularity levels (i.e., category and
functionality) to demonstrate that user interface com-
plexity impacts on the user-perceived quality of an
Android application. They consider a set of metrics
gathered by parsing the XML layout of the applica-
tions under analysis: number of inputs and number of
outputs in an activity, number of elements in an activ-
ity, average number of inputs and outputs in an applic-
ation, average number of elements in an application
and average number of activities in an application.
Tian et al. (Tian et al., 2015) investigated metrics
like size of apps, complexity of code, library depend-
ency, quality of code library, complexity of UI, and
requirement on users. Their study aimed to under-
stand how much high-rated apps are different from
low-rated ones. They found that, from the point of
view of the metrics they considered, the difference
between high-rated and low-rated apps is significant.
Hecht et al. (Hecht et al., 2015), (Hecht, 2015)
investigated three object oriented anti-patterns and
four Android anti-patterns. Starting from these anti-
patterns they compute a baseline aimed to compare
new mobile applications with the baseline to under-
stand how much the new applications are far from the
baseline.
To the best of authors knowledge, this is the first
methodology aimed to discriminate between official
and unofficial Android applications through super-
vised and unsupervised machine learning techniques
using a set of quality-oriented metrics.
3 THE METHODOLOGY
In this section, we describe the methodology con-
sidered to discriminate between apps available on
third-party repositories and apps available on the offi-
cial market. We firstly describe the overall proposed
approach to collect and evaluate apps, and then we
focus on the considered metrics.
3.1 The Approach
As shown in Figure 1, the designed approach for eval-
uating the code quality of Android applications to un-
derstand whether quality varies in mobile applications
belonging to different marketplaces consists of four
steps:
1. Data Collection: In this step, a set of real world
Android applications in the APK format (the
package file format used by the Android OS) is
retrieved. An APK file contains the code of the
application (in the binary Dalvik bytecode format
.dex files), the resources, the assets, the certific-
ates, and the manifest file. In order to mine applic-
ations from official market, i.e., Google Play, we
used a web crawler able to automatically down-
load APK files from the Google official market
2
.
The output of this step is an extended collection
of Android applications. To obtain the third-party
applications, we developed two ad-hoc crawlers,
to mine applications respectively from AppChina
3
2
https://play.google.com/
3
http://www.appchina.com/
ENASE 2019 - 14th International Conference on Evaluation of Novel Approaches to Software Engineering
170
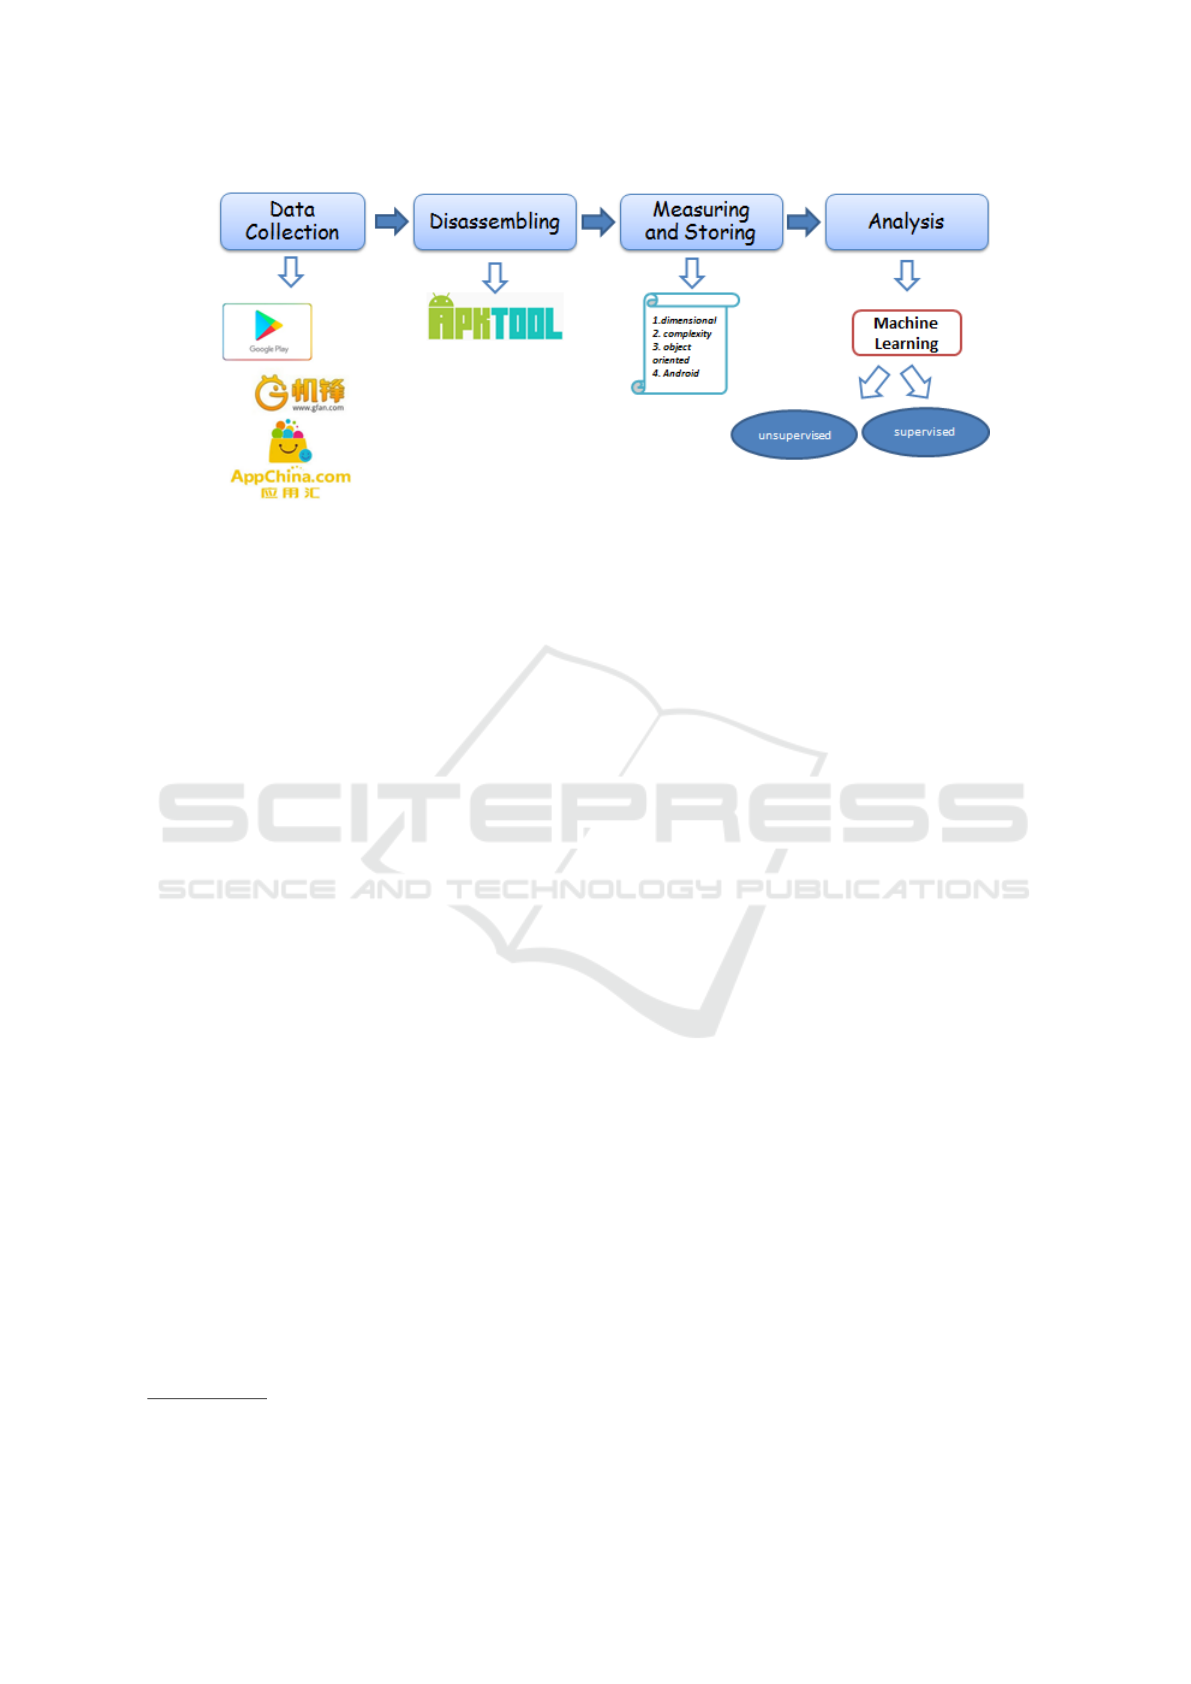
Figure 1: Methodology Schema.
and Gfan
4
markets (two of the most widespread
third-party marketplaces (Canfora et al., 2015b)).
In detail, in the following study we consider 4000
mobile applications, 2000 belonging to Google
Play, while 2000 belonging to third-party mar-
ketplaces (1000 from AppChina and 1000 from
Gfan).
2. Disassembling: In this step, we disassembled the
.dex files contained in the APKs, in order to ob-
tain a set of human readable bytecode .smali
files. To obtain the smali representation of the
.dex files we consider apktool
5
(apktool, 2018),
a widespread tool for Android application re-
verse engineering. Apktool is able to decode re-
sources to nearly original form and rebuild them.
The metrics we considered are computed on the
.smali files. The output of this step is a collec-
tion of .smali files for each APK we collected in
the previous step.
3. Measuring and Storing: in this step, the .smali
files are parsed and we automatically computed
the set of considered metrics in order to meas-
ure the code quality of the collected applications.
For each application, all the smali files generated
for the specific mobile application have been ana-
lyzed using the Python scripts that we have de-
veloped; once analyzed all the smali files, all the
code metrics have been computed for each app:
the output of this step is the set of computed met-
rics for each app. Metrics are retrieved using a
Python script developed by the authors.
4. Analysis: the aim of this step is the application
of machine learning techniques aimed to build a
model to demonstrate whether the extracted fea-
tures are a good candidate to discriminate between
4
http://www.gfan.com/
5
http://ibotpeaches.github.io/Apktool/
Android official and third-party marketplace ap-
plications. We consider supervised and unsuper-
vised machine learning techniques: in the super-
vised technique, the aim is to build a model able to
predict future instances. Considering that the in-
stances in the model exhibit the class output (the
creation of the model is guided by the classes that
will be present in the training set). From the other
side, as unsupervised technique, we consider the
cluster analysis: the output of this task is a model
(as in the supervised machine learning), but in this
case the model is built without any previous in-
formation about the class to predict: as a matter
of fact, the cluster analysis algorithms basically
create clusters of instances. The testing for the
clustering analysis is the verification that all the
instances classified in different clusters are actu-
ally belonging to different classes.
3.2 The Set of Metrics
Below we describe the metrics set considered in
the following paper. To consider different indicat-
ors related to mobile applications under analysis, we
grouped the metrics in four categories: dimensional,
complexity, object oriented and Android metrics.
3.3 Dimensional Metrics
This metric category is aimed at providing a quantit-
ative measure of the software in code size and mod-
ularity terms; these metrics can be traced back to the
1960s, when the Lines of Code metric was usually
considered to measure productivity (Fenton and Neil,
2000).
The metrics belonging to this category we selected
are the following:
• Number of Byte-code Instructions (NBI): This
Investigating Mobile Applications Quality in Official and Third-party Marketplaces
171

metric counts the total number of smali instruc-
tions, ignoring comments and blank lines. This
metric is evaluated by counting all the smali in-
structions not beginning with the characters “#”
(symptomatic of the introduction of a comment
line) and “.”;
• Number of Classes (NOC): This metric computes
the number of classes within the app package. The
metric is computed by counting the occurrences of
the “.class” directive within smali files;
• Number of Methods (NOM): This metric estimates
the amount of methods within the app package.
The metric is computed by counting the occur-
rences of the “.method” directive within the smali
files;
• Instructions per Method (IPM): This metric is
computed by the ratio between the total number
of instructions (i.e., NBI) and the total number of
methods (i.e., NOM). The metric is computed as:
IPM =
NBI
NOM
3.4 Complexity Metrics
The aim of this metric category is estimate the com-
plexity of an application. Since program comprehen-
sion is closely related to program complexity, these
indicators are useful to understand how expensive the
comprehension of a product is when testing activities
have to be performed. A complex program has several
possible paths in the execution tree, so it is usually
difficult or impossible to exhaustively test them all.
As a consequence, complex programs are also more
difficult to understand and maintain.
We consider the following metric set in this cat-
egory:
• Cyclomatic Complexity (CC): This is a complex-
ity metric introduced by Thomas McCabe (Mc-
Cabe, 1976). This metric measures the number of
linearly independent paths contained in the pro-
gram control flow. This metric is computed by
counting the occurrences of conditional instruc-
tions contained in the smali files and incrementing
the resulting number of a unit. To calculate the av-
erage cyclomatic complexity of app’s classes we
used the formula
CC =
#i f instructions + 1
NOC
• Weighted Methods per Class (WMC): This met-
ric was introduced by Chidamber and Kemererb
(Chidamber and Kemerer, 1994). The WMC met-
ric is the sum of the complexities of all class meth-
ods. As in (Jo
ˇ
st et al., 2013), for each app we
computed the average of this metric, through the
formula:
W MC =
NOM
NOC
∗ #paths
3.5 Object Oriented Metrics
Since Android apps are implemented in the Java
object-oriented programming language, it is possible
to assess the quality of the code of the application by
using the metrics suite by Chidamber and Kemerer: a
set of metrics that measure the complexity of the code,
cohesion, and coupling (Chidamber and Kemerer,
1994). The “CK” metrics suite is a widely accep-
ted standard to measure object-oriented software sys-
tems.
The following metrics belong to this category:
• Number of Children (NOCH): This metric indic-
ates the number of immediate subclasses subor-
dinated to a class in the class hierarchy. The
greater the number of children the greater the re-
use, however if a class has a large number of chil-
dren, it may require more testing of the methods in
that class. In smali byte-code the parent of a class
is identified by the “.super” directive. We used
this to build a tree data structure in memory rep-
resenting the class hierarchy. In order to reduce
the data to a single value per app, we considered
the maximum number of children for each class in
the app;
• Depth of Inheritance Tree (DIT): This metric in-
dicates the depth (i.e., the length of the maximal
path starting from the node representing the class
to the root of the tree) of the class in the inher-
itance tree. Deeper trees indicate greater design
complexity, since more methods and classes are
involved. We considered the depth of each inher-
itance tree, found using the “.super’ directive as
discussed in the previous metric. In order to re-
duce the data to a single value per application, we
considered the deepest tree for any class in the ap-
plication;
• Lack of Cohesion in Methods (LCOM): This met-
ric indicates the level of cohesion between meth-
ods and attributes of a class. The level of cohe-
sion is retrieved computing the number of access
to each data field in a class, and find the average.
Subtract from 100 with the aim to obtain a percent
lack of cohesion ((SATC), 1995). Lower percent-
ages indicate greater cohesion of data and meth-
ods. In the smali byte-code, the class attributes
are marked by the keyword “.field” and the access
to a field is indicated by the -> operator;
ENASE 2019 - 14th International Conference on Evaluation of Novel Approaches to Software Engineering
172

• Coupling Between Objects (CBO): This metric in-
dicates the dependency degree between classes of
a system. The metric value is obtained by count-
ing the external methods invocations, that in smali
code are introduced by the keyword “invoke-
static”;
• Percent Public Instance Variables (PPIV): This
metric indicates the ratio of variables introduced
to a “public” modifier (Binder, 1994). We com-
puted the average of this type of variables among
all the classes of the app;
• Access to Public Data (APD): This metric counts
the number of accesses to “public” or “protected”
attributes of each class (Binder, 1994). We com-
puted the average of this value among all classes
belonging to the app under analysis.
3.6 Android Metrics
This metric category is aimed at assessing aspects re-
lated to user-experience, for instance the management
of resources or the handling of possible error condi-
tions. Some important factors that may influence the
user-experience in Android applications are related to
the incorrect use of specific methods that may cause
crashes (Kechagia and Spinellis, 2014), the resources
consumption (Sharkley, ), and the poor responsive-
ness (Yang et al., 2013).
We consider the following metric set belonging to
this category:
• Bad Smell Method Calls (BSMC): Kechagia and
Spinellis (Kechagia and Spinellis, 2014) individu-
ated 10 Android methods throwing exceptions
that can cause app crashes. These methods have to
be invoked in a “try-catch” block. We computed
the number of times these methods are invoked
outside a “try-catch” construct:
• WakeLocks with no Timeout (WKL): A WakeLock
allows to keep the device in an active state, avoid-
ing the switch-off of the display. On a WakeLock
object the following methods could be invoked:
(i) the acquire() method to keep active the dis-
play, and (ii) the release() method to allow the
display switch-off. We computed the number of
times in which only the acquire() method is in-
voked without invoking the release() method;
• Number of Location Listeners (LOCL): Through
the class LocationListener an Android applic-
ation can keep track of the position of the user.
However this functionality reduces the battery
power. This metric computes the number of times
a LocationListener object is instantiated;
• Number of GPS Uses (GPS): Location-aware ap-
plications can use GPS to acquire the user loca-
tion. Although GPS is more accurate, it quickly
consumes battery power. We count byte-code in-
structions containing the “gps” string;
• XML Parsers (XML): In Android applications,
an event-based parser should be preferred be-
cause this kind of parser can save the bat-
tery consumption. We count byte-code in-
structions of the type invoke-static(.*?)
Landroid/util/Xml;->newPullParser();
• Network Timeouts (NTO): Network timeouts
are mechanisms which allow app developers
to set time limits for establishing a TCP
connection. Without setting a timeout can
produce ANR messages. We count all the
smali byte-code instructions of the type:
invoke-static(.*?) Lorg/apache/http/
params/HttpConnectionParams;
->setConnectionTimeout and
invoke-static(.*?) Lorg/apache/http/
params/HttpConnectionParams;
->setSoTimeout;
• Networking (NET): In Android applications
all the networking operations could introduce
latency and consequently cause an Application
Not Responding (ANR) message (Yang et al.,
2013). In order to compute this metric we count
all the smali byte-code instructions of the type:
Landroid/net/ http/AndroidHttpClient;
->execute and Lorg/apache/
http/impl/client/DefaultHttpClient;
->execute;
• File I/O (I/O): I/O operations could cause ANR
messages, since even simple disk operations could
exhibit significant and unexpected latency (Yang
et al., 2013). We count the occurrences among
smali byte-code instructions of the invocation:
new-instance(.*?)Ljava/io/File;
• SQLite (SQL): The database accesses can gen-
erate substantial amount of expensive write op-
erations to the flash storage, with negative
latency implications (Yang et al., 2013). With
the aim to evaluate this metric we count the
occurrences among byte-code instructions of
the invocation: Landroid/database/sqlite/
SQLiteDatabase;->(.*?);
• Bitmaps (BMAP): usually processing of large bit-
maps is expensive from a computational point of
view and it produces ANR messages. To assess
this metric we count the occurrences related to the
BitmapFactory.decode method invocation.
Investigating Mobile Applications Quality in Official and Third-party Marketplaces
173

4 THE EVALUATION
In this section, we present the results of the exper-
iment we performed, aimed to asses the computed
metrics using supervised and unsupervised classific-
ation algorithms.
We consider following basic metrics to evaluate
the effectiveness of models produced through super-
vised and unsupervised machine learning techniques:
• True Positives (TP): is the number of instances
(i.e., apps) that are correctly classified as belong-
ing to the official market;
• True Negatives (TN): is the number of instances
that are correctly classified as belonging to third-
party marketplaces;
• False Positives (FP): is the number of instances
that have been classified as belonging official mar-
ket, while they are belonging to third-party ones;
• False Negatives (FN): is the number of instances
that have been classified as belonging third-party
market, while they are belonging to the official
one.
4.1 Supervised Learning
From the basic metrics, in order to evaluate a super-
vised classification, the following metrics are con-
sidered:
• FP Rate: it represents the ratio of FP to the sum
of FP and TN;
• Precision: it represents the ratio of TP to the sum
of TP and FP;
• Recall: it represents the ratio of TP to the sum of
TP and FN;
• F-measure: it is computed as the ratio of the pre-
cision and recall multiplication to the precision
and recall sum, multiplied by two;
• Roc Area: it represents the probability that a pos-
itive instance randomly chosen is classified above
a randomly chosen negative;
• PRC Area: it represents precision values for cor-
responding recall values.
To enforce the conclusion validity we consider six
different supervised classification algorithms (Caru-
ana and Niculescu-Mizil, 2006):
• BayesNet: a probabilistic model representing a
set of variables and their dependencies through a
directed acyclic graph;
• LMT: an algorithm based on the logistic model
tree;
• J48: an implementation of the C4.5 classification
algorithm;
• Logistic: an algorithm considering the logistic re-
gression;
• RandomForest: a learning algorithm that oper-
ates by constructing a multitude of decision trees;
• JRip: a learning algorithm that considers a pro-
positional rule learner to classify instances.
To evaluated the built models, we use half of the
instances as the training set, while the remaining 50%
is considered as the testing set. In order to evaluate in
the testing set all the instances, for each algorithm we
repeated this procedure twice.
In total we run each algorithms 2 times (i.e., 2-fold
cross validation), Table 1 shows the average result of
the two classification for each algorithm related to the
supervised machine learning experiment.
As shown by supervised classification results in
Table 1, on average, all the algorithms are able to ob-
tain a precision ranging between 0.990 (BayesNet al-
gorithm) and 0.997 (LMT algorithm). Considering
the recall, the average value is ranging between 0.989
(BayesNet algorithm) and 0.997 (LMT algorithm).
The FP rate exhibits really low values, sympto-
matic that the proposed supervised algorithms are
able to correctly classify the instances under analysis.
4.2 Unsupervised Learning
While the supervised classification algorithms clas-
sify instances considering the label of the classes (i.e.,
the classification is guided by the classes of the in-
stances), in the unsupervised learning the classes are
built considering only the differences of the instance
values. This is the reason why obtaining good results
using unsupervised learning is usually an hard task if
compared to supervised one. As a matter of fact, the
success of this task is only depending by the “qual-
ity” of data. For instance, in the cluster analysis, one
of the most widespread unsupervised learning tech-
niques (Romesburg, 2004), the differences between
the instance values are computer in terms of dis-
tances (intra-cluster instances exhibit closed distances
if compared to inter-clusters instances distance).
To evaluate the effectiveness of the unsupervised
learning, we consider the four basic metrics previ-
ously described (TP, TN, FP and FN), and the related
unsupervised learning metrics:
• ICC: this metric counts the incorrect cluster in-
stances, basically it is the sum between FP and
FN;
• PICC: similarly to ICC, it represents the percent-
age of ICC value.
ENASE 2019 - 14th International Conference on Evaluation of Novel Approaches to Software Engineering
174
Table 1: FP Rate, Precision, Recall, F-Measure, Roc Area and PRC Area for the supervised learning.
Algorithm FP Rate Precision Recall F-Measure Roc Area PRC Area Source
0.003 0.996 0.982 0.989 0.994 0.996 third-party
BayesNet 0.018 0.983 0.997 0.990 0.994 0.988 official
0.011 0.990 0.989 0.989 0.994 0.992 average
0.003 0.997 0.996 0.997 0.999 0.998 third-party
LMT 0.004 0.997 0.997 0.997 0.999 0.998 official
0.003 0.997 0.997 0.997 0.999 0.998 average
0.004 0.995 0.995 0.995 0.998 0.996 third-party
J48 0.005 0.996 0.996 0.996 0.998 0.998 official
0.005 0.995 0.995 0.995 0.998 0.997 average
0.003 0.996 0.994 0.995 0.999 0.999 third-party
Logistic 0.006 0.995 0.997 0.996 0.999 0.998 official
0.005 0.995 0.995 0.995 0.999 0.998 average
0.003 0.996 0.995 0.996 0.999 0.999 third-party
RandomForest 0.005 0.996 0.997 0.996 0.999 0.999 official
0.004 0.996 0.996 0.996 0.999 0.999 average
0.003 0.997 0.994 0.996 0.995 0.994 third-party
JRip 0.006 0.995 0.997 0.996 0.995 0.992 official
0.004 0.996 0.996 0.996 0.995 0.993 average
We consider four cluster analysis algorithms (Tan
et al., 2013) with regard to unsupervised learning:
• sIB: it uses the sequential information bottleneck
algorithm. To identify the cluster for the instance
under analysis, it computes the Kullback–Leibler
divergence: a measure of how one probability
distribution is different from a second, reference
probability distribution;
• SimpleKMeans: it uses the k-means algorithm,
considering the Euclidean distance between in-
stances to add instances in clusters;
• GenClustPlusPlus: it generates clusters consid-
ering a genetic algorithm for centroid generation.
It is based on the Euclidean distance;
• MakeDensityBasedCluster: an improved ver-
sion of the k-means algorithm. It is able to fit nor-
mal distributions and discrete distributions within
each cluster.
Table 2 reports the results for the unsupervised ex-
periment we performed.
The cluster analysis algorithms involved in the ex-
periment do not exhibit similar performances, in con-
trast to the results we obtained in the supervised clas-
sification task.
In detail, the SimpleKMeans, the GenClustPlus-
Plus and the MakeDensityBasedCluster exhibit a
PICC value ranging between 41% and 43%. The only
algorithm that obtains interesting performances is the
sIB one, with a PICC value equal to 0.57% and an
ICC equal to 23 (the FP is equal to 17 and the FN
equal to 6).
Figure 2 depicts the cluster assignments generated
from the unsupervised algorithms we considered. The
blue points represent the cluster related to the offi-
cial market app, while the red points represent the in-
stances related to third-party marketplaces apps.
The a) cluster assignment in Figure 2 represents
the distributions of blue and red points generated by
the sIB algorithm, the b) cluster assignment the distri-
butions generated by the SimpleKMeans algorithm,
the c) cluster assignment the distribution generated
by the GenClustPlusPlus algorithm and the d) cluster
assignment the distribution generated by the Mak-
eDensityBasedCluster algorithm.
The cluster assignments confirm the results of
the ICC and PICC metrics: it can be noted that
the clusters in the a) cluster assignment in Fig-
ure 2 are well defined and there is a clear distinc-
tion between the red (third-party) and the blue (of-
ficial) points. Considering that the central point of
cluster analysis algorithms is the distance computa-
tion, the reason why we obtain good performances
with the sIB algorithm is related to the usage of the
Kullback–Leibler divergence to assign instances to
clusters. Indeed, the SimpleKMeans, GenClustPlus-
Plus and MakeDensityBasedCluste algorithms con-
sider the Euclidean distance, that is resulting not ap-
propriate to solve to problem to discriminate between
official and third-party marketplace application using
quality-based metrics.
Investigating Mobile Applications Quality in Official and Third-party Marketplaces
175
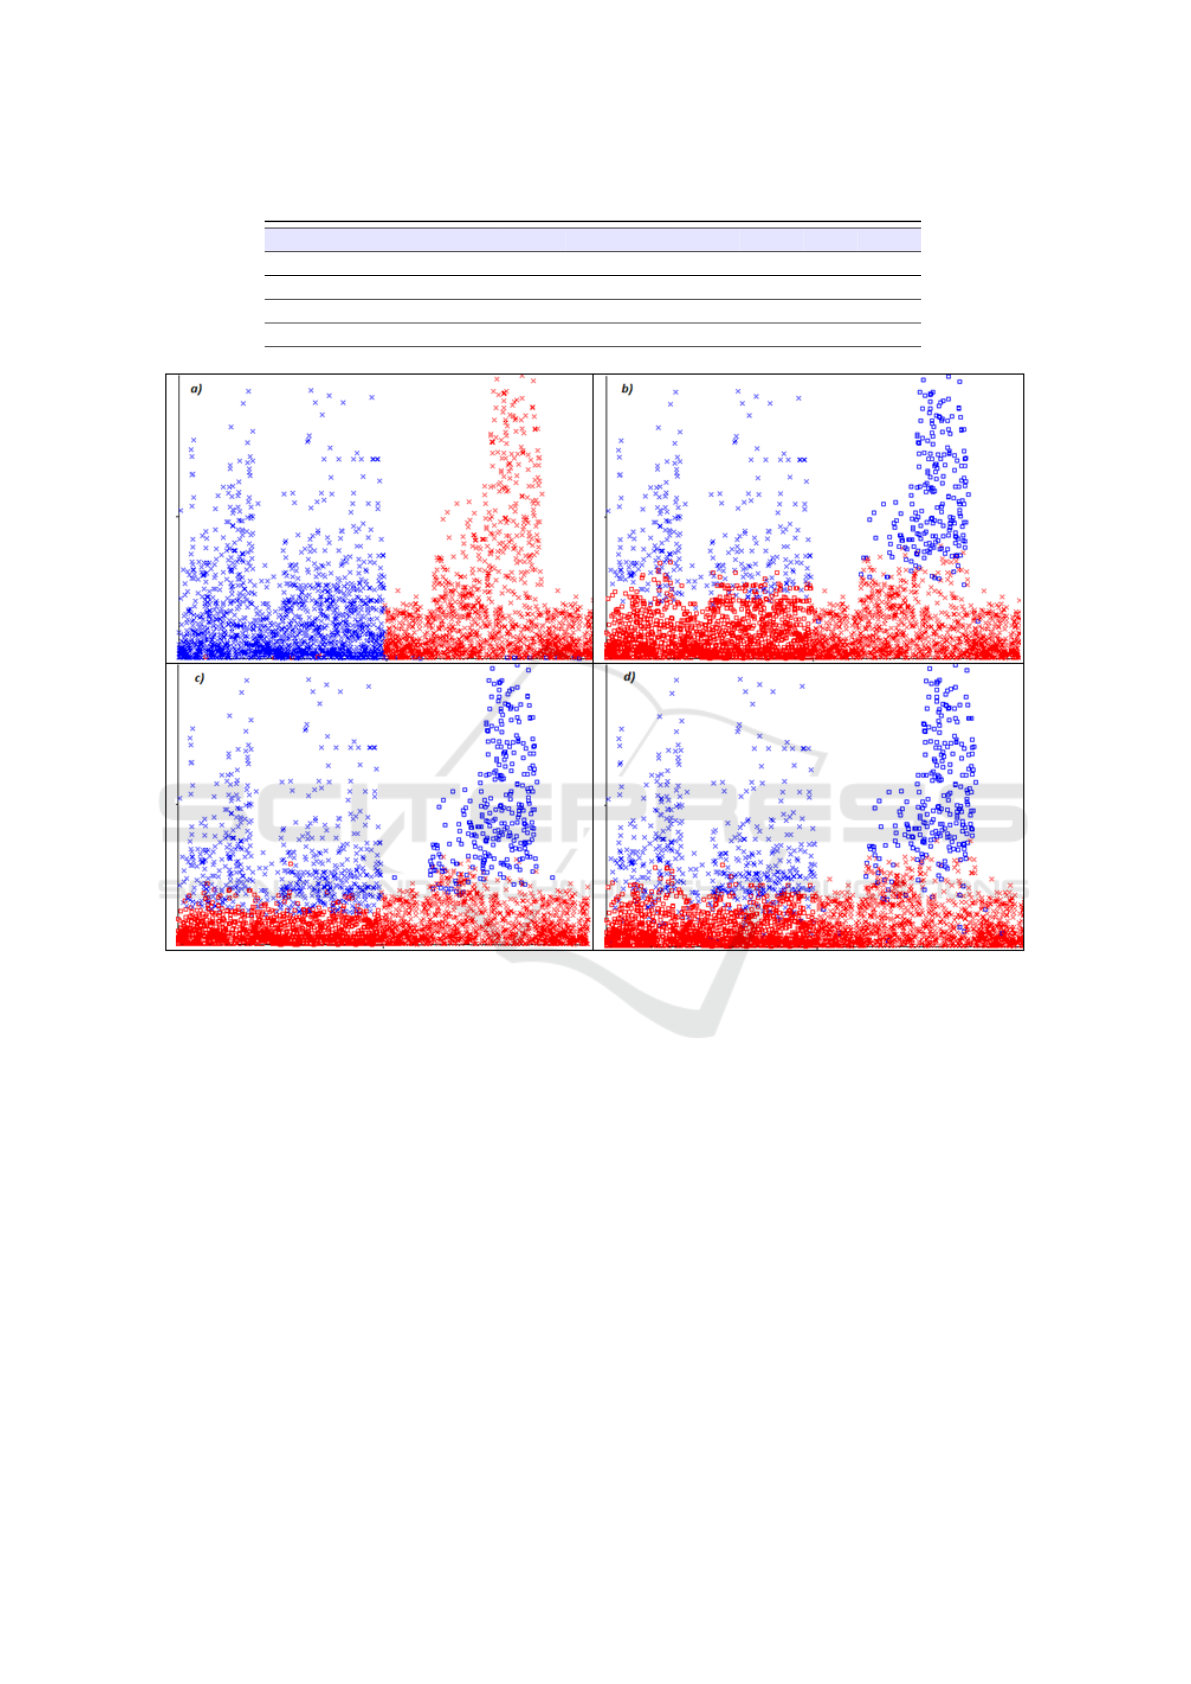
Table 2: ICC, PICC, TP, TN, FP and FN for the unsupervised learning.
Algorithm ICC PICC TP TN FP FN
sIB 23 0.5788 % 1984 1967 17 6
SimpleKMeans 1900 47.8108 % 1751 323 250 1650
GenClustPlusPlus 1665 41.8973 % 1667 642 334 1331
MakeDensityBasedCluster 1745 43.9104 % 1706 523 295 1450
Figure 2: Cluster assignments.
5 CONCLUSION AND FUTURE
WORK
In this paper, we investigated the quality of mobile
applications freely available on the official and unof-
ficial Android marketplaces.
We selected a set of metrics, belonging to four dif-
ferent categories (i.e., dimensional, complexity, ob-
ject oriented and Android) and we considered a real
world dataset composed of 4000 applications belong-
ing to the Android official market and to two third-
party marketplaces (AppChina and Gfan).
In order to understand the ability of the features
set to discriminate between mobile apps belonging to
different marketplaces, we adopted both supervised
and unsupervised machine algorithms.
The best supervised algorithm in terms of clas-
sification performances is the LMT one (precision
equal to 0.997 and recall equal to 0.997). With regard
to the unsupervised learning, the best algorithm is res-
ulted the sIB, with an ICC equal to 23 and a PICC
equal to 0.5788%.
As a future work, we plan to investigate whether
adding more features it is possible to discriminate
between different not official marketplaces. Further-
more, it can be of interest to compute the code sim-
ilarity between official and unofficial application to
quantify the presence of cloned applications in third-
party marketplaces.
Furthermore, we will explore whether formal veri-
fication (Santone et al., 2013) techniques can be use-
ful to obtain better performances, as already demon-
strated in other fields such as biology (Ruvo et al.,
2015; Ceccarelli et al., 2014), computer security
(Mercaldo et al., 2016; Maiorca et al., 2017; Canfora
ENASE 2019 - 14th International Conference on Evaluation of Novel Approaches to Software Engineering
176

et al., 2015a) and automotive (Martinelli et al., 2017).
ACKNOWLEDGEMENTS
This work was partially supported by the H2020 EU
funded project NeCS [GA #675320], by the H2020
EU funded project C3ISP [GA #700294].
REFERENCES
apktool (2018). A tool for reverse engineering android
apk files. hhttps://ibotpeaches.github.io/Apktool/. Ac-
cessed: 2018-11-21.
Binder, R. V. (1994). Design for testability in object-
oriented systems. Commun. ACM, 37(9):87–101.
Canfora, G., Martinelli, F., Mercaldo, F., Nardone, V.,
Santone, A., and Visaggio, C. A. (2018). Leila: formal
tool for identifying mobile malicious behaviour. IEEE
Transactions on Software Engineering.
Canfora, G., Mercaldo, F., Moriano, G., and Visaggio,
C. A. (2015a). Composition-malware: building an-
droid malware at run time. In 2015 10th International
Conference on Availability, Reliability and Security,
pages 318–326. IEEE.
Canfora, G., Mercaldo, F., and Visaggio, C. A. (2015b).
Evaluating op-code frequency histograms in malware
and third-party mobile applications. In International
Conference on E-Business and Telecommunications,
pages 201–222. Springer.
Canfora, G., Mercaldo, F., and Visaggio, C. A. (2015c).
Mobile malware detection using op-code frequency
histograms. In SECRYPT, pages 27–38.
Canfora, G., Mercaldo, F., Visaggio, C. A., and Di Notte, P.
(2014). Metamorphic malware detection using code
metrics. Information Security Journal: A Global Per-
spective, 23(3):57–67.
Caruana, R. and Niculescu-Mizil, A. (2006). An empir-
ical comparison of supervised learning algorithms. In
Proceedings of the 23rd international conference on
Machine learning, pages 161–168. ACM.
Ceccarelli, M., Cerulo, L., and Santone, A. (2014). De
novo reconstruction of gene regulatory networks from
time series data, an approach based on formal meth-
ods. Methods, 69(3):298–305.
Chidamber, S. R. and Kemerer, C. F. (1994). A metrics
suite for object oriented design. IEEE Trans. Software
Eng., 20(6):476–493.
Cimitile, A., Martinelli, F., and Mercaldo, F. (2017). Ma-
chine learning meets ios malware: Identifying mali-
cious applications on apple environment. In ICISSP,
pages 487–492.
Fenton, N. E. and Neil, M. (2000). Software metrics:
roadmap. In Proceedings of the Conference on the Fu-
ture of Software Engineering, pages 357–370. ACM.
Hecht, G. (2015). An approach to detect android anti-
patterns. In Proceedings of the 37th International
Conference on Software Engineering-Volume 2, pages
766–768. IEEE Press.
Hecht, G., Rouvoy, R., Moha, N., and Duchien, L. (2015).
Detecting antipatterns in android apps. In Proceedings
of the Second ACM International Conference on Mo-
bile Software Engineering and Systems, pages 148–
149. IEEE Press.
Jo
ˇ
st, G., Huber, J., and Heri
ˇ
cko, M. (2013). Using object
oriented software metrics for mobile application de-
velopment. In Second Workshop on Software Quality
Analysis, Monitoring, Improvement and Applications
(SQAMIA 2013), pages 17–27.
Kechagia, M. and Spinellis, D. (2014). Undocumented
and unchecked: exceptions that spell trouble. In 11th
Working Conference on Mining Software Repositor-
ies, MSR 2014, Proceedings, May 31 - June 1, 2014,
Hyderabad, India, pages 312–315.
Maiorca, D., Mercaldo, F., Giacinto, G., Visaggio, C. A.,
and Martinelli, F. (2017). R-packdroid: Api
package-based characterization and detection of mo-
bile ransomware. In Proceedings of the symposium on
applied computing, pages 1718–1723. ACM.
Martinelli, F., Mercaldo, F., Nardone, V., and Santone, A.
(2017). Car hacking identification through fuzzy logic
algorithms.
McCabe, T. J. (1976). A complexity measure. IEEE Trans.
Software Eng., 2(4):308–320.
Mercaldo, F., Di Sorbo, A., Visaggio, C. A., Cimitile, A.,
and Martinelli, F. (2018). An exploratory study on
the evolution of android malware quality. Journal of
Software: Evolution and Process, page e1978.
Mercaldo, F., Nardone, V., Santone, A., and Visaggio, C.
(2016). Hey malware, i can find you! pages 261–262.
Rastogi, S., Bhushan, K., and Gupta, B. (2016). An-
droid applications repackaging detection techniques
for smartphone devices. Procedia Computer Science,
78:26–32.
Romesburg, C. (2004). Cluster analysis for researchers.
Lulu. com.
Ruvo, G., Nardone, V., Santone, A., Ceccarelli, M., and
Cerulo, L. (2015). Infer gene regulatory networks
from time series data with probabilistic model check-
ing. pages 26–32.
Santone, A., Vaglini, G., and Villani, M. (2013). Incre-
mental construction of systems: An efficient charac-
terization of the lacking sub-system. Science of Com-
puter Programming, 78(9):1346–1367.
(SATC), S. A. T. C. (1995). Software quality metrics for
object oriented environments.
Scandariato, R. and Walden, J. (2012). Predicting vulner-
able classes in an android application. In Proceedings
of the 4th international workshop on Security meas-
urements and metrics, pages 11–16. ACM.
Sharkley, J. Coding for life - battery life, that is. ht-
tps://dl.google.com/io/2009/pres/W 0300 Codingfor
Life-BatteryLifeThatIs.pdf. Accessed: 2015-11-07.
statcounter (2018). Mobile operating system market
share worldwide. http://gs.statcounter.com/os-market-
share/mobile/worldwide. Accessed: 2018-10-25.
statista (2018). Number of available applications in the
google play store from december 2009 to september
2018. https://tinyurl.com/zewltg5. Accessed: 2018-
10-25.
Investigating Mobile Applications Quality in Official and Third-party Marketplaces
177

Taba, S. E. S., Keivanloo, I., Zou, Y., Ng, J., and Ng, T.
(2014). An exploratory study on the relation between
user interface complexity and the perceived quality. In
International Conference on Web Engineering, pages
370–379. Springer.
Tan, P.-N., Steinbach, M., and Kumar, V. (2013). Data min-
ing cluster analysis: basic concepts and algorithms.
Introduction to data mining.
Tian, Y., Nagappan, M., Lo, D., and Hassan, A. E. (2015).
What are the characteristics of high-rated apps? a case
study on free android applications. In Proceedings of
31st International Conference on Software Mainten-
ance and Evolution, page To Appear.
Yang, S., Yan, D., and Rountev, A. (2013). Testing for poor
responsiveness in android applications. In Engineer-
ing of Mobile-Enabled Systems (MOBS), 2013 1st In-
ternational Workshop on the, pages 1–6.
ENASE 2019 - 14th International Conference on Evaluation of Novel Approaches to Software Engineering
178
