
Collision Detection for a Mobile Robot using Logistic Regression
Felix Becker and Marc Ebner
Ernst Moritz Arndt Universit
¨
at Greifswald, Institut f
¨
ur Mathematik und Informatik,
Walther-Rathenau-Str. 47, 17487 Greifswald, Germany
Keywords:
Collision Detection, Autonomous Mobile Robots, Acceleration Sensor.
Abstract:
Collisions cannot be entirely avoided during normal operation of an autonomous mobile robot. Therefore,
mobile robots need to detect collisions and react appropriately when they happen. We investigate whether
logistic regression on acceleration data can be used for collision detection. We have collected training data
from an acceleration sensor during normal driving behavior of a small mobile robot. Collisions were manually
marked by a human operator. Accelerations occurring in a direction opposite to the current direction of motion
are more likely to be actual collisions. Hence, we combine accelerometer data and motor commands in the
logistic regression model. The trained model was able to detect 13 out of 14 collisions on a separate test set
with no false positives.
1 INTRODUCTION
A mobile robot can be equipped with a number of dif-
ferent sensors, e.g. infrared, sonar, laser range sensors
or a camera, which allow him to move around in ar-
bitrary environments (Corke, 2011; Jones and Flynn,
1993; McKerrow, 1991). Irrespective of the type of
sensor used, collisions may occur for a number of
different reasons: sensors may not fully cover the en-
tire environment of the robot, some obstacles may be
invisible to a sensor or sensor data processing may
be too slow such that the data is already outdated by
the time the collision occurs. It may also happen that
the robot collides with an obstacle and then becomes
stuck. If a robot becomes stuck, high stall currents
may be applied to the motors. These high currents
may cause damage to the robot if applied for long time
periods. Detection and handling of different types of
collisions is essential for a mobile robot in a real life
environment.
With this contribution we use logistic regression
(Hosmer Jr. et al., 2013) to predict collisions from
data measured by an accelerometer on a mobile robot.
Logistic regression and perceptron like neural net-
works are quite similar and both can be used for clas-
sification tasks. Dreiseitl and Ohno-Machado (2002)
have compared both methods in the context of med-
ical data classification. However, logistic regres-
sion can of course also be used for various tasks
in robotics. Dorigo and Schnepf (1993) have used
genetics-based machine learning for behavior-based
robotics. They trained a robot to follow a light point
and to avoid hot or dangerous objects.
Several researchers have used an accelerometer
for collision detection. Na et al. (2005) have used
acceleration sensor data for collision recognition for
small scale fish robots. They have used fuzzy logic
to estimate collision angles. He et al. (2007) apply
a median filter to a running window of consecutive
acceleration data and then compute the standard de-
viation. Finally a threshold is used to detect colli-
sions. Nadarajan and Sridharan (2010) used accel-
eration and gyroscope data to detect instability in a
NAO robot. They have used a support vector ma-
chine for classification. Moorits and Usk (2012) used
accelerometer data for collision detection in naviga-
tional marine buoys.
Vail and Veloso (2004) have used decision trees
for surface identification with a legged robot. McMa-
han et al. (2012) have shown that it is possible to use
accelerometer data for localization of contact points
on a robot arm. A multi class support vector machine
was used for classification. Wisanuvej et al. (2014)
use multiple accelerometers distributed along a multi-
jointed robot arm for localization of collisions. They
also propose to use this data for identification of ma-
terials the arm collided with and even for environment
mapping. Speleers and Ebner (2019) have evaluated
three different methods for collision detection using
an acceleration sensor on a mobile robot: a simple
threshold on the acceleration signal, a running median
filter and a frequency based averaging filter.
Becker, F. and Ebner, M.
Collision Detection for a Mobile Robot using Logistic Regression.
DOI: 10.5220/0007768601670173
In Proceedings of the 16th International Conference on Informatics in Control, Automation and Robotics (ICINCO 2019), pages 167-173
ISBN: 978-989-758-380-3
Copyright
c
2019 by SCITEPRESS – Science and Technology Publications, Lda. All rights reserved
167

Apart from mobile robotics, acceleration sensors
are also used in the car industry to deploy airbags
(Chan, 2000). Today, ordinary smartphones also con-
tain acceleration sensors. Hence, these phones can
also be used for vehicular collision detection (Lunds-
gaard and Grivas, 2006). Once a collision has been
detected, they can also be used to notify emergency
responders (Barfield, Jr. and Welch, 2016; Mane and
Rana, 2014; Thompson et al., 2010).
2 COLLISION DETECTION
A simple yet efficient method for collision detection
using acceleration data is to simply compare the ac-
celeration data provided by the sensor with a thresh-
old. If the acceleration is larger than a certain thresh-
old and does not occur in the direction the robot is
moving to then a collision has been detected. How-
ever, in practice it is quite difficult to use this method
if the acceleration data occurring due to normal move-
ment of the robot has a similar magnitude. This is
especially the case for small robots which may be de-
ployed in peoples homes. Also, small objects on the
ground may also cause peaks in the acceleration data.
However, if the objects are small enough for the robot
to drive over then we would like to ignore such small
“collisions”. If the robot is driving over rough ter-
rain, we may obtain an oscillating signal which may
make it difficult to extract obvious peaks for collision
detection.
Apart from collision detection we may also want
to classify the type of collision which occurred. A
collision against a table leg, human foot or a small
object on the ground will result in different accelera-
tion data. This data could be used to classify the type
of collision. However, a simple threshold will not be
sufficient for this kind of classification task. Learning
algorithms allow for automatic classification of col-
lision data. No manual tuning of parameters is re-
quired.
3 ROBOT ARCHITECTURE
For our experiments, we have used the Dagu Robot
(dagurobot.com) T’Rex Tank chassis (Fig. 1). The
tracked tank chassis is driven by two motors via a
Sabertooth 2x12 motor controller. The robot is pow-
ered by 11.1V LiPo battery. An Arduino Mega 256
micro controller was used to control the robot. The
robot was equipped with three Sharp analog infrared
sensors. One was oriented towards the front, the other
two at an angle of approximately 30
◦
pointing slightly
sideways. The two sideway sensors (GP2Y0A21)
could measure distances within the range 10 − 80
cm. The frontally oriented sensor (GP2Y0A60) could
measure distances within the range 10 − 150cm. A
2x20 LCD was used to display debug information. A
BNO055 sensor (Bosch Sensortec GmbH, 2006) was
used to provide 3-axis acceleration data. This sensor
was mounted approximately at the center of the robot.
The sharp infrared distance sensor provides ana-
log output. This output is read at a rate of approx-
imately 40Hz by the Arduino micro controller. The
two lateral sensors are used to implement a corridor
following behavior which allows the robot to wander
around. The frontally oriented sensor is used to detect
obstacles in the robot’s path. If the distance measured
by the frontally oriented sensor is less than 15cm, then
we stop the robot, drive backwards for 1000ms, turn
the robot by 180
◦
and then continue with normal driv-
ing behavior.
4 CENTERING BEHAVIOR
Normal driving behavior uses the data from the left
and right sensors to center the robot inside a corridor.
This behavior is similar to the way honeybees pro-
cess optical from their left and right eye (Lehrer et al.,
1988; Srinivasan, 1992a,b). Behavior-based control
algorithms have been shown to be very effective for
robot control (Arkin, 1998). Several researchers have
built robot behaviors based on this type of processing
using optical flow (Coombs et al., 1998; Coombs and
Roberts, 1992; Santos-Victor et al., 1993, 1995). If
the optical flow on the left hand side is larger com-
pared to the right hand side, then the robot will turn
to the right. If the optical flow on the right hand side
is larger compared to the left hand side, then the robot
will turn to the left.
Instead of working with laterally oriented cam-
eras it is also possible to process optical flow from
a monocular camera. Ebner and Zell (2000) have
used a foveated camera and extracted optical flow
from the left and right peripheral visual areas. Op-
tical flow was computed in ego motion complex log-
arithmic space. The ego motion complex logarithmic
mapping is taken around the focus of expansion in-
stead of the center if the image. Hence, optical flow
due to the angular velocity of the robot is compen-
sated for. Once this compensation is done, the optical
flow from the peripheral areas on the left and right
hand side is proportional to the inverse distance of the
viewed objects. Again, this distance information can
be used for a centering behavior as described above.
Here, we are not using optical flow for the center-
ICINCO 2019 - 16th International Conference on Informatics in Control, Automation and Robotics
168
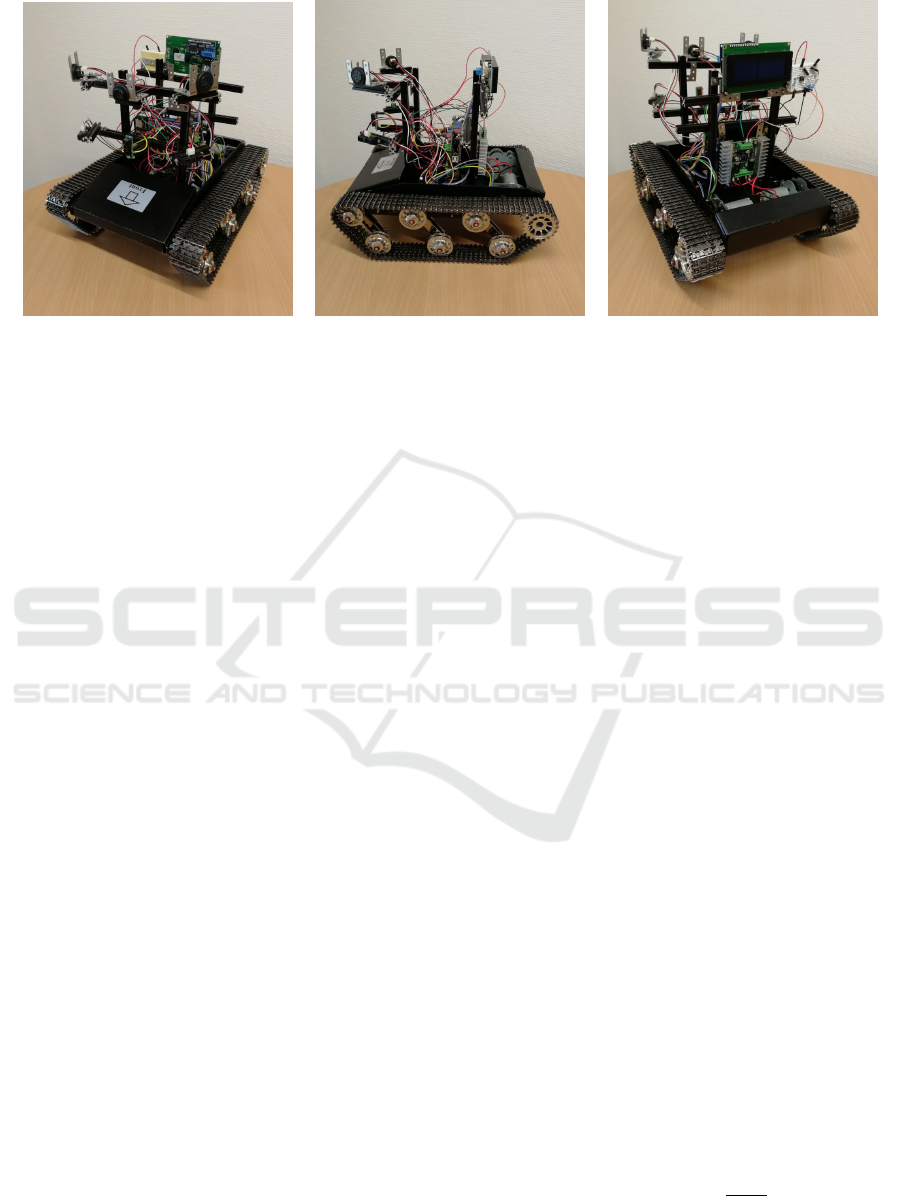
(a) (b) (c)
Figure 1: Dagu Robot T’Rex Tank chassis with Sabertooth 2x12 motor controller. The robot is equipped with three frontal IR
sensors. The three ultrasonic range sensors are not used. (a) front (b) side (c) rear.
ing behavior. Distances are readily available from the
Sharp distance sensors. Let s
l
and s
r
be the distance
measurement from the two sensors facing towards the
left and right side respectively. The difference be-
tween the two sensors is used to set the angular ve-
locity
˙
α of the robot.
˙
α = τ(s
l
− s
r
) (1)
where τ is a scaling parameter. For our experiments,
we have used τ = 0.05.
To drive our robot, we need to specify the power
applied to the left and right motors through the Saber-
tooth motor controller. Let m
l
be the power applied
to the left motor and let m
r
be the power applied to
the right motor via the motor controller. Let m
0
be
the power applied to both motors to achieve a desired
forward velocity. The desired rotational velocity is
simply added to the left motor value and subtracted
from the right motor value.
m
l
= m
0
+
˙
α (2)
m
r
= m
0
−
˙
α (3)
A positive angular velocity will make the robot turn
right while a small angular velocity will make the
robot turn left. This simple method will center the
robot inside a corridor. If an obstacle is sensed to-
wards the left side of the robot then the robot will turn
to the right side and vice versa.
5 LOGISTIC REGRESSION FOR
COLLISION DETECTION
We use logistic regression for collision detection. Lo-
gistic regression is a statistical model for dependent
binary variables (Dreiseitl and Ohno-Machado, 2002;
Hosmer Jr. et al., 2013). Our binary output variable
will take on the value 0 if no collision has occurred
and 1 if a collision has occurred. We would like to
estimate the probability that a collision has occurred
based on acceleration sensor data.
Let a
x
(t), a
y
(t) and a
z
(t) be the acceleration data
in cm/s measured by the accelerometer (the compo-
nent due to gravity is automatically removed by the
sensor). It is assumed that we have a
x
(t) = a
y
(t) =
a
z
(t) = 0 at rest. The sensor was mounted such that
the x axis points to the left and the y axis points back-
wards. Let m
l
(t) and m
r
(t) be the power applied to the
two motors. This data is obtained with a frequency of
approximately 125 Hz. Each data point p(t)
p(t) = (a
x
(t),a
y
(t),a
z
(t),m
l
(t),m
r
(t)) (4)
consists of the data measured by the accelerometer as
well as the power applied to the motors.
The deceleration due to a collision usually spans
multiple data points. Using more than a single data
point allows for more reliable collision detection. Let
W
i
be n consecutive data points obtained during time
t
i+n−1
−t
i
.
W
i
= (p(t
i
),..., p(t
i+n−1
)) (5)
Let o
i
be our binary output value with o = 1 if a col-
lision has occurred during the time period from t
i
to
t
i+n−1
. We want to estimate the probability P(o =
1|W). According to our logistic regression model, we
have
P(o = 1|W ) = σ(θ
0
+ θW) (6)
for a sigmoid function σ(x) =
1
1−e
−x
and parameters
θ and θ
0
. The vector W contains 5n values. Logistic
regression essentially tries to compute a hyperplane
Collision Detection for a Mobile Robot using Logistic Regression
169

to separate areas inside this vector space where a col-
lision has occurred from areas where a collision has
not occurred. We need to compute the weight vec-
tor θ and bias θ
0
from the available training data.
The software package R (The R Development Core
Team, 2008) was used to obtain the logistic regres-
sion model. We have used the function glm (general-
ized linear model) with default parameters except for
the parameter family which was set to binomial.
The training data is recorded via the serial Ar-
duino interface during normal operation of the robot.
The data points p(t
i
) are obtained at a rate of 125 Hz.
In order to apply logistic regression, we also need to
obtain ground truth data when a collision has hap-
pened. We have connected an external button to the
Arduino. This button is pressed by a human operator
whenever a collision has happened. Let c(t) = 1 if
the button was pressed and c(t) = 0 otherwise. The
button press occurs approximately at the time of the
collision. However due to various reasons (operator
pressing too early to after a slight delay), this data is
only approximately correct. Hence, we first correct all
collision data c(t) using an R-script and then compute
the time of the collision during post processing.
We take the button press as the approximate time
when a collision has happened. Some collisions may
have been marked before the actual event has hap-
pened and some have been marked after the event
has happened. Therefore, we search for a peak in the
magnitude of the acceleration data. If c(t) = 1, then
all data points within a window of b
s
time steps before
and b
s
time steps after time t are considered. If c(t) =
1 for several consecutive time steps, then we obtain a
window that will contain more than b
s
+ b
s
+ 1 data
values. Let t
m
be the time step where the magni-
tude of the acceleration was at a maximum. We then
set all values within [t − b
l
,t + b
r
] to 1. Let ˜c(t) be
this modified collision data. Preliminary experiments
have shown that the parameters b
s
= 6, b
l
= 6 and
b
r
= 12 work particularly well. The reason for assum-
ing that the collision is centered around the maximum
is because a collision frequently results in a quick im-
pulse followed by a slower decline.
Using all recorded data points p(t) and associated
ground truth collision data ˜c(t), we create overlapping
windows of size n = 19. Subsequent windows have an
offset of one data point. We compute the probability
P
0
that a collision has occurred during a window W as
the fraction of values ˜c = 1 to the total number of data
points, i.e.
P
0
i
=
n
∑
j=0
˜c
!
/n (7)
Using n = 19 we obtain P
0
i
= 1 if a collision event
is completely contained within this window. The re-
gression model has been trained using these windows
with associated P
0
i
. All data was recorded while the
robot was driving around in an office environment.
Using the trained regression model, we are able to
detect collisions by processing a window of 19 con-
secutive data points. The model will compute a proba-
bility that a collision has occurred. We apply a thresh-
old of 0.95 to this probability, i.e. a collision only oc-
curs if the output of the mode is 0.95 or larger. If a
collision has been detected, we locate the data point
t
m
whose magnitude of the acceleration is at a max-
imum. We then compute the motor power by taking
the maximum acceleration during the collision. Let
a
max
be this maximum. Values larger than 8 are lim-
ited to 8. This limits the rotational velocity of the
robot. The motor power is set to
m
l
= −m
0
− sa
max
(8)
m
r
= −m
0
+ sa
max
(9)
using m
0
= 50 and s = 8. The parameters were manu-
ally set based on preliminary experiments. The setting
is maintained for a time of 1000 ms. This will result
in a motion that is opposite to the one that lead to
the collision. For example, if the robot bumped into
a chair leg with his front left corner then it will set
back by turning to the left. This will allow the robot
to avoid the chair leg when moving forward again.
6 EXPERIMENTS
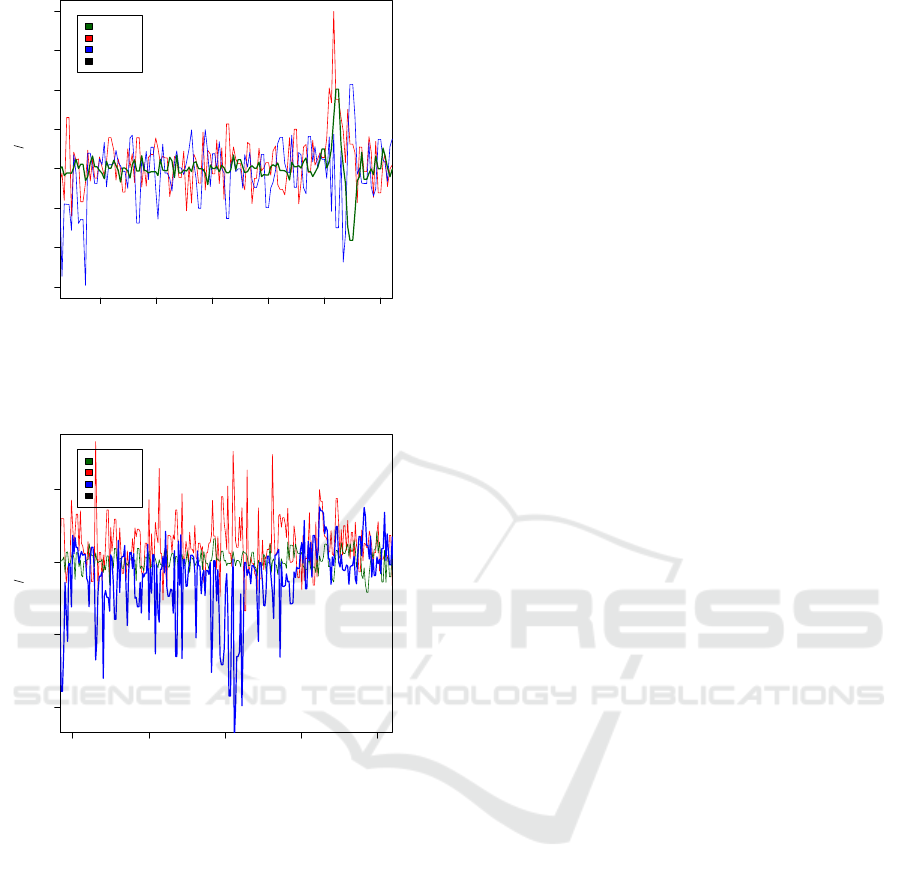
Acceleration data obtained during a collision with a
chair leg is shown in Fig. 2. The collision is clearly
marked by the peak in the data along the y axis. Apart
from this peak along the y axis, we also see consider-
able accelerations occurring along the x and z axis of
the robot. This is due to the robot moving sideways
and downwards (the tracks are spring mounted to the
robot). Due to this type of behavior it is best to con-
sider all three axes when determining whether or not
a collision has occurred.
Fig. 3 shows the collision data while the robot
was moving upward on a ramp. The robot was collid-
ing with a chair leg. Peak acceleration also occurred
along the z direction. However, the peak is not as
high in the previous data. When the robot reaches
the bottom of the ramp, we also obtain large oscilla-
tions along the y direction. However, these data points
should not be interpreted as a collision.
It is quite difficult to devise an algorithm which
will detect both types of collisions that we have an-
alyzed here (colliding with a chair leg on the ground
and colliding with a chair leg on a ramp). Apart from
ICINCO 2019 - 16th International Conference on Informatics in Control, Automation and Robotics
170
2800 3000 3200 3400 3600 3800
−6 −4 −2 0 2 4 6 8
ms
cm s
2
●●●●●●●●●●●●●●●●●●
a
x
a
y
a
z
Collision
Figure 2: Acceleration data a
x
, a
y
and a
z
obtained from the
robot while bumping into a chair leg. The time of collision
was marked manually by a human operator.
16000 16500 17000 17500 18000
−10 −5 0 5
ms
cm s
2
●●●●●●●●●●●●●
a
x
a
y
a
z
Collision
Figure 3: Acceleration data a
x
, a
y
and a
z
obtained from
the robot while it was moving upward on a ramp and then
bumping into a chair leg. The time of collision was marked
manually by a human operator.
these two types that we have seen so far, many differ-
ent collision types can occur in practice. A learning
algorithm has the advantage that we only need to col-
lect collision data for various situations as well as data
from normal driving behavior when no collisions oc-
cur. The learning algorithm will then optimally tune
its parameters to the given data.
Logistic regression allows us to detect collisions
by learning from a training data set. Our training data
set contains 27 collisions where the robot was level
and colliding with a chair leg (collision of type A). It
also contained 14 collisions where the robot was mov-
ing upward on a ramp and colliding with a chair leg
(collision of type B). The remaining training data was
recorded during normal driving behavior of the robot
on the ground. Sometimes the robot was also driving
over small objects. These objects provide for varia-
tions in the collision data. However, they should not
be considered as collisions. The small objects on the
ground should result in variations during normal driv-
ing behavior in order to make the collision detection
algorithm more robust. Our training set consisted of a
total number of 22105 data points (21014 for normal
driving behavior, 859 for type A collisions 232 for
type B collisions) with associated binary data (colli-
sion/no collision). Since each window contained 19
data points and we have used overlapping windows,
we obtained 20996 windows from normal driving be-
havior, 841 windows from type A collisions and 214
windows from type B collisions.
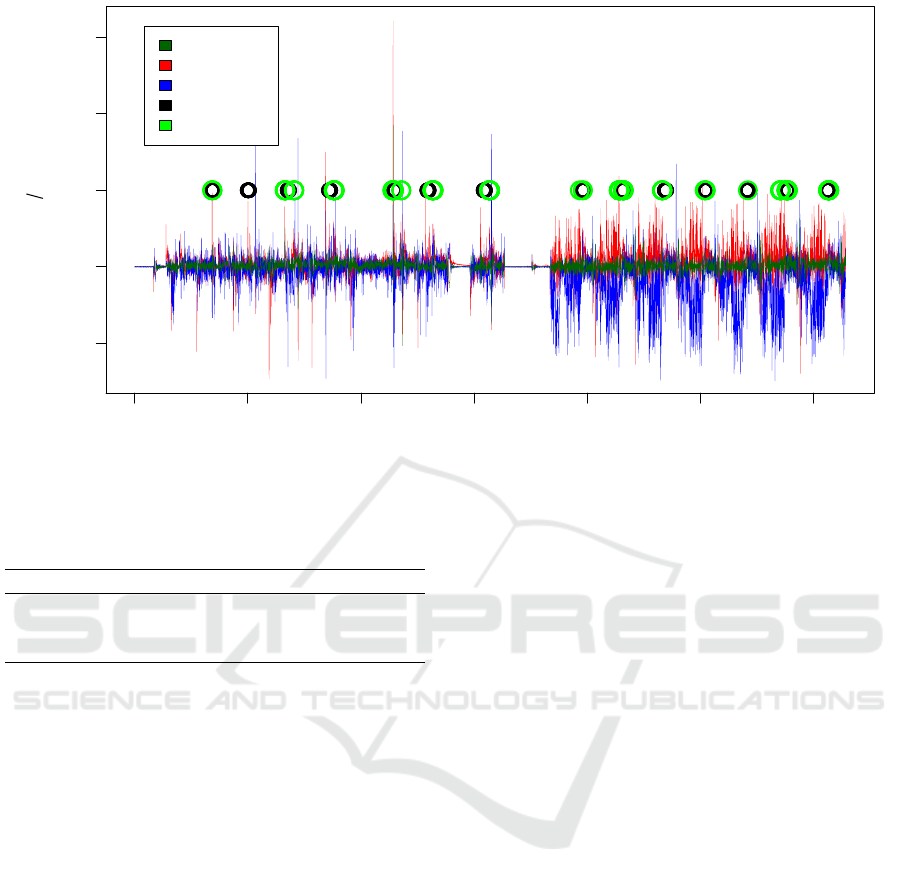
We then tested the robots ability to detect colli-
sions on a test data set shown in Fig. 4. This data set
consists of 14 collisions. It was recorded while the
robot was moving around on the floor. It collided with
a table chair (7 times, type A collision). The robot was
also moving upward on a ramp and then collided with
a table chair (7 times, type B collision). Only one of
these 14 collisions was not correctly classified as a
collision. Table 5 summarizes our results. Our model
did not recognize one collision of type A. This may
have been the case because the robot collided with
the chair leg at an angle that was not sufficiently well
represented by the available training data. Collision
detection results are also shown in Fig. 4. Actual col-
lisions have been marked manually by a black circle.
Whenever our model predicted a collision, a green cir-
cle is shown in the plot.
In order to further improve collision detection, it
would of course also be possible to learn collision de-
tection models separately for different types of colli-
sions. Once these separate models have been learned,
they could be combined in a final processing stage.
However, this approach could result in over-training
of certain collision types. Collisions that do not occur
during training will probably not be detected.
7 CONCLUSION
We have used logistic regression for collision detec-
tion of a mobile robot. The robot was equipped with
an accelerometer. Our model was based on 19 suc-
cessive data points obtained at a rate of approx. 125
Hz. Each data point consisted of the acceleration val-
ues along the three axes of the robot together with
the power supplied to the robot’s motors. A training
data set was obtained by letting the robot drive around
inside an office environment and then marking colli-
sions manually. Out of 14 collisions in the test set
Collision Detection for a Mobile Robot using Logistic Regression
171
0 10000 20000 30000 40000 50000 60000
−10 0 10 20 30
ms
cm s
2
Beschl. X
Beschl. Y
Beschl. Z
Kollision
Vorhersage
Figure 4: Test data set with 14 collisions. Acceleration data a
x
, a
y
and a
z
together with manually marked collisions (black
circles). Predicted collisions have been marked by a green circle. Only one of the collisions has not been detected by the
model.
type A type B
collisions (training set) 27 14
collisions (test set) 7 7
recognized collisions (test set) 6 7
Figure 5: Collision data was gathered during normal driv-
ing behavior. Two types of collisions were recorded: Type
A collisions (table chair) and type B collisions (table chair
while robot was moving on a ramp).
13 were detected. Thus, logistic regression appears to
be a promising method for collision detection using
an acceleration sensor on a mobile robot. The advan-
tage of using logistic regression compared to a simple
threshold on the acceleration data is that the method
can be easily tuned to detect certain types of collision
by simply recording training data. Currently, training
has to take place off-line. Extending the method to an
on-line learning paradigm would be desirable.
REFERENCES
Arkin, R. C. (1998). Behavior-Based Robotics. The MIT
Press, Cambridge, Massachusetts.
Barfield, Jr., J. R. and Welch, S. C. (2016). Automatic ve-
hicle crash detection using onboard devices. United
States Patent US 9,392,431 B2.
Bosch Sensortec GmbH (2006). BNO055 intelligent 9-axis
absolute orientation sensor. BST-BNO055-DS000-
14.
Chan, C.-Y. (2000). Fundamentals of crash sensing in au-
tomotive air bag systems. Society of Automotive En-
gineers, Inc., Warrendale, PA.
Coombs, D., Herman, M., Hong, T.-H., and Nashman, M.
(1998). Real-time obstacle avoidance using central
flow divergence, and peripheral flow. IEEE Transac-
tions on Robotics and Automation, 14(1):49–59.
Coombs, D. and Roberts, K. (1992). “bee-bot”: using pe-
ripheral optical flow to avoid obstacles. In Casasent,
D., editor, Intelligent Robots and Computer Vision XI,
Proceedings of the Society of Photo-Optical Instru-
mentation Engineers, pages 714–721.
Corke, P. (2011). Robotics, Vision and Control. Springer,
Berlin.
Dorigo, M. and Schnepf, U. (1993). Genetics-based ma-
chine learning and behavior-based robotics: A new
synthesis. IEEE Transactions on Systems, Man, and
Cybernetics, 23(1):141–154.
Dreiseitl, S. and Ohno-Machado, L. (2002). Logistic regres-
sion and artificial neural network classification mod-
els: a methodology review. Journal of Biomedical
Bioinformatics, 35:352–359.
Ebner, M. and Zell, A. (2000). Centering behavior with
a mobile robot using monocular foveated vision.
Robotics and Autonomous Systems, 32(4):207–218.
He, F., Du, Z., Sun, L., and Lin, R. (2007). Collision sig-
nal processing and response in an autonomous mobile
robot. Neural, Parallel and Scientific Computations,
15:319–334.
Hosmer Jr., D. W., Lemeshow, S., and Sturdivant, R. X.
(2013). Applied Logistic Regression. John Wiley &
Sons., Inc., Hoboken, NJ, third edition.
Jones, J. L. and Flynn, A. M. (1993). Mobile Robots - In-
ICINCO 2019 - 16th International Conference on Informatics in Control, Automation and Robotics
172

spiration to Implementation. A K Peters, Wellesley,
Massachusetts.
Lehrer, M., Srinivasan, M. V., Zhang, S. W., and Horridge,
G. A. (1988). Motion cues provide the bee’s visual
world with a third dimension. Nature, 332(24):356–
357.
Lundsgaard, S. K. and Grivas, N. J. (2006). Method and
apparatus for detecting vehicular collisions. United
States Patent US 7,119,669 B2.
Mane, A. and Rana, J. (2014). Vehicle collision recognition
and monitoring system based on AVR platform. Inter-
national Journal of Engineering Research and Gen-
eral Science, 2(6):540–545.
McKerrow, P. J. (1991). Introduction to Robotics. Addison-
Wesley Publishing Company, Sydney.
McMahan, W., Romano, J. M., and Kuchenbecker, K. J.
(2012). Using accelerometers to localize tactile con-
tact events on a robot arm. In Proceedings of the
Workshop on Advances in Tactile Sensing and Touch-
Based Human-Robot Interaction, ACM/IEEE Inter-
national Conference on Human-Robot Interaction,
Boston, MA. IEEE.
Moorits, E. and Usk, A. (2012). Buoy collision detection.
In Bo
ˇ
zek, J. and Grgi
´
c, M., editors, Proceedings EL-
MAR, 54th international Symposium, Zadar, Croatia.
IEEE.
Na, S. Y., Shin, D., Kim, J. Y., and Choi, S.-I. (2005). Col-
lision recognition and direction changes using fuzzy
logic for small scale fish robots by acceleration sensor
data. In International Conference on Fuzzy Systems
and Knowledge Discovery, pages 329–338, Berlin.
Springer-Verlag.
Nadarajan, K. and Sridharan, M. (2010). Online detection
of instability for robust teamwork in humanoid soccer
robots. In Proceedings of the 5th Workshop on Hu-
manoid Soccer Robots, Nashville,TN.
Santos-Victor, J., Sandini, G., Curotto, F., and Garibaldi, S.
(1993). Divergent stereo for robot navigation: Learn-
ing from bees. In Proceedings of Computer Vision and
Pattern Recognition, New York, pages 434–439.
Santos-Victor, J., Sandini, G., Curotto, F., and Garibaldi, S.
(1995). Divergent stereo in autonomous navigation:
From bees to robots. International Journal of Com-
puter Vision, 14:159–177.
Speleers, P. and Ebner, M. (2019). Acceleration based colli-
sion detection with a mobile robot. In McDermoot, J.,
Castelli, M., Sekanina, L., Haasdijk, E., and Garc
´
ıa-
S
´
anchez, P., editors, 3rd IEEE International Confer-
ence on Robotic Computing, IRC 2019, Nalpes, Italy,
February, pages 437–438, Los Alamitos, CA. IEEE.
Srinivasan, M. V. (1992a). Distance perception in insects.
Current Directions in Psychological Science, 1(1):22–
26.
Srinivasan, M. V. (1992b). How bees exploit optic flow: be-
havioural experiments and neural models. Phil. Trans.
R. Soc. Lond. B, 337:253–259.
The R Development Core Team (2008). R: A language and
environment for statistical computing. R Foundation
for Statistical Computing.
Thompson, C., White, J., Dougherty, B., Albright, A., and
Schmidt, D. C. (2010). Using smartphones and wire-
less mobile sensor networks to detect car accidents
and provide situational awareness to emergency re-
sponders. In Proceedings of the Third International
ICST Conference on MOBILe WirelessMiddleWARE,
Operating Systems, and Applications, Chicago, IL,
pages 29–42, Berlin. Springer.
Vail, D. and Veloso, M. (2004). Learning from accelerom-
eter data on a legged robot. IFAC Proceedings,
37(8):822–827.
Wisanuvej, P., Liu, J., Chen, C.-M., and Yang, G.-Z. (2014).
Blind collision detection and obstacle characterisation
using a compliant robotic arm. In IEEE International
Conference on Robotics and Automation, pages 2249–
2254.
Collision Detection for a Mobile Robot using Logistic Regression
173
