
Stereoscopic Interactive Objects: Acquisition, Generation and
Evaluation
Fl
´
avio de Almeida e Silva
1
, Diogo Roberto Olsen
1
, Lucas Murbach Pierin
1
, Fl
´
avio Bortolozzi
2
and Edson Jos
´
e Rodrigues Justino
1
1
Programa de P
´
os-graduac¸
˜
ao em Inform
´
atica - PPGIa, Pontif
´
ıcia Universidade Cat
´
olica do Paran
´
a - PUCPR,
Curitiba, Paran
´
a, Brazil
2
Centro Universit
´
ario Cesumar - Unicesumar, Maring
´
a, Paran
´
a, Brazil
Keywords: Learning Objects, Stereoscopy, Interactive Environments, Multidisciplinarity, Visualization.
Abstract:
Three-dimensional objects suffer from inaccuracies in the format of computational representation and artistic
drawing, losing visual acuity. On the other hand, photographs offer visual acuity, but they are not interactive,
that is, they do not offer the possibility of changing the perspective of visualization as a three-dimensional
model does. Thus, we have created a device capable of scanning a real object, allowing for the production of
interactive contents and visual acuity. In addition, the model created allows stereoscopic visualization, that is,
with a notion of depth. We produced a learning object from the scans of a real object, assessed by teachers and
students who work at medium, technical, and higher school levels. The interactive stereoscopic learning object
with visual acuity seems promising for the responses to a questionnaire and interviews showed it motivated
teachers and students due to its more realistic visualization and rich details. By allowing the visualization of
the piece from several angles, it can foster and satisfy curiosities.
1 INTRODUCTION
The study of artworks, anatomical pieces or botani-
cal items is just an example of visual analyses of real
objects common in scientific research, education, or
in the production system, among others. These visual
inspections are a means for solving issues such as mu-
seum restoration or quality control in the production
chain, among other applications.
However, it is not always possible, or even inter-
esting, for the observer to be in direct contact with the
item he studies. For example, a middle-level student
does not need to enter into a human anatomy labora-
tory, where there are chemical agents that make this
environment unhealthy, to study anatomy.
On the other hand, imprecise, inaccurate or static
models may not faithfully represent the objects to
be studied and hamper the teaching-learning process.
Research has been done to obtain visual anatomical
models that offer high visual acuity, such as the Vis-
ible Human Project (Ackerman, 1998), in which two
human bodies were sectioned with intervals of 1mm
and 0.33mm and these sections were photographed to
generate image bases of the whole human body.
In his paper, Ackerman describes that there are
two forms of image representation: those based on
photos and three-dimensional models (3D). Three-
dimensional models suffer from imprecision of both
artistic design and graphical representation, which are
based on geomorphic forms and mathematical for-
mulas to represent volumes and structures. These,
however, do not faithfully represent biological forms,
which are irregular in nature.
As for the content in photographs, Ackerman ar-
gues that a set of two-dimensional static images are
limited because they do not offer the possibility of
changing the view perspective of the photograph as
does manipulation of the real object.
According to the author, the understanding of
tridimensional structures is essential in many areas,
but the learning of them is a challenge. Photographs
are two-dimensional in nature and force the viewer to
a mental exercise of constructing a 3D visualization,
which can lead to inaccuracies in the understanding
of structures.
Besides anatomy, the same difficulties in under-
standing three-dimensional structures occur in other
areas of education, such as the study of artworks,
botany, design, among others. In order to overcome
these problems, a device that can scan real objects
Silva, F., Olsen, D., Pierin, L., Bortolozzi, F. and Justino, E.
Stereoscopic Interactive Objects: Acquisition, Generation and Evaluation.
DOI: 10.5220/0007796001650176
In Proceedings of the 11th International Conference on Computer Supported Education (CSEDU 2019), pages 165-176
ISBN: 978-989-758-367-4
Copyright
c
2019 by SCITEPRESS – Science and Technology Publications, Lda. All rights reserved
165
for the generation of Learning Objects (LO) was de-
veloped. The generated LOs can be visualized on
different devices, such as screens, projectors, and
augmented reality, and include the notion of three-
dimensionality, depth, and volume, preserving visual
acuity, displaying details that are not visible to the
naked eye.
The educational contents produced in this research
have interactivity and stereoscopy (depth perception).
To these contents will be added data such as informa-
tion, definitions and characteristics present in the real
objects, which were scanned. It is believed that the
minipulation of an interactive and stereoscopic con-
tent can attract the interest of the students, contribut-
ing to the learning.
This paper introduces a solution for the digitiza-
tion of real objects that allows an interactive, stereo-
scopic visualization and preserves visual acuity (Sec-
tion 2). Section 3 addresses LOs and how the device
can be used for this purpose. Section 4 presents the
assessment of an LO generated from such digitiza-
tion. Section 5 contains our final remarks.
2 FULL FRAMES
SEMI-SPHERICAL SCANNER
Considering Ackerman’s notes on the need for inter-
active digital models with fidelity to real objects, we
worked out a method of digitization based on a set
of photographs with visual acuity, which enables the
generation of interactive and stereoscopic models. We
define visual acuity here as the possibility to visualize
in the digital model the same details found in the real
object, that is, preserving its color, shape, and tex-
tures.
Visual acuity is achieved through the appropriate
use of photographic techniques, correction of intrinsic
problems in the digital photography process, enhance-
ment of the acquired images (Krasula et al., 2017),
and the use of quality metrics for these images (Cheng
et al., 2017). Fidelity is also guaranteed for the acqui-
sition of the colors of the real object (Yu et al., 2016).
Moreover, according to Ackerman, for the under-
standing of three-dimensional structures, it is desir-
able that one can interact with the model. In this pa-
per, interaction is defined as the possibility of observ-
ing the digital model from different angles, manipu-
lating and rotating it as if the object were in hands.
However, we used two-dimensional photographs;
in order to allow for a spatial and volume-based un-
derstanding of the scanned object, we used stereo-
scopic techniques to create depth perception in the vi-
sualization. On the other hand, the work of (Weber
et al., 2016) presents equipment for the acquisition of
photos with a camera, an arm and a turntable, where
the camera can be attached at different points in the
arm, which have vertical movement.
This process is completely manual and generates
problems in the acquisition for the generation of stere-
oscopy. In the works of (Solav, 2018) (Zhang et al.,
2017) (Xu et al., 2017) multiple fixed cameras are
used for the acquisition, which may entail the need
for adjustments in the images, with the application of
geometric transformations due to distortions.
In order to enable the scanning of real objects in
accordance with the mentioned characteristics, we de-
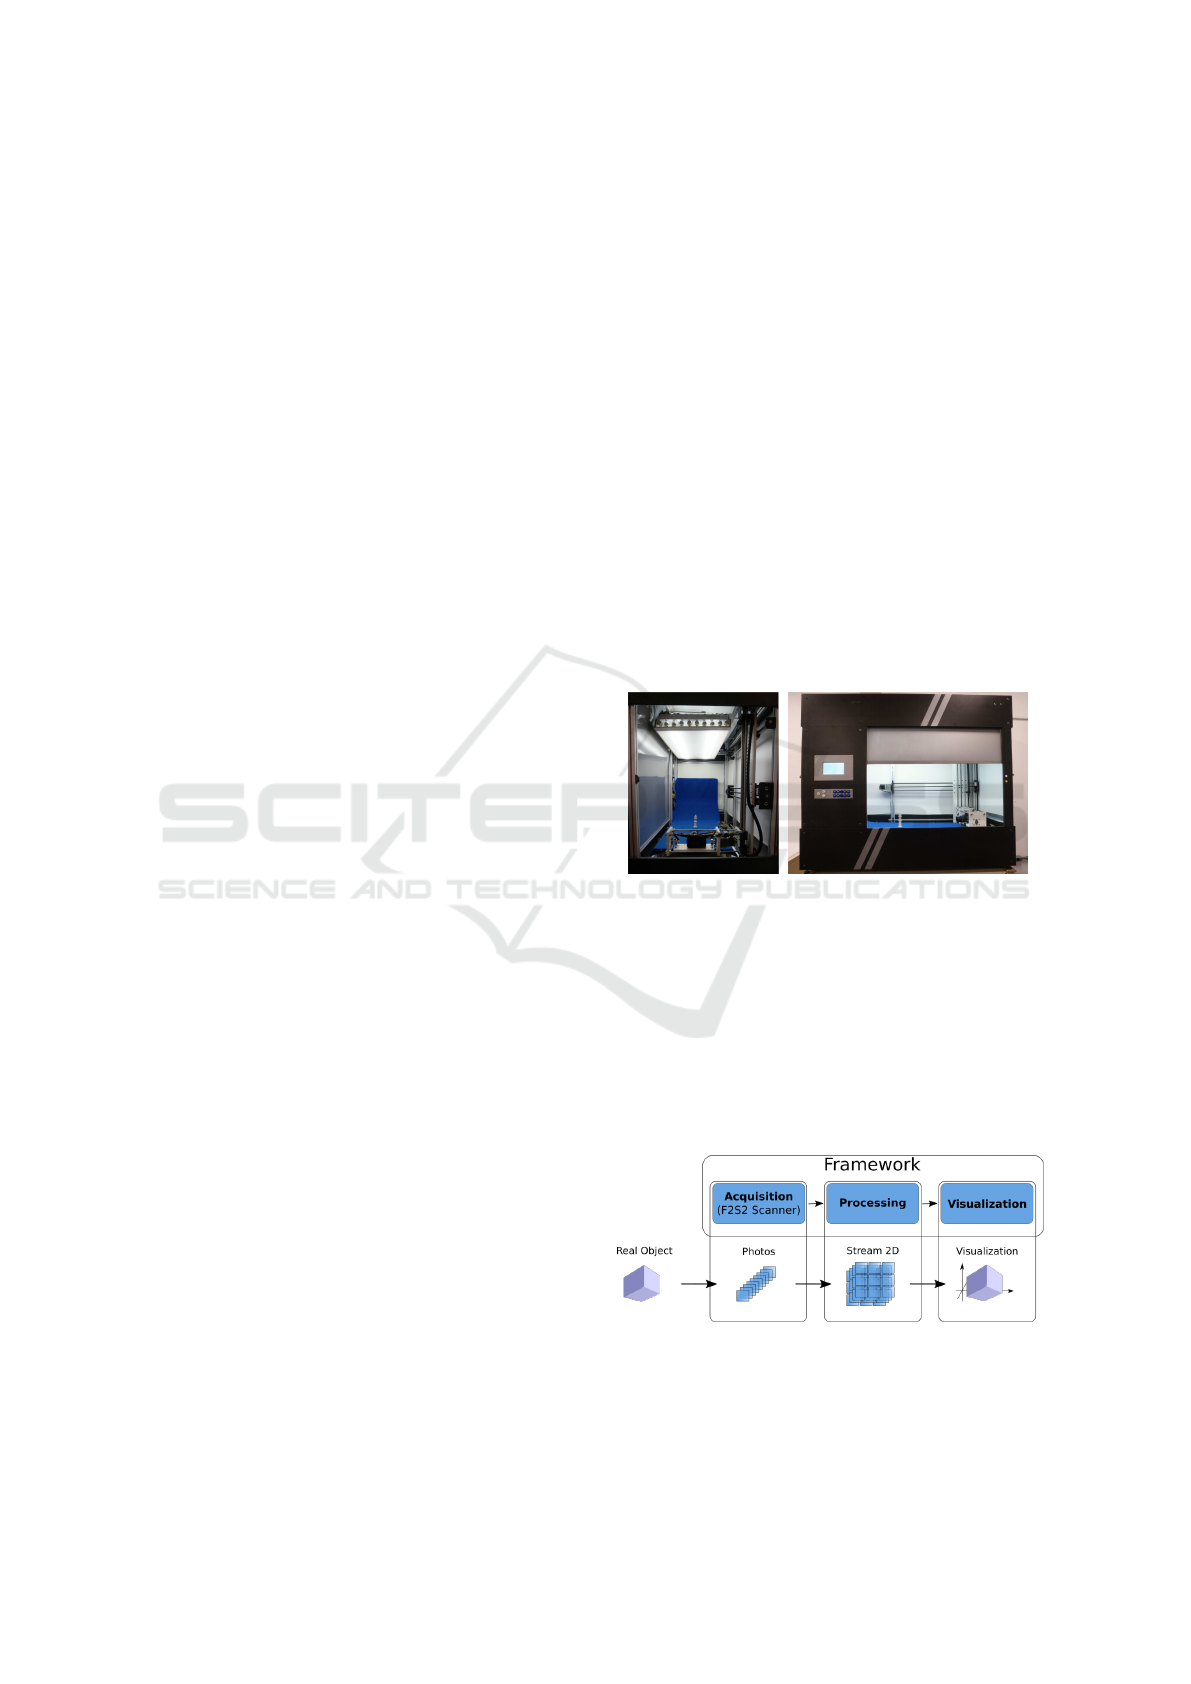
veloped a Full Frame Semi-spherical Scanner - F2S2.
The term “semi-spherical scanner” refers to the fact
that the F2S2 takes pictures while moving the cam-
era such that it forms a semi-sphere around the ob-
ject, covering all the angles according to a predefined
range. The term “Full Frames” refers to the photo-
graphic acquisition of all angles of the object. Figures
1(a) and 1(b) show F2S2.
(a) (b)
Figure 1: Full Frame Semi-spherical Scanner: (a) internal
view; (b) side view.
Until the visualization process is reached, three
steps are taken: initially, the photographs of all the
angles of the object being scanned are acquired; these
photos are then corrected, processed and organized
into a file called Stream2D; finally, Stream2D is used
to generate the visualization. Figure 2 shows the com-
plete process.
Figure 2: F2S2 framework.
CSEDU 2019 - 11th International Conference on Computer Supported Education
166
Acquisition
The acquisition process occurs by photographing
all the angles of the object in ultra-high definition
(UHD), 4k (3840 × 2160 pixels) or 8k (7680 × 4320
pixels) pictures. Scanning takes a predefined angu-
lar range and a minimum scanning accuracy of 0.9
◦
into account. In order for the camera to acquire the
photographs, it is moved by a mechanical bracket that
has two axes (Axes: H – responsible for the horizon-
tal movement of the camera, and V - vertical move-
ment). The H and V axes move the camera along an
arc-shaped path with a predefined radius and with the
object positioned in the center of the arc. Picture 3(a)
shows the motion and the axes.
The C axis tilts the camera so that it maintains the
focal point in the center of the sphere, that is, on the
object. In addition to the movement of the camera,
the object is positioned on a turntable that revolves
around its own axis (Axis B), so that it is possible to
obtain images from all sides of the object for each an-
gular position of the camera. The arc motion (angular
variation ϕ) and the object’s rotation (angular varia-
tion Θ) cause the camera to move in a semi-sphere
around the object, as observed in Figure 3(b). The
acquisition process can be seen in videos
1
.
(a) (b)
Figure 3: Acquisition process.
Processing
After the acquisition, the images are adjusted auto-
matically, starting with the correction - by software
- of imperfections intrinsic to the process of digital
photography, such as deformations caused to the im-
age by the optical set of the camera, removal of chro-
matic aberrations and the vignette. The colors of the
pictures are corrected to match the actual colors of
the object. These problems occur in all photographs,
digital or analogical, and are not usually perceived in
photographs of common use. For scientific and edu-
cational applications, however, aiming for greater fi-
delity to the real object, these characteristics should
be corrected.
1
Acquisition: https://www.youtube.com/channel/
UCXEFzyZGrGlLANNrCawNgWQ anonymous link
Then, the context is reduced and the background
removed. These steps remove parts of the scanned
image, such as the infinite background where the ob-
ject is positioned, so that the resulting image is the
scanned object only. Figure 4 shows the acquired im-
age (Figure 4(a)) and the final image (Figure 4(b)).
(a) (b)
Figure 4: Image processing: (a) image as scanned by F2S2;
(b) final image.
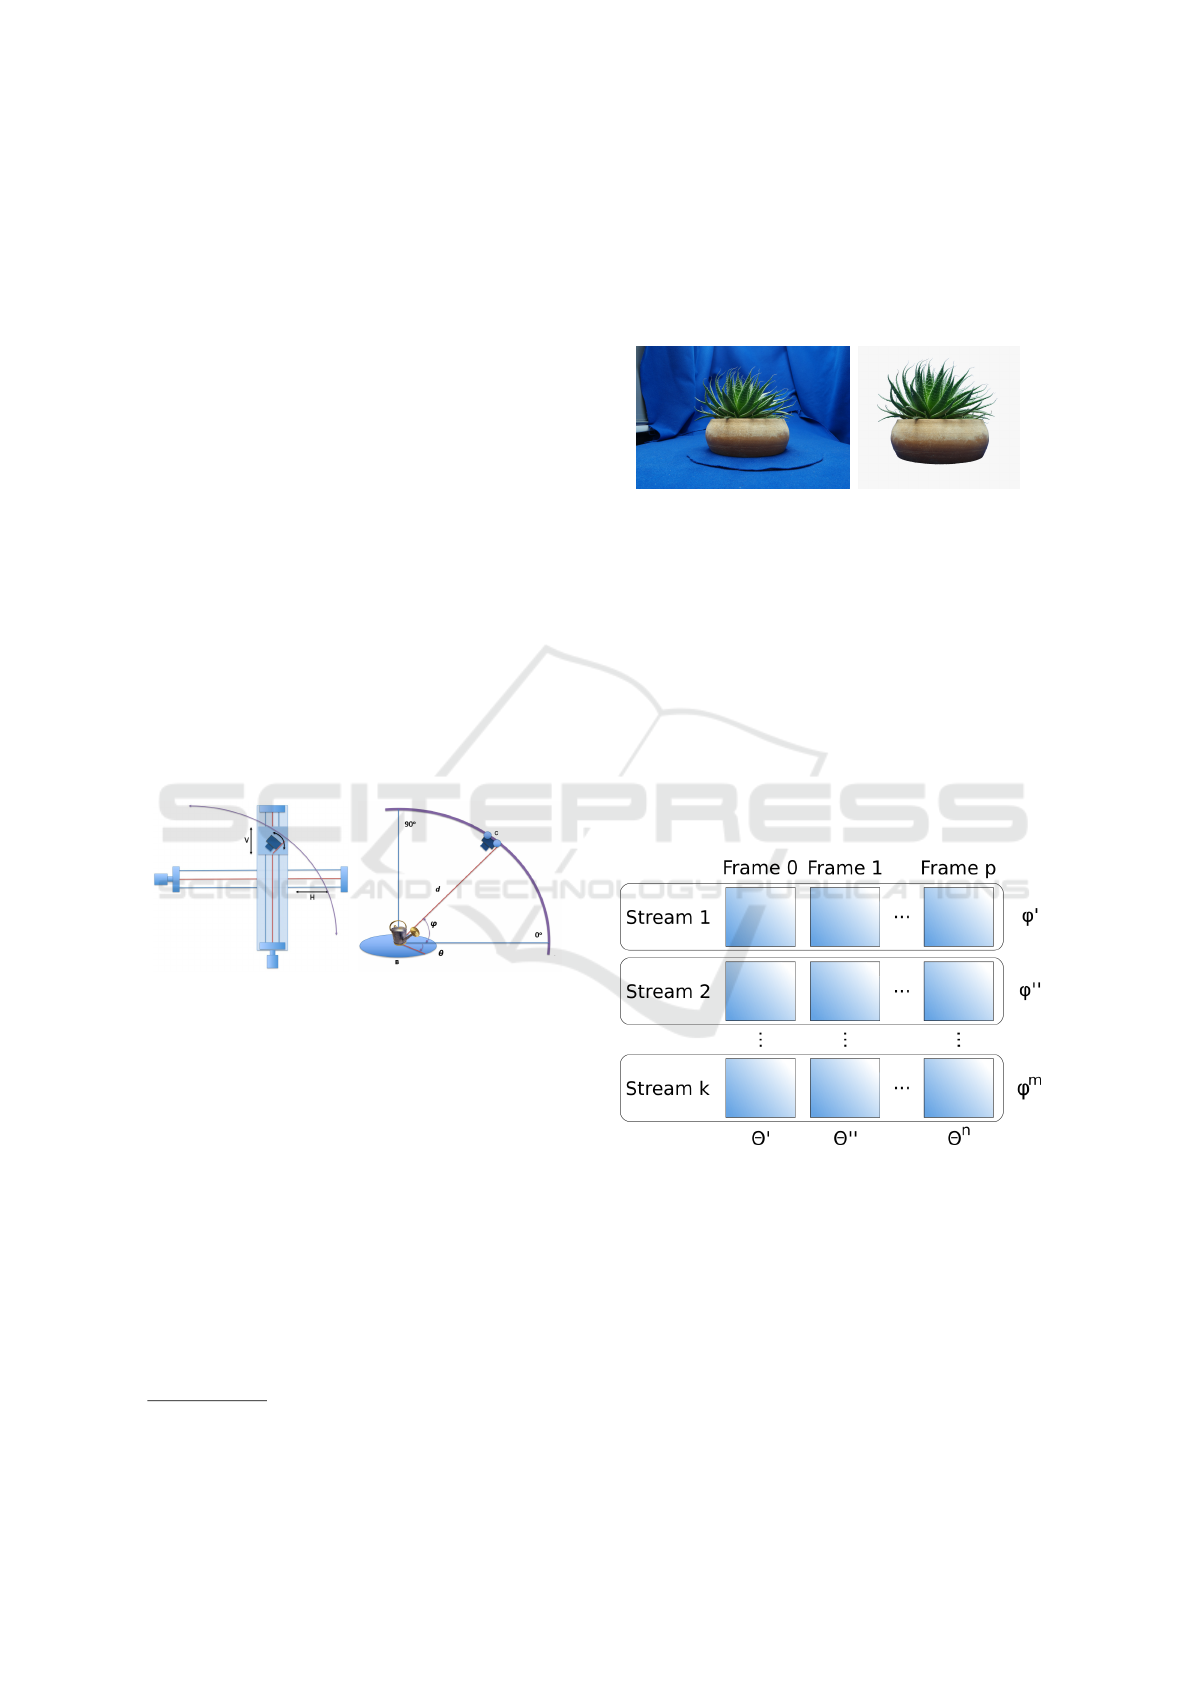
Finally, the Stream2D is created, in which the pro-
cessed images are organized so that for each image of
the set it is possible to know the position of the camera
during the scanning. The organization of Stream2D
is based on a matrix with two structures: Streams and
Frames. A Stream is a set of images for a given po-
sition of the camera, i.e., a set of photos with angular
variation Θ but without angular variation ϕ. A Frame
is a photograph from a certain point of view of the
object. Each Frame has a unique angular variation ϕ
and Θ.
Figure 5: Stream2D.
Considering a maximum scan accuracy of 0.9
◦
,
the number of Frames in a Stream is defined by
0 < Frame ≤ 400, 400 being the multiplication of
the angular variation Θ by the scanning precision
(360
◦
÷ 0.9
◦
).
The number of Streams in a Stream2D is defined
by 0 < Stream ≤ 100, 100 being the multiplication
of the angular variation ϕ, which is 90
◦
, by the scan
precision (90
◦
÷ 0.9
◦
). Hence, the number of Frames
in a Stream2D is 0 < Frame ≤ 40, 000(400Frames ×
100Streams).
Stereoscopic Interactive Objects: Acquisition, Generation and Evaluation
167

Visualization
Stream2D visualization takes place in graphics com-
puting environments using, among others, three-
dimensional Cartesian coordinate systems (X, Y, and
Z axes). In Cartesian coordinate systems, a point P is
defined by a set of three values: P = (X,Y, Z), where
the values of each axis indicate the displacement on
the axis. Figure 6 shows this coordinate system.
Figure 6: Cartesian coordinate system.
Since F2S2 performs the acquisition process in a
semi-spherical format, the position of a given photo
can be defined using a spherical coordinate system.
This coordinate system is also based on three dimen-
sions to define a position in space: P = (r, Θ, ϕ) (Fig-
ure 7), where:
r: distance from point P to the origin of the sys-
tem;
Θ: angular variation between the projection of
point P in the plane formed by the axes XY;
ϕ: angle formed by the line connecting P to the
origin and the Z axis.
F2S2, in turn, has a four-axis system (H, V , C and
B) for scanning objects (see Figure 8), where:
H: displacement of the camera on the horizontal
axis;
V : displacement of the camera on the vertical axis;
C: inclination of the camera in relation to the hor-
izontal axis;
B: rotation of the object on its own axis.
In the F2S2 coordinate system, the position of a
point (Frame) is given by F = (H,V, B).
The value of the C-axis does not have to be in-
formed to define the position of a Frame F, since, for
a certain position of H and V , there is only one in-
clination C that links F to the origin of the system.
C = arctangent(H,V ) calculates the value of C.
Figure 7: Spherical coordinate system.
Figure 8: The F2S2 coordinate system.
Since there are three coordinate systems involved
in the process of digitizing objects until their exhibi-
tion, one should establish a conversion system from
one to the other.
Considering the spherical coordinate system,
which represents the position of a Frame in relation to
the Object, this system can be converted to the Carte-
sian and F2S2 systems by Equations 1 and 2, respec-
tively.
X = r × sine(Θ) × cosine(ϕ)
Y = r × sine(Θ) × sine(ϕ)
Z = r × cosine(Θ)
(1)
H = r × cosine(Θ)
V = r × sine(Θ)
B = ϕ
C = Θ
(2)
To convert the Cartesian coordinate system used
in graphical computing environments to the spherical
CSEDU 2019 - 11th International Conference on Computer Supported Education
168

and F2S2 coordinate systems, Equations 3 and 4 are
used, respectively.
r =
p
X
2
+Y
2
+ Z
2
Θ = arccosine(Z ÷ r)
ϕ = arctangent(Y, X)
(3)
H = Z
V =
p
X
2
+Y
2
B = arctangent(Y, X)
C = arccosine(Z ÷ r)
(4)
The F2S2 coordinate system used in the acquisi-
tion of the images can be converted to the spherical
(Equation 5) and Cartesian coordinate systems (Equa-
tion 6).
r =
p
H
2
+V
2
Θ = C
ϕ = B
(5)
X = r × sine(C) × cossine(B)
Y = r × sine(C) × sine(B)
Z = V
(6)
Since the coordinates in the F2S2 coordinate sys-
tem are known during the Frames acquisition process,
it is possible to calculate the spherical coordinates of
each Frame relative to the scanned object. Subse-
quently, to carry out the interactive visualization of
the generated model, the coordinates of the observer
are calculated in a graphical computer system (based
on the Cartesian model). The frame corresponding to
that display is found in the spherical model, and the
image associated with that position is displayed.
Interactivity
Interactivity during the visualization of the gener-
ated model may occur in two ways: navigation
and geometric transformations (rotation, translation,
and scale). Therefore, it is possible to manipulate
the images with the basic characteristics of a three-
dimensional model. Navigation allows you to change
the point of view to any angle of the object, that is,
changing the view from one position to another. Fig-
ure 9 shows a sequence with a frontal position, right
navigation, upward navigation, and, finally, naviga-
tion to a view from above.
Geometric transformations do not alter the point
of view of the object but lie over a photograph. Trans-
lation is the capability to move the image on the
screen, for instance, from the center to one of the cor-
ners. Rotating is changing the orientation of the im-
age, for instance, allowing a photograph with the ac-
quired object to be displayed in whatever inclination.
Scaling is the possibility of zooming the image in
or out, making it larger or smaller. As the acquisition
occurs in 4k or 8k, a non-pixelated view is obtained.
Normally, when you enlarge an image, say, by 800%,
it becomes blocky. But in an image with the pixel
density achieved by the F2S2, this does not happen.
Figure 10 shows a digitized model and a sequence
of changes delivered by these geometric transforma-
tions: 10(a) original image, 10(b) major scale, 10(c)
translation, and 10(d) rotation.
The interactivity of the generated model also al-
lows for the addition of hypermedia contents, buttons,
and regions of interest in the images, allowing, for ex-
ample, clicking on parts of the image to display infor-
mation about it, as shown in Section 4 - Figure 14(c).
Stereoscopy
The information on depth and proportion can be gen-
erated using some artificial resource. An example is
a single image captured by a common photo camera.
Depending on the type of image to be captured, the
notion of depth and proportionality is taken into ac-
count. (Murray, 1994) presents the definitions and
discusses the issue of perception of depth. One can
apply so-called passive effects, such as rotating by
90
◦
, to a static image. These effects are inherent to
the world as we see it and do not depend on the way
in which they are captured. The characteristics of
this type of effect are perspective, lighting, occlusion,
shadow, and texture gradient.
Perspective gives us the sensation of objects be-
ing larger or smaller than others depending on their
position. Illumination is an effect that contributes to
giving shapes to objects; it also produces the effect
of shadow, which is easy to visualize and understand,
as for shadow to exist there must be light. Occlusion
occurs when one object overlaps another, that is, it
stands in front of another hiding parts of the one be-
hind. In order to create a notion of depth, one can
also use texture gradient, since its effect is a repeti-
tion of the pattern present in the virtual environment
or object.
In short, all of these characteristics are related to
the 3D effect on virtually created objects, since they
are originally flat, and that does not change with the
application of these effects. However, through their
application, one has the feeling that the object has
depth and proportion. You can see these effects in
photographs, as shown in Figure 11, without the need
for a software application.
Stereoscopic Interactive Objects: Acquisition, Generation and Evaluation
169

(a) (b) (c) (d)
Figure 9: Interactivity: navigation.
(a) (b)
(c) (d)
Figure 10: Interactivity: geometric transformation.
Figure 11: Passive effects.
Unlike the types of passive effect cited, stere-
oscopy in humans is of the active type. This means
that two images are needed for the brain to form the
notion of depth and proportion. The brain treats an
image captured by a single eye as flat, mainly lacking
the notion of depth. Stereoscopy comes from the fact
that the human vision presents a difference between
the images captured by the eyes due to their position
since, in humans, they are facing forward and with an
average separation of 6.5 cm. This difference, called
binocular disparity, allows for two slightly different
images, one for each eye, enabling the mentioned no-
tions, and known as the stereoscopic view.
As for the stereoscopic view on devices such as
TVs, monitors, cell phones or screen projectors, there
is also a concept of distance. However, it is related to
parallax. Parallax is understood to be the positioning
changes of an object in relation to the different points
of observation, or the apparent displacement of a ref-
erence from the movement of an observer. It allows
you to have a feeling of depth. In other words, the
stereoscopic view is obtained by means of the differ-
ence in the positioning of the eyes and the crossing
point of the images of each eye.
Parallax and Disparity for the formation of stereo-
scopic images are similar. As seen, parallax is related
to the projection plane of the images, so its measure-
ment is carried out in this plane. The disparity is a
retina-related measure, the distance between the eyes.
The use of some apparatus to view stereoscopic im-
ages, such as glasses, causes parallax to become the
so-called retinal disparity. Thus, parallax will pro-
duce retinal disparity and will be responsible for the
production of the stereo vision.
Parallax can be given in terms of angular measure,
thus relating it to disparity by taking the distance be-
tween an observer and the plane of projection into
account. As mentioned, there is a mean difference
(DM) between the eyes, given in centimeters; if you
also have the distance in centimeters between the ob-
server and the plane (d), you can calculate the angular
measure (α), as seen in Equation 7.
α = 2 arctan
DM
2d
(7)
Using the F2S2, you can create stereoscopy with-
out the need for transformation, which is very com-
mon when you make a picture with two parallel or
convergent cameras. In the latter case, the image must
be adjusted so that the common points of both the
right and left images are present; otherwise, you will
have problems with stereoscopy, which may cause
discomfort during visualization.
The F2S2 scanning process eliminates the need to
apply mathematical transformations, since it acquires
CSEDU 2019 - 11th International Conference on Computer Supported Education
170

the images in different angles, as happens in the hu-
man view, where each eye perceives the object from a
different position. Thus, the image scan enables stere-
oscopy by simply overlapping two scans.
The name of these two images is stereo pair.
Based on the parameters of parallax and disparity, the
selected images are 6
◦
apart (angular variation Θ).
Using a pair of images 2
◦
or 4
◦
apart generates less
intense stereoscopy. Pairs of images in which the dis-
tance is more than 6
◦
will cause discomfort.
The anaglyph technique was used for the stereo-
scopic visualization as seen in Figure 12. In this
technique, the color channels in the two images are
changed, placing the image seen by the left eye in one
color and the right one in another. Normally, the red
channels are used for the left images and cyan (blue
and green) images for the right ones, as was the case
in the first few years of 3D cinema, although this de-
pends more on the colors present in the lenses of the
glasses. Despite the processing of the images, the
stereoscopic visualization maintains the original color
of the object.
Figure 12(b) was acquired with a 6
◦
difference in
relation to Figure 12(a) of which the green and blue
channels were removed, leaving the red channel only.
In Figure 12(b) the red channel was removed, leaving
the cyan. This process is accomplished at runtime by
means of Equation 8.
EA = 255 −
(255 − M) ∗ (255 − Ii)
255
(8)
AE (Anaglyph Stereoscopy) is the final image, M
or Mask is the image of the upper level (Figure 12(a))
and Ii the image of the lower level (Figure 12(b)).
This is done with all the images acquired by F2S2,
obeying the criterion of angular variation Θ. For ex-
ample, the acquisition of a stream of 2 in 2 degrees,
obtaining 180 images, allows stereoscopy between
the 1
st
and 4
th
frames (0
◦
and 6
◦
, respectively), 2
nd
and 5
th
(2
◦
and 8
◦
), 3
rd
and 6
th
(4
◦
and 10
◦
), and
so on, repeating the angular variation Θ = 6
◦
. Since
the last are formed between the 177
th
and 180
th
(352
◦
and 358
◦
), 178
th
and 1
st
(354
◦
and 0
◦
), 179
th
and 2
nd
(356
◦
and 2
◦
), 180
th
and 3
rd
(358
◦
and 4
◦
), all possi-
ble visualizations of the object are covered.
3 LEARNING OBJECTS
Diversity within the educational environment fos-
ters discussion among all learners, both students and
teachers, about how to present content as they all try
to find new ways of supporting the teaching-learning
process.
(a) (b)
(c) (d)
(e)
Figure 12: Images: (a) Left, (b) Right, (c) Red, (d) Cyan
and (e) Anagliph.
We understand that it is in this context that Learn-
ing Objects (LO) come in (Redmond et al., 2018) (Sri-
vastava and Haider, 2017). A definition of LO, ac-
cording to the Learning Technology Standards Com-
mittee (LTSC-IEEE), is “any digital or non-digital en-
tities that can be used, reused or referenced during
learning with technological support”
2
.
Thus, we address here how to prepare the contents
generated by F2S2 for use in several domains, espe-
cially in education. That is, all the objects scanned
by F2S2 are considered “raw resources” ((Tarouco
et al., 2014) pg.17) for the creation of LOs, and should
be prepared for the devices of the visualization men-
tioned in section 2. In (Guterres and Silveira, 2017b)
2
LTSC - http://sites.ieee.org/sagroups-ltsc/home/
Stereoscopic Interactive Objects: Acquisition, Generation and Evaluation
171

is presented a framework that may help you develop
LOs.
From the point of view of education as dis-
cussed by (Wiley, 2002), the application of LOs it-
self does not guarantee that pedagogical objectives
are achieved. He questions the use of the LEGO
T M
blocks introduced by Hodigns (Hodgins, 2002) as an
LO, claiming it to be a simplifying metaphor, which
may neglect the challenges of creating educational ex-
periences. Despite this, due to the diversity within the
educational environment, every student’s need must
be taken into account. (Mend
´
ez et al., 2016) address
the concern of adequacy of each student to LOs.
A consensus is that LOs should contain reusable
contents, that is, they should meet this criterion for
their elaboration. Despite this definition, there are
barriers to the adoption of this type of initiative, since
institutions differ on what constitutes an LO. But
there are also various development problems, as seen
in (Guterres and Silveira, 2017a).
In an attempt to overcome these barriers, we seek
to develop reusable LOs in different areas of knowl-
edge that offer dynamic interaction, allowing partici-
pants to intervene freely to move an object to the de-
sired position, for use in educational environments,
for example, classrooms, or on their own devices such
as notebooks or Virtual Reality.
To be accessible and reusable, LOs are stored
in so-called repositories. An example is found in
(d. Silva et al., 2017). (Rodes-Paragarino et al., 2016)
address repositories adopted by teachers. Reposito-
ries make metadata available (LTSC, 2002) besides
ontologies, which also facilitate searches (Araujo,
2017) (Carvalho et al., 2017) (Lima et al., 2017)
(Sanches et al., 2017).
Repositories should provide LO metadata (MOA)
with a high degree of semantic interoperability. The
Open Archives Initiative Protocol for Metadata Har-
vesting (OAI-MPH)
3
, which is in version 2.0, aims to
collect metadata through an application-independent
interoperability framework.
However, this paper does not aim to produce
repositories nor metadata, but an LO with the objects
scanned by F2S2. This LO may be made available in
some repositories with metadata for access in the fu-
ture. The idea of this paper was to create an LO and
evaluate its feasibility through the participation of a
group of teachers from different areas and levels. We
describe the outcomes in section 4.
3
http://www.openarchives.org/OAI/2.0/
openarchivesprotocol.htm
4 LO ASSESSMENT
The objects scanned by F2S2 allow for the construc-
tion of an LO that offers interactivity and visual acu-
ity. However, it needs to be scrutinized by those who
might use it: students, teachers, and pedagogy pro-
fessionals. Therefore, we held two meetings to test an
LO with respect to acceptability.
In one meeting, we showed teachers and a profes-
sional in pedagogy an LO. In the other, a group of
students attended a lesson. After these meetings, we
handed out questionnaires with the objective of eval-
uating the LO and its acceptance by those involved.
We produced the LO from the digitization of a
human skull and added interactivity and stereoscopy
properties, as well as buttons identifying the bones.
When you click on a button, the skull rotates to the se-
lected bone, which appears on the screen and is high-
lighted. Figure 14 shows the LO screens used in the
search. Figure 14(c) shows the maxillary bone was
selected and evidenced.
Evaluation by the Teachers
The invited teachers work at different levels of educa-
tion, ranging from medium to higher levels. They re-
ceived manipulation instructions and used the tool as
if they were teaching a lesson. They were then asked
to comment on positive points or those that are flawed
and should be improved.
We prepared the environment with a multimedia
projector and two notebooks with the tool running on
both. Thus the teachers could manipulate the tool on
the notebook connected to the projector to become
comfortable with the manipulation commands as well
as to view the object also on a monitor/TV and not
only projected on the wall/screen, for the projector
was not of high resolution.
This procedure was adopted for them to have a vi-
sual experience of quality that a TV/monitor, even if
only FullHD and not in 4k, could provide. Partici-
pants were able to discuss the use of the LO at the
levels in which they operate. They started to suggest
what would be interesting for a given level and what
could contribute to the learning process.
A cross-sectional study was carried out on May
28 and 29, 2018. Aiming for greater variability in the
sample, we invited 15 teachers working at the medium
technical level (computer science and biotechnology),
post-technical (oral and dental health), and higher
level (biological sciences and systems analysis and
development). The teachers were asked to analyze
if the same LO could be interesting for the differ-
ent courses. As the selection considered the courses
CSEDU 2019 - 11th International Conference on Computer Supported Education
172

Figure 13: Teachers’ answers.
(a) (b)
(c)
Figure 14: The Learning Object.
in which the participants work, the sample is non-
probabilistic.
All teachers signed a free and informed consent
form. After the presentation and effective use of the
tool, they answered a questionnaire with ten closed
questions, and a scale from Strongly Disagree to
Strongly Agree. The questions were:
1. Were you comfortable using the environment to
display the content to the students?
2. Do you think software like this can help you in the
teaching-learning process?
3. Would you use this environment in your classes?
4. Do you believe that you can use the environment
in a multidisciplinary and interdisciplinary way?
5. Do you believe that you can use the environment
for problematization?
6. Do you believe that you can use the environment
in active methodologies?
7. Do you think that this environment can be a way
of attracting the attention of the students?
8. Do you think that the present object, giving the
sensation of being an object similar to the real one
by its color, texture, and shape, can motivate the
students?
9. Can the manipulation of the object and visualiza-
tion of all angles encourage interaction/discussion
between the teacher and the students?
10. Can the manipulation of the object and the
visualization of all angles encourage interac-
tion/discussion among students?
We structured the questions in order to answer
three hypotheses based on Ackerman’s study, which
argues that the lack of interactivity (three-dimensional
visualization) and the imprecision of the models (vi-
sual acuity) hinder the learning process of anatomical
structures. The hypotheses were:
1. The content, with its interactive visualization fea-
tures and visual acuity, motivates the teacher in
the teaching-learning process. Questions 1 to 6;
2. The content, with its interactive visualization fea-
tures and visual acuity, motivates the student in
the teaching-learning process. Questions 7 and 8;
3. The interactivity and visual acuity of the envi-
ronment promote discussions between teacher and
student, and among students. Questions 9 and 10.
Hypotheses 1 and 2 were based on the premise
that the interactivity of the model can help understand
three-dimensional biological structures, and this can
motivate the teacher and the student. Hypothesis 3
Stereoscopic Interactive Objects: Acquisition, Generation and Evaluation
173

is based on the possibility that, in contrast to materi-
als such as a photo in a book, that directly exhibit a
particular structure, the interactive model enables ex-
amining the structure and visualizing it by different
angles. Interactivity was assessed in relation to pro-
moting in-class discussions when compared to static
materials. The answers obtained by the questionnaire
can be seen in Figure 13.
Questions 1, 2, and 3 address comfort and relia-
bility of the teachers’ use of the tool; comfort can be
determinant for its adoption in the classroom and can
help in the teaching-learning process. In response to
these questions, 93% of teachers indicated that they
agree or fully agree that they felt comfortable, believe
that the system can help to teach and that they would
use LO in the classroom. Two teachers were indiffer-
ent, and one did not answer, because he did not use
the tool but just watched the others.
Questions 4, 5, and 6 map the teachers’ believes
that this technology can be used in a multidisciplinary
and interdisciplinary way, for problematization or in
active methodologies. In response to these questions,
95% of the teachers said yes, one teacher did not re-
spond, and another was indifferent. As to the totality
of responses obtained on hypothesis 1, 94% of teach-
ers agree that the tool is motivational in the teaching-
learning process.
With regard to questions 7 and 8, linked to hy-
pothesis 2, all teachers agreed or fully agreed that LO
could be a motivating factor for students. Questions 9
and 10, related to hypothesis 3, outline if the interac-
tivity of the tool can promote discussions in the class-
room, since it encourages the student to search for the
information and not wait, solely and exclusively, for
the teacher’s answer. To this hypothesis, 96% of the
respondents agreed or fully agreed that the tool could
encourage in-room discussions. One teacher was in-
different.
In addition to the questionnaires answered by the
teachers, we invited a pedagogue to participate in
the presentation and later interviewed her in an open
interview, with predetermined questions and ample
freedom of reply. The teacher questioned the com-
putational resources needed to apply the technology:
“High-resolution TVs and expensive computers are
not a reality in most classrooms in Brazil”. In this re-
gard, in the coming years, these technologies tend to
become cheaper and become standard, thus entering
the classroom.
As for the present system, according to the peda-
gogue, the fact that the model is interactive and en-
courages the student to explore information makes
understanding of the subject of the lesson “complete”
and makes the tool a good option for active method-
ologies. Interactivity and the possibility of seeing all
the angles of the object can encourage interaction in
the class since it can make the student analyze the
whole object and not only the displayed angle. “It
can foster and engage curiosity”.
Based on the analysis of the answers, the LO, ac-
cording to the teachers, through its interactivity and
visual acuity, allowed for the visualization of details
that synthetic objects do not offer; nor do photos,
compared to this LO, allow full visualization and ma-
nipulation of the object.
Evaluation by the Students
In a similar way to what we did with the teachers, on
February 8, 2019, we taught a lesson to a group of 23
students of the technological course in Radiology, in
which we used the same LO presented to the teachers.
After the lesson, we gave the students a questionnaire
with the following questions:
1. Were you interested in the content because it was
in three dimensions?
2. Do you think software like this can help you in
your learning process?
3. Do you feel that this interactive environ-
ment might draw more of your attention than
static environments such as photos, books, and
slideshows?
4. The fact that the skull can be rotated to view other
sides can favor discussions about the topic of the
lesson?
5. Zooming in on more detail can foster debates on
the subject of the lesson?
6. Compared to drawings, photos, books, or
slideshows, can three-dimensional content en-
courage class discussion?
7. Do you think that the object presented gives you
the sensation it of being an object similar to the
real one by its color, texture and form?
8. Describe the experience of using the environment
and think of the possibilities it may offer to your
learning process. (Open-ended question).
The purpose of these questions was to map two
hypotheses:
1. The environment, with its three-dimensional vi-
sualization characteristics, interactivity, UHD and
fidelity of form, color, and texture, motivates the
student in his learning process. Questions 1, 2, 3,
and 7.
2. The interactivity and fidelity of the environment
promote discussions between teacher and students
and among students. Questions 4, 5 and 6.
CSEDU 2019 - 11th International Conference on Computer Supported Education
174

Figure 15: Students’ answers.
Hypothesis 1 is based on the premise that the inter-
activity and visual acuity of the technology used can
help in the understanding of three-dimensional struc-
tures, motivating the student in his learning process.
Hypothesis 2 examines whether interactivity can pro-
mote classroom discussions as it offers the student the
opportunity to search for the information instead of
readily getting it, just as in a book that shows the ideal
perspective for analysis of a given structure. Figure
15 shows the answers obtained by the questionnaires.
As for the answers, the perception of the stu-
dents involved in the study is that the characteristics
of interactivity, three-dimensionality, high resolution,
and fidelity motivate the student in his learning pro-
cess since to questions 1, 2, and 7, 100% of the stu-
dents answered affirmatively. Regarding question 3,
two students classified it as indifferent, and 91% re-
sponded affirmatively.
According to the students’ response, the presented
technologies are able to motivate discussions in the
classroom since questions 4 and 6 received a 100%
affirmative answers, and only one answer to question
5 was indifferent.
With regards to question 8, discursive, 15 of the
23 students answered the question. One reported: “...
I have difficulty in concentrating on my learning, and
these images helped me focus on the whole explana-
tion ...”. Other 08 students stated that the possibility
of visualizing structures in high resolution, with vi-
sual acuity and three-dimensionality could help them
in their learning process.
One of the students still wrote: “The presence of
the object in 3D gives a real notion of the mass and
shape of the object, which is a better way of under-
standing the function of the object”. This answer con-
firms Ackerman’s claim that interactivity and visual
acuity are important for the understanding of three-
dimensional structures.
5 CONCLUSION
This paper presented an evaluation of an LO produced
from scans of the Full Frames Semi-spherical Scan-
ner. As a contribution, the scanning method offers a
feature for a new form of 3D visualization with visual
acuity.
So, we created an LO by digitizing a human skull,
adding interactivity to the 3D visualization. This ob-
ject was manipulated by students and teachers, who
answered a questionnaire about the use of the tool.
The results show that interactive material is an alter-
native that can motivate teachers and students, as well
as being able to promote debates between teacher and
students and among the students.
Although the number of teachers who answered
the questionnaire is not sufficient to generalize con-
clusions about the technology developed and the ob-
ject generated, those who manipulated the tool con-
sidered that the visualization adequately represents
the real object, and it can help in the teaching-learning
process.
Our next steps will involve the preparation of
learning objects to be used in class, and experiments
to evaluate the effectiveness of the objects compared
to other technologies without interactivity, visual acu-
ity, and stereoscopy.
REFERENCES
Ackerman, M. J. (1998). The visible human project. Pro-
ceedings of the IEEE, 86(3):504–511.
Araujo, A. (2017). Experi
ˆ
encias l
´
ogico-matem
´
atica: um
objeto de aprendizagem de uso integrado de recursos
manipulativos digitais. (Cbie):546.
Carvalho, V., Ara
´
ujo, R. D., Ferreira, H., Cattelan, R.,
and Dorc¸a, F. (2017). OntAES: Uma Ontologia para
Sistemas Adaptativos Educacionais Baseado em Ob-
Stereoscopic Interactive Objects: Acquisition, Generation and Evaluation
175

jetos de Aprendizagem e Estilos de Aprendizagem.
(Cbie):1307.
Cheng, Y., Pedersen, M., and Chen, G. (2017). Evaluation
of image quality metrics for sharpness enhancement.
In Proceedings of the 10th International Symposium
on Image and Signal Processing and Analysis, pages
115–120.
d. Silva, J. W. F., d. Souza, C. T., and d. F. C. d. Souza,
M. (2017). Clover: An optimized repository for cus-
tomizable learning objects. In 2017 IEEE 17th Inter-
national Conference on Advanced Learning Technolo-
gies (ICALT), pages 76–78.
Guterres, J. and Silveira, M. (2017a). As Principais Dificul-
dades Encontradas Durante o Processo de Produc¸
˜
ao
de Objetos de Aprendizagem. (Cbie):294.
Guterres, J. and Silveira, M. (2017b). Um Framework para
Apoio
`
a Reflex
˜
ao sobre o Processo de Produc¸
˜
ao de
Objetos de Aprendizagem. (Cbie):284.
Hodgins, H. W. (2002). The future of learning ob-
jects. http://www.coe.gatech.edu/eTEE and http:
//dc.engconfintl.org/etechnologies/11/ acessado em
2018/06/08.
Krasula, L., Callet, P. L., Fliegel, K., and Kl
´
ıma, M. (2017).
Quality assessment of sharpened images: Challenges,
methodology, and objective metrics. IEEE Transac-
tions on Image Processing, 26(3):1496–1508.
Lima, R. W. D., Oliveira, A. M. D., and Silva, P. D. A.
(2017). Ontologia para o Gerenciamento de Objetos
de Aprendizagem. (Cbie):1796–1798.
LTSC, L. T. S. C. (2002). Ieee standard for learning object
metadata. IEEE Std 1484.12.1-2002, pages 1–40.
Mend
´
ez, N. D., Morales, V. T., and Vicari, R. M. (2016).
Learning Object Metadata Mapping with Learning
Styles as a Strategy for Improving Usability of Educa-
tional Resource Repositories. Revista Iberoamericana
de Tecnologias del Aprendizaje, 11(2):101–106.
Murray, J. (1994). Some perspectives on visual depth
perception. ACM SIGGRAPH Computer Graphics,
28(2):155–157.
Redmond, C., Davies, C., Cornally, D., Adam, E., Daly, O.,
Fegan, M., and O’Toole, M. (2018). Using reusable
learning objects (RLOs) in wound care education: Un-
dergraduate student nurse’s evaluation of their learn-
ing gain. Nurse Education Today, 60(November
2016):3–10.
Rodes-Paragarino, V., Gewerc-Barujel, A., and Llamas-
Nistal, M. (2016). Use of Repositories of Digital
Educational Resources: State-of-the-Art Review. Re-
vista Iberoamericana de Tecnologias del Aprendizaje,
11(2):73–78.
Sanches, L., Costa, L., Salvador, L. N., and Souza, M.
(2017). Anotac¸
˜
ao sem
ˆ
antica autom
´
atica de Objetos de
Aprendizagem Digitais: Um mapeamento sistem
´
atico
de literatura. (Cbie):31.
Solav, D. (2018). MultiDIC: an Open-Source Toolbox for
Multi-View 3D Digital Image Correlation. 6.
Srivastava, B. and Haider, M. T. U. (2017). Personalized
assessment model for alphabets learning with learning
objects in e-learning environment for dyslexia. Jour-
nal of King Saud University - Computer and Informa-
tion Sciences.
Tarouco, L. M. R., Costa, V. M. d.,
´
Avila, B. G., Bez, M. R.,
and Santos, E. F. d. (2014). Objetos de Aprendizagem:
Teoria e Pr
´
atica.
Weber, J., Faria, V. D., Teixeira, M. J., Otoch, J. P., and
Figueiredo, E. G. (2016). Virtual and stereoscopic
anatomy: when virtual reality meets medical educa-
tion. 125(November):1105–1111.
Wiley, D. A. (2002). Connecting learning objects to in-
structional design theory: A definition, a metaphor,
and a taxonomy. http://reusability.org/read/chapters/
wiley.doc acessado em 2018/06/08.
Xu, G., Chen, J., and Li, X. (2017). 3-D Reconstruction
of Binocular Vision Using Distance Objective Gener-
ated From Two Pairs of Skew Projection Lines. IEEE
Access, 5:27272–27280.
Yu, H., Cao, T., Li, B., Dong, R., and Zhou, H. (2016). A
method for color calibration based on simulated an-
nealing optimization. In 2016 3rd International Con-
ference on Information Science and Control Engineer-
ing (ICISCE), pages 54–58.
Zhang, T., Liu, J., Liu, S., Tang, C., and Jin, P. (2017). A 3D
reconstruction method for pipeline inspection based
on multi-vision. Measurement: Journal of the Inter-
national Measurement Confederation, 98:35–48.
CSEDU 2019 - 11th International Conference on Computer Supported Education
176
