
Aerial Monitoring of Rice Crop Variables using an UAV Robotic System
C. Devia
1
, J. Rojas
13
, E. Petro
2
, C. Martinez
1
, I. Mondragon
1
, D. Patino
1
, C. Rebolledo
2,3
and J. Colorado
1
1
School of Engineering, Pontificia Universidad Javeriana, Bogota, Colombia
2
The International Center for Tropical Agriculture -CIAT, Agrodiversity, Palmira, Colombia
3
CIRAD, AGAP-Pam, Montpellier, France
Keywords:
UAV, Precision Agriculture, Image Processing, Vegetative Indices, Multispectral Imagery, Machine Learning.
Abstract:
This paper presents the integration of an UAV for the autonomous monitoring of rice crops. The system
integrates image processing and machine learning algorithms to analyze multispectral aerial imagery. Our
approach calculates 8 vegetation indices from the images at each stage of rice growth: vegetative, reproductive
and ripening. Multivariable regressions and artificial neural networks have been implemented to model the
relationship of these vegetation indices against two crop variables: biomass accumulation and leaf nitrogen
concentration. Comprehensive experimental tests have been conducted to validate the setup. The results
indicate that our system is capable of estimating biomass and nitrogen with an average correlation of 80% and
78% respectively.
1 INTRODUCTION
The use of Unmanned Aerial Vehicles (UAV) in the
solution of agriculture-related problems spans a wide
range of operations such as crop variable measure-
ment (Gevaert et al., 2015),(Gago et al., 2015) fruit
detection (Carrijo et al., 2017), crop plot detection
(Hongli et al., 2017), crop yield improvement (Arroyo
et al., 2017) and crop mapping (Guo et al., 2012),
(Khanna et al., 2015). In (Dongyan Zhang, Xin-
gen Zhou, Jian Zhang, Linsheng Huang and Zhao,
2017) the sheath blight fungus disease of rice was de-
tected using a Phantom 2 UAV coupled with a high-
resolution RGB multispectral camera (Micasense).
Pix4D software was used to generate 2D and 3D geo-
referenced maps and to compute different vegetation
indices. In (Yong et al., 2016), (Lu et al., 2015),
UAVs were used for nitrogen estimation and chloro-
phyll quantification (Uto et al., 2013) using hyper-
spectral sensors.
Multispectral images have been used in plant anal-
ysis for some time now (Naito et al., 2017). Initially,
few vegetation indices were commonly used, mainly
the Normalized Difference Vegetation Index (NDVI)
for estimating above ground biomass. However, due
to the presence of external factors such as water, soil
backgrounds and the difference of the crop at each
stage of growth, different vegetative indices were in-
troduced, such as the Soil-Adjusted Vegetation Index
(SAVI), the Modified SAVI (MSAVI), the Modified
Chlorophyll Absorption Ratio Index (MCARI) and
the Modified Triangular Vegetation Index (MTVI),
among others (Gnyp et al., 2014).
The development of an UAV-based crop monitor-
ing system involves multiple challenges. In hardware
terms the UAV requires sufficient autonomy to cover
the crop area, also adequate on-board store capac-
ity for high-resolution data, as well as low-weight
sensors. The integration of the native UAV hard-
ware with external sensors requires a significant in-
terplay between hardware and software in order to
guarantee data reliability, online processing and sim-
ple end-used experience. In previous work (Devia
et al., 2019), we tackled these challenges by devel-
oping an autonomous UAV robotic system to monitor
biomass dynamics based on NIR information. In this
paper, we present a preliminary approach to also mon-
itor leaf nitrogen concentration during the three main
stages of plant growth: vegetative, reproductive and
ripening. Our goal is to estimate biomass dynamics
and nitrogen variations by calculating several vegeta-
tion indices from multispectral data. To this purpose,
we present the robotic system architecture detailed in
Figure 1. Two UAVs have been setup with both NIR
and thermal cameras (upcoming work is oriented to-
wards cooperative-UAV monitoring). For instance,
Devia, C., Rojas, J., Petro, E., Martinez, C., Mondragon, I., Patino, D., Rebolledo, C. and Colorado, J.
Aerial Monitoring of Rice Crop Variables using an UAV Robotic System.
DOI: 10.5220/0007909900970103
In Proceedings of the 16th International Conference on Informatics in Control, Automation and Robotics (ICINCO 2019), pages 97-103
ISBN: 978-989-758-380-3
Copyright
c
2019 by SCITEPRESS – Science and Technology Publications, Lda. All rights reserved
97

each robot captures a dataset of images independently
and the processing is done in a PC base-station.
2 METHODS
2.1 UAV Robotic System
As mentioned, two UAVs were integrated: The AS-
CTEC Pelican
1
and the DJI Phantom
2
. Also, the fol-
lowing equipment was used:
• ASCTEC Pelican:
– ASCTEC autopilot.
– Mastermind board for image processing and
data acquisition.
– Tetracam ADC-Lite multispectral camera: this
camera captures visible light wavelengths
longer than 520nm and near-infrared (NIR)
wavelengths up to 920nm. The multispectral
camera is located in the bottom of the drone and
aligned with the center of mass.
• DJI Phantom:
– DJI autopilot.
– Parrot Sequoia multispectral camera
3
: his cam-
era comes with 4 different sensor to capture im-
age in different wavelengths: red, green, NIR
and Red-Edge.
– Flir duo R thermal camera
4
with 640 × 512 in
resolution with 32
o
C field of view. It incor-
porates a radiometric sensor operating at sam-
pling frequency of 30Hz and capable of sensing
the crop temperature between −20
o
C and 50
o
C
with a resolution of ±5
o
C.
The standard GPS waypoint navigation for both
drones comes with a graphical user interface -GUI
that allows for autonomous take-off, waypoint tra-
jectory following and landing. In this work, the
flight planning was enhanced with an additional mod-
ule created for the image capturing planning process.
This new module creates a GPS grid with the posi-
tions were the images must be taken in order to ensure
appropriate image resolution, crop plot coverage and
sufficient overlapping of images for ensuring reliable
data-mapping of the crop. In this sense. our photo
planner algorithm uses geometric parameters of the
1
http://www.asctec.de/en/uav-uas-drones-rpas-roav/
asctec-pelican/
2
https://www.dji.com/phantom-4
3
https://www.parrot.com
4
https://www.flir.com/products/duo/
NIR/thermal camera and the crop plot area to gener-
ate the cartesian points.
The required UAV altitude is also estimated in the
photo planning algorithm. This is done by using the
camera’s field of view in each axis and the desired
image resolution. Figure 2 presents experimental re-
sults regarding aerial crop coverage and geo-mapping
of crop plots by applying classical image mosaicing
techniques. The aforementioned methods were pre-
sented in previous works reported in (Rojas et al.,
2017), (Jose et al., 2016), and (Rojas et al., 2018).
2.2 Crop Variable Estimation
This section addresses the challenges associated with
NIR and thermal image processing to properly com-
pute Vegetative Indices (VI). It mainly consists in
three different stages:
1. Image processing: By taking raw images from
the NIR camera, the system determines the crop
area (plots) that are suitable for VI analysis. In
this process we apply perspective corrections to
the images (using drone’s IMU information) and
filtering strategies to remove the background and
noise. Finally, NIR image segmentation is applied
to extract the crop plot (parcel) of interest, as de-
tailed by Figure 3(a).
2. Vegetation index computation: VI are well-known
formulas that use the reflectance of the plants
in different wavelengths to provide information
about the health state of the plant. Table 1 details
the VI used in this work and their corresponding
formulas.
3. Machine Learning: Once the vegetative indices
are computed, we applied Multivariable Regres-
sion models (MR) to calculate the accumulated
biomass. Only polynomial models were consid-
ered using the vegetative indices as the indepen-
dent variables. Furthermore, we also used Artifi-
cial Neural Networks (ANN) to estimate leaf ni-
trogen concentration by training our system dur-
ing the three main stage of rice growth: vegeta-
tive, reproductive and ripening. Both MR an ANN
models required a ground-truth dataset for train-
ing. In this sense, biomass and nitrogen were di-
rectly measured from the rice crop by following
the traditional sampling method. For biomass, 1
linear meter of plants were cut from the ground,
as detailed by Figure 3(b). Plants were sampled
and weighted, then put in the oven at 65 degrees
Celsius for 4 days or until a constant weight was
reached. For nitrogen, we used a SPAD sen-
sor (Soil-Plant Analyses Development) to directly
measured leaf nitrogen.
ICINCO 2019 - 16th International Conference on Informatics in Control, Automation and Robotics
98
WiFi
Base Station
drivers
database
User
DGPS
GPS+IMU
NIR image
Radiation
Temperature
Sensor
Fusion
MACHINE
LEARNING
Mission Setup Drone
commands
Biomass
Nitrogen
Water Stess
Rice Crop
Camera Setup
Thermal image
[ data ]
xbee
2.4GHz
NIR and thermal imagery
Camera
GPR
Drone 1
Drone 2
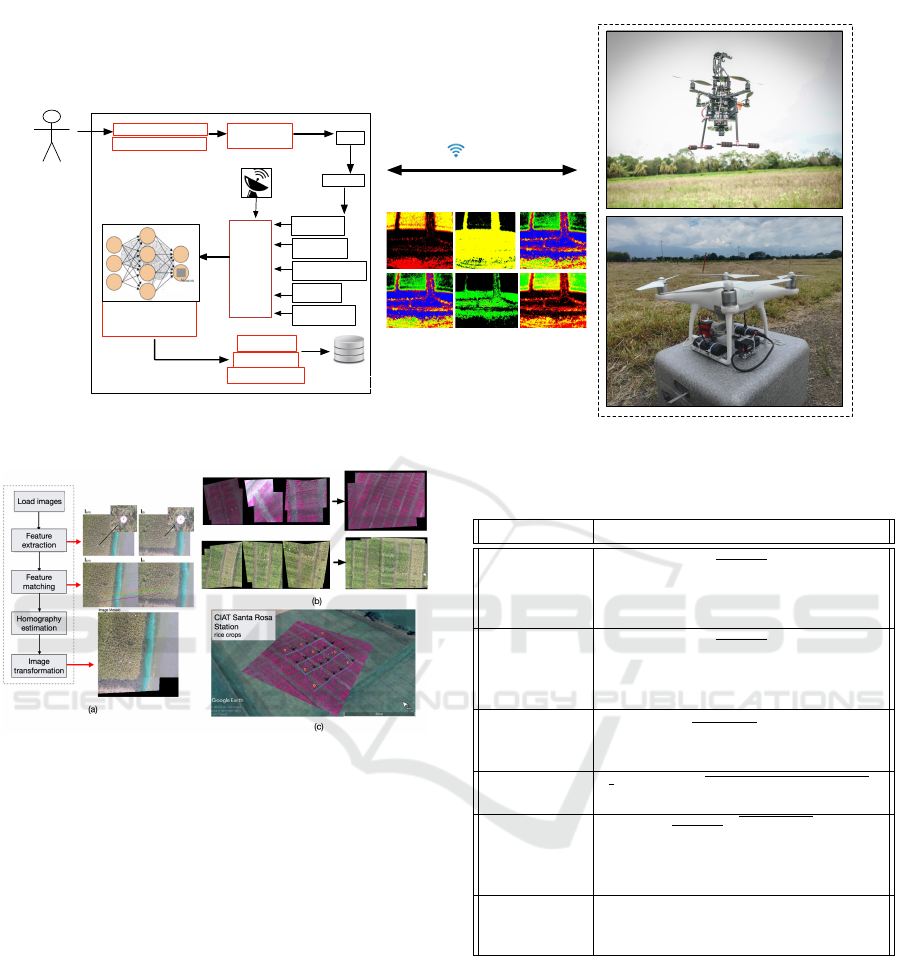
Figure 1: Multi-UAV robotic system architecture for crop monitoring.
Figure 2: (a) image mosaicing flow diagram: SURF and
ORB algorithms were implemented for feature extraction.
The FLANN Fast (Library for Approximate Nearest Neigh-
bors) algorithm was used for matching, whereas RANSAC
(Random Sample Consensus) algorithm was used to cre-
ate the homography for coordinate frame transformations.
(b) Geo-referenced mosaicing results of applying the steps
from (a) to both NIR and RGB images. (c) resulting NIR
digital map of the crop and the trajectory followed by the
drone.
3 EXPERIMENTAL RESULTS
Experiments were carried out during 2017 and 2018
in the rice farms of the Center of International
Agriculture -CIAT, located in the Department of
Meta, Colombia: latitude 4
o
1
0
37.85
00
N with Longi-
tude 73
o
28
0
28.65
00
W . Figure 4 shows experimental
results for several weeks of in-field testing. Both
MR and ANN methods have been used for the esti-
mation of the crop variables based on NIR imagery.
On average, the former, denoted as Estimation 1,
Table 1: NIR Vegetation Indices used (ρ
f
denotes the re-
flectance of the for the frequency f ) (Gnyp et al., 2014).
Name Equation
Normalized
Difference Veg-
etation Index
-NDVI
ρ
780
−ρ
670
ρ
780
+ρ
670
Green Normal-
ized Difference
Vegetation
Index -GNDVI
ρ
780
−ρ
500
ρ
780
+ρ
500
Soil-Adjusted
Vegetation
Index -SAVI
(1 + L)
ρ
800
−ρ
670
ρ
800
+ρ
670
+L
with L = 0.5
Modified SAVI
-MSAVI
1
2
2ρ
800
+ 1 −
p
(2ρ
800
+ 1)
2
− 8(ρ
800
− ρ
670
)
Corrected
Transformed
Vegetation
Index - CTVI
NDVI+0.5
|NDVI+0.5|
p
|NDVI + 0.5|
Difference Veg-
etation Index -
DVI
ρ
780
− ρ
670
achieves more accurate estimation compared against
the ground-truth value, denoted as Measurement. The
results are consistent for the three stages evaluated:
vegetative, reproductive and ripening. The left plots
of Figure 4 show the biomass and nitrogen estimation
values respectively. Abrupt variations of the signals
(e.g. sampled image 225 in the horizontal axis) indi-
cates a change of crop stage from vegetative to repro-
ductive. In this sense, the time evolution window of
both crop variables is about 3 months.
Using the VIs and the metadata of the corre-
sponding images, the multilinear regression models
Aerial Monitoring of Rice Crop Variables using an UAV Robotic System
99

10Please give a shorter version with: \authorrunning and \titlerunning prior to \maketitle
(a) NDVI (b) GNDVI (c) DVI (d) TVI (e) MSAVI
Fig. 3 Vegeta tive indic es f or upland r ice syste m duri ng ripen ing stage .
(a) NDVI (b) GNDVI (c) DVI (d) TVI (e) MSAVI
Fig. 4 Vegeta tive indic es f or lowland r ice syste m duri ng ve getat ive s tage.
viding mor e parameters with the same available information. Commonly, the
accumulation of biomass i n rice crops during the ripening stage behaves lin -
early with certain vegetation indices, however, for other stages of the crop, the
relationship between biomass and the vegetation indices could be nonlinear.
(a) Upland rice system (b) Lowland rice system
Fig. 5 Rice production systems: lowland and upland. Both pictures correspond to the crops
assessed during the experiments reported in this paper.
3 Field Report
Experiments were carried out during 2017 in the experimental station of CIAT
located in Santa Rosa-Meta (upland conditions) and Palmira-Valle del cauca
(lowland conditions) . The results of this field report were obtained from three
NIR original image
Image Transformation Filtered image k-means clustering
Segmentation
8.1m
10m
4.2m
0.5m
Sampled plants
Edge
(a)
(b)
VI computation
Ground-truth for Machine Learning
Figure 3: (a) Experimental results regarding NIR image pre-processing algorithms. Classical image clustering based on k-
means has enabled to separate NIR pixels into two cluster: plant and no-plant. This allows the image background subtraction
to properly extract the parcel of interest. (b) Ground-truth dataset for machine learning training.
Table 2: Numerical values for biomass and nitrogen/SPAD in vegetative stage directly measured from the crop (ground-truth
values).
Plot/parcel Repetition Fresh weight [g] Dry weight [g] Water Content [g] SPAD/nitrogen
13B1 1 656 118 82.01 47.70
38B4 1 394.00 76.00 80.71 45.30
63B1 1 450.00 88.00 80.44 34.27
88B4 1 814.00 100.00 87.71 41.23
13B5 2 792.00 136.00 82.83 44.37
38B8 2 420.00 76.00 81.90 46.53
63B5 2 646.00 120.00 81.42 43.07
88B8 2 550.00 104.00 81.09 40.30
13B9 3 626.00 126.00 79.87 36.63
38B12 3 656.00 110.00 83.23 44.10
63B9 3 428.00 76.00 82.24 38.13
88B12 3 540.00 108.00 80.00 43.63
were performed for every possible combination of
vegetative indices. Strong linear dependencies were
found between the VIs from Table 1 and the dynamics
of biomass and nitrogen. For instance, linear multi-
variable regressions of the form: β
c
α
c
+ β
SR
SRα
SR
+
β
NDVI
NDVIα
NDV I
+ β
GNDVI
GNDVIα
GNDV I
+
β
CTVI
CTVIα
CTV I
+ β
SAVI
SAVIα
SAV I
+
β
DVI
DVIα
DV I
+ β
MSAVI
MSAVIα
MSAV I
were used to
estimate both crop variables, computing the 7 VIs
with a constant coefficient, where α
c
, α
SR
, α
NDV I
,
α
GNDV I
, α
CTV I
, α
SAV I
, α
DV I
and α
MSAV I
take the
value of 0 or 1. For each coefficient combination
(VIs and the constant term), two images were taken
randomly from each plot. This was done since not all
the plots had the same number of photos, so if all the
photos were used, the resulting regression could have
some bias.
For each stage of the crop (vegetative, reproduc-
tive and ripening), we performed 20 flights, capturing
around 2, 000 images per stage, yielding a dataset of
6, 000 images per trial. Overall, around 18, 000 im-
ages were processed for the estimation of biomass
and nitrogen. Both MR and ANN methods used a
training set of NIR images accounting for the 60% of
the entire database, whereas the remaining 40% for
testing and validation. On the other hand, the corre-
lations between estimated data and the ground-truth
measurements are shown in the histograms depicted
in the right plots of Figure 4. On average, our system
is capable of estimating biomass and nitrogen with a
correlation of 80% and 78% respectively
5
. Higher
correlations above 80% were achieved during the first
vegetative stage of the crop. During this stage, the
5
The following video illustrates the steps performed dur-
ing the experiments: https://youtu.be/BTwD4GduXDo
ICINCO 2019 - 16th International Conference on Informatics in Control, Automation and Robotics
100

0 50 100 150 200 250 300 350 400 450 500
Sample Images
0
200
400
600
800
1000
1200
1400
1600
1800
2000
Biomass
Estimation (Cir) - Vegetative Stage
Estimation (Seg) - Vegetative Stage
Measurement - Vegetative Stage
Estimation (Cir) - Reproductive Stage
Estimation (Seg) - Reproductive Stage
Measurement - Reproductive Stage
Estimation (Cir) - Ripening Stage
Estimation (Seg) - Ripening Stage
Measurement - Ripening Stage
0 50 100 150 200 250 300 350 400 450 500
Sample Images
0
10
20
30
40
50
60
SPAD
Estimation (Cir) - Vegetative Stage
Estimation (Seg) - Vegetative Stage
Measurement - Vegetative Stage
Estimation (Cir) - Reproductive Stage
Estimation (Seg) - Reproductive Stage
Measurement - Reproductive Stage
Estimation (Cir) - Ripening Stage
Estimation (Seg) - Ripening Stage
Measurement - Ripening Stage
0 0.1 0.2 0.3 0.4 0.5 0.6 0.7 0.8 0.9
Correlations
0
5
10
15
20
25
30
35
40
45
Histogram of Correlations BM
0 0.1 0.2 0.3 0.4 0.5 0.6 0.7
Correlations
0
10
20
30
40
50
60
Histogram of Correlations Nt
0 0.1 0.2 0.3 0.4 0.5 0.6 0.7 0.8 0.9
Correlations
0
10
20
30
40
50
60
70
80
90
100
Histogram of Correlations BM
-0.1 0 0.1 0.2 0.3 0.4 0.5 0.6 0.7 0.8
Correlations
0
10
20
30
40
50
60
Histogram of Correlations Nt
45
40
35
30
25
20
15
10
5
0
Vegetative stage
Biomass Correlations
Ripening Stage
0 0.1 0.2 0.3 0.4 0.5 0.6 0.7 0.8 0.9
100
90
80
70
60
50
40
30
20
10
0
0 0.1 0.2 0.3 0.4 0.5 0.6 0.7 0.8 0.9
2000
1800
1600
1400
1200
1000
800
600
400
200
0
Biomass
0 50 100 150 200 250 300 350 400 450 500
Sampled images
Correlations
0
10
20
30
40
50
60
SPAD (Nitrogen)
0 50 100 150 200 250 300 350 400 450 500
Sampled images
(a)
(b)
0 0.1 0.2 0.3 0.4 0.5 0.6 0.7
0 0.1 0.2 0.3 0.4 0.5 0.6 0.7 0.8 0.9
0
10
20
30
40
50
60
0
10
20
30
40
50
60
Nitrogen Correlation
Estimation 1 - Vegetative stage
Estimation 2 - Vegetative stage
Measurement - Vegetative stage
Estimation 1 - Reproductive stage
Estimation 2 - Reproductive stage
Measurement - Reproductive stage
Estimation 1 - Ripening stage
Estimation 2 - Ripening stage
Measurement - Ripening stage
Ripening Stage
Estimation 1 - Vegetative stage
Estimation 2 - Vegetative stage
Measurement - Vegetative stage
Estimation 1 - Reproductive stage
Estimation 2 - Reproductive stage
Measurement - Reproductive stage
Estimation 1 - Ripening stage
Estimation 2 - Ripening stage
Measurement - Ripening stage
Vegetative stage
Vegetative stage
Ripening Stage
Correlations
Figure 4: Experimental results (a) Biomass estimation (dry weight), (b) Nitrogen estimation. Left plots compare the estimated
variables (labels Estimation 1 and 2) against the ground-truth labeled as Measurements. For nitrogen, this values is directly
measured using a SPAD device. The time evolution window of both crop variables is about 3 months: vegetative, reproductive
and ripening. Right plots contain the histogram information regarding the correlations achieved during the experiments.
green color of the plants is predominant, as observed
by the inset in Figure 4(a). Therefore, our methods
can be properly calibrated based on accurate VIs cal-
culated from NIR image reflectances. Numerical val-
ues of the ground-truth measurements for the vege-
tative stage are consigned in Table 2. The reproduc-
tive stage is the more critical for our estimations al-
gorithms since panicle formations yield yellow colors
in the images. The merge of both green and yellow
colors difficult the training, specially during the clus-
tering phase where only two clusters are conformed:
plants (green pixels) and no-plant (soil) cf. Figure
3(a). Larger fluctuations in biomass and nitrogen es-
timations occur in this crop stage, as observed in both
Figure 4(a)(b) left plots. Lastly, in ripening stage, the
yellow color becomes predominant, allowing a proper
calibration and therefore accurate estimation of the
crop variables.
4 CONCLUSIONS
This paper presented the integration and deployment
of an UAV system for rice crop monitoring. By using
multivariable regressions and neural networks, our
system was able to estimation biomass and nitrogen
dynamics during the time evolution of the crop, con-
cretely for three stages: vegetative, reproductive and
ripening. From the specialized literature, we identi-
fied the set of vegetation indices that were sensible
to biomass and nitrogen variations according to NIR
image reflectance properties. We combined those in-
dices to achieve the estimations of both values. A
comprehensive field testing of the proposed system
Aerial Monitoring of Rice Crop Variables using an UAV Robotic System
101

enabled us to calculate correlations between the es-
timations and the in-field measurements of the crop
variables. Since the vegetation indices tend to be
evolve linearly during the crop growth, we achieved
accurate correlations using multivariable regressions;
on average, correlations of 80% for biomass and 78%
for nitrogen were achieved. Upcoming work is ori-
ented towards improving the correlations by including
more sophisticated image classification and clustering
algorithms to consider several feature spaces for the
NIR pixels. By now, our system is not reliable during
the reproductive stage of the crop due to the mixed
plant color in between yellow and green. Also, differ-
ent genotypes of rice varieties are planted in the same
plot area. In this sense, we also expect to improve on
the estimation, since the biomass and nitrogen read-
ings are highly dependent of the plant variety.
ACKNOWLEDGEMENTS
This work was funded in part by the OMICAS pro-
gram: Optimizaci
´
on Multiescala In-silico de Cul-
tivos Agr
´
ıcolas Sostenibles (Infraestructura y vali-
daci
´
on en Arroz y Ca
˜
na de Az
´
ucar), sponsored within
the Colombian Scientific Ecosystem by The WORLD
BANK, COLCIENCIAS, ICETEX, the Colombian
Ministry of Education and the Colombian Ministry
of Industry and Turism under GRANT ID: FP44842-
217-2018. Also, by the research project entitled De-
sarrollo de una herramienta para la agricultura de
precision en los cultivos de arroz: sensado del es-
tado de crecimiento y de nutricion de las plantas us-
ando un drone autonomo, under the COLCIENCIAS
- GRANT ID 120371551916, CT167-2016 (FONDO
NACIONAL DE FINANCIAMIENTO PARA LA
CIENCIA, LA TECNOLOGIA Y LA INNOVACION
-FRANCISCO JOSE DE CALDAS).
REFERENCES
Arroyo, J. A., Gomez-Castaneda, C., Ruiz, E., de Cote,
E. M., Gavi, F., and Sucar, L. E. (2017). Uav technol-
ogy and machine learning techniques applied to the
yield improvement in precision agriculture. In 2017
IEEE Mexican Humanitarian Technology Conference
(MHTC), pages 137–143.
Carrijo, G. L. A., Oliveira, D. E., de Assis, G. A., Carneiro,
M. G., Guizilini, V. C., and Souza, J. R. (2017). Au-
tomatic detection of fruits in coffee crops from aerial
images. In 2017 Latin American Robotics Symposium
(LARS) and 2017 Brazilian Symposium on Robotics
(SBR), pages 1–6.
Devia, C. A., Rojas, J. P., Petro, E., Martinez, C., Mon-
dragon, I. F., Patino, D., Rebolledo, M. C., and Col-
orado, J. (2019). High-throughput biomass estimation
in rice crops using uav multispectral imagery. Journal
of Intelligent & Robotic Systems.
Dongyan Zhang, Xingen Zhou, Jian Zhang, Linsheng
Huang, J. and Zhao (2017). Developing a small uav
platform to detect sheath blight of rice. IGRASS, pages
7–10.
Gago, J., Douthe, C., Coopman, R., Gallego, P., Ribas-
Carbo, M., Flexas, J., Escalona, J., and Medrano, H.
(2015). Uavs challenge to assess water stress for sus-
tainable agriculture. Agricultural Water Management,
153:9 – 19.
Gevaert, C. M., Suomalainen, J., Tang, J., and Kooistra,
L. (2015). Generation of spectral 2013;temporal re-
sponse surfaces by combining multispectral satellite
and hyperspectral uav imagery for precision agricul-
ture applications. IEEE Journal of Selected Topics
in Applied Earth Observations and Remote Sensing,
8(6):3140–3146.
Gnyp, M. L., Miao, Y., Yuan, F., Ustin, S. L., Yu, K.,
Yao, Y., Huang, S., and Bareth, G. (2014). Hyper-
spectral canopy sensing of paddy rice aboveground
biomass at different growth stages. Field Crops Re-
search, 155:42–55.
Guo, T., Kujirai, T., and Watanabe, T. (2012). Map-
ping Crop Status From an Unmanned Aerial Vehicle
for Precision Agriculture Applications. ISPRS - In-
ternational Archives of the Photogrammetry, Remote
Sensing and Spatial Information Sciences, XXXIX-
B1(September):485–490.
Hongli, L., Zhoumiqi, Y., Jinshui, Z., and Shuai, G.
(2017). Highly efficient paddy classification using
uav-based orthorectified image. In 2017 IEEE Inter-
national Geoscience and Remote Sensing Symposium
(IGARSS), pages 3230–3233.
Jose, N., Ivan, M., Diego, P., and Julian, C. (2016). Mul-
tispectral mapping in agriculture: Terrain mosaic us-
ing an autonomous quadcopter UAV. In 2016 Inter-
national Conference on Unmanned Aircraft Systems,
ICUAS 2016, pages 1351–1358.
Khanna, R., Martin, M., Pfeifer, J., Liebisch, F., Walter,
A., and Siegwart, R. (2015). Beyond Point Clouds -
3D Mapping and Field Parameter Measurements us-
ing UAVs. IEEE 20th Conference on Emerging Tech-
nologies & Factory Automation, pages 5–8.
Lu, J., Miao, Y., Huang, Y., Shi, W., Hu, X., Wang, X.,
and Wan, J. (2015). Evaluating an unmanned aerial
vehicle-based remote sensing system for estimation of
rice nitrogen status. 2015 4th International Confer-
ence on Agro-Geoinformatics, Agro-Geoinformatics
2015, pages 198–203.
Naito, H., Ogawa, S., Valencia, M. O., Mohri, H., Urano,
Y., Hosoi, F., Shimizu, Y., Chavez, A. L., Ishitani,
M., Selvaraj, M. G., and Omasa, K. (2017). Esti-
mating rice yield related traits and quantitative trait
loci analysis under different nitrogen treatments using
a simple tower-based field phenotyping system with
modified single-lens reflex cameras. ISPRS Journal
of Photogrammetry and Remote Sensing, 125(Supple-
ment C):50 – 62.
Rojas, J., Carlos, D., Petro, E., Martinez, C., Mondragon,
I. F., Patino, D., Rebolledo, M., and Colorado, J.
ICINCO 2019 - 16th International Conference on Informatics in Control, Automation and Robotics
102

(2018). Aerial mapping of rice crops using mosaicing
techniques for vegetative index monitoring. In 2018
International Conference on Unmanned Aircraft Sys-
tems (ICUAS), pages 846–855.
Rojas, J., Martinez, C., Mondragon, I., and Colorado, J.
(2017). Towards image mosaicking with aerial images
for monitoring rice crops. In Advances in Automation
and Robotics Research in Latin America, pages 279–
296. Springer.
Uto, K., Seki, H., Saito, G., and Kosugi, Y. (2013). Char-
acterization of rice paddies by a UAV-mounted minia-
ture hyperspectral sensor system. IEEE Journal of Se-
lected Topics in Applied Earth Observations and Re-
mote Sensing, 6(2):851–860.
Yong, L., Tao, C., Yan, Z., Yongchao, T., Weixing, C., Xia,
Y., Ni, W., Zheng, H., Zhou, X., Cheng, T., Yao, X.,
Tian, Y., Cao, W., and Zhu, Y. (2016). Comparative
analysis of vegetation indices , non-parametric and
physical retrieval methods for monitoring nitrogen in
wheat using UAV-based multispectral imagery Yong
Liu , Tao Cheng , Yan Zhu , Yongchao Tian , Weixing
Cao , Xia Yao *, Ni Wang National En. Ieee, pages
7350–7353.
Aerial Monitoring of Rice Crop Variables using an UAV Robotic System
103
