
Oil and Gas Companies and Their Fair Value: Evidence from
Indonesia Stock Exchange
Nur Hakim Fibrianto
and Riko Hendrawan
Magister Management, Telkom University, Gegerkalong Hilir Street, Bandung, Indonesia
Keywords: Fair Value, Oil and Gas companies, Valuation.
Abstract: State revenues in crude petroleum and natural gas production sub-sector are still high, so the public still
wants to invest its shares. There needs to be a valuation analysis in estimating the fair price of shares based
on fundamental data. The purpose of this study was to analyze the valuation of shares in oil and gas
companies MEDC, ENRG, and ELSA, using the DCF-FCFF method and control it using the RV PER-PBV
method. In this study, there are three scenarios: pessimistic, moderate and optimistic using historical data
from 2013-2017 as the basis for projections for 2018-2022. Comparing the results of the market share fair
value on January 2, 2019, the DCF-FCFF method concluded that the condition was pessimistic: MEDC-
ENRG (overvalued), ELSA (undervalued); moderate: MEDC-ENRG-ELSA (undervalued); optimistic:
MEDC-ENRG-ELSA (undervalued). The RV PER-PBV method shows that the value of MEDC-ENRG-
ELSA is still within the IDX market range Q1-2018. Recommendations for investors are to buy stocks in
undervalued conditions and sell them in overvalued conditions, while for further researchers research can be
done in other sectors besides the oil and gas sector and more assumption data are used for the validity of
data analysis.
1 INTRODUCTION
Industrial companies that are engaged in the crude
petroleum and natural gas production sector or
which we are often familiar with in the oil and gas
sector are still one of the biggest contributors to state
revenues. State revenues in the oil and gas sub-
sector in 2018 to the first semester were US $ 3.5
billion higher when compared to the same period
last year, which was recorded at US $ 17.3 billion or
greater than the same period last year which was US
$ 13, 8 billion, as reported by
www.industri.business.com online media, so that
public interest is still high to invest its shares in the
oil and gas sector. Oil and gas exploration and
production have been enlivened by foreign and local
companies, but the increase in world oil prices does
not necessarily increase stock prices in the capital
market. Based on the purposive sampling criteria of
the closing stock price summary data of oil and gas
companies listed on the Indonesia Stock Exchange
(IDX) until the end of Quarter-2 2018, there were
three companies with large revenue values but
experienced a significant and fluctuating decline in
stock prices, namely PT. Medco Energi International
(MEDC) Tbk, PT. Energi Mega Persada (ENRG)
Tbk and PT. Elnusa (ELSA) Tbk.
Stocks are one component of financial
instruments that have high-risk high return
characteristics. Stock prices can always fluctuate at
any time due to various factors and information
circulating on the exchange. The movement of the
price of a stock in the short term cannot be
ascertained precisely, Neaxie and Hendrawan
(2017). Based on JCI data (Jakarta Composite
Index) on the IDX (Indonesia Stock Exchange) from
January 2013 to June 2018, presented as follows:
Figure 1.1: Trend of Close Price vs Return, Jakarta
Composite Index (JCI). Source: Processed.
106
Fibrianto, N. and Hendrawan, R.
Oil and Gas Companies and Their Fair Value: Evidence from Indonesia Stock Exchange.
DOI: 10.5220/0008428001060116
In Proceedings of the 2nd International Conference on Inclusive Business in the Changing World (ICIB 2019), pages 106-116
ISBN: 978-989-758-408-4
Copyright
c
2020 by SCITEPRESS – Science and Technology Publications, Lda. All rights reserved

Based on the graph in Figure 1.1, it shows that
the JCI has seen an increasing trend in the period of
January 2013 to June 2018, although in the middle
period, some points have fluctuated and the closing
price trend tends to strengthen. Then if we look
deeper based on the return value of the period, there
are several high yield points, with the highest value
of 4.54% on September 19, 2013 and the lowest
yield, which is -5.75 % occurred on August 19,
2013, this shows the risks and returns of an
investment instrument.
The following is a review of the movement of
the stock vs return closing price in the three oil and
gas sub-sector companies with the largest revenue
value, namely PT. Medco Energi Internasional, PT.
Energi Mega Persada and PT. Elnusa
Figure 1.2: Close Price vs. Return Trend, PT. Medco
Energi Internasional. Source: Processed.
From the graph in Figure 1.2, shows that the
trend of closing prices of MEDC shares in the past
five years (2013-2018) experienced a fairly volatile
movement, where there was a close price increase in
early 2013 - late 2014 and in Q1 and Quarter -2 of
2017. The rest throughout the years 2015-2016 and
the end of 2017 to Quarter 2 of 2018 MEDC's share
price have decreased significantly. Likewise, the
movement of the return value experienced a very
volatile trend where the highest return value of
22.05% occurred on July 1, 2016, while the lowest
yield value occurred on December 8, 2017, with a
value of -16.25%.
While in Figure 1.3, it can be seen that the
closing trend of the closing price of ENRG shares is
quite volatile and has decreased from the 3rd
Quarter and 4th Quarter of 2013 and continues to
slow down at the end of semester 1 of 2015. Then
tends to be stable until Q2 2017 but the stock price is
far below the level of the previous period's price.
The closing price of the stock had experienced an
increase in the spike in July 2017 and an increase in
the period around Q1 2018. Related to the return
value of ENRG shares for the past five years also
experienced volatile movements, as well as stable
trends from the 4th quarter of 2015 to the end The
2nd Quarter of 2017. The yield trend experienced
the highest point that occurred on October 23, 2017,
with a value of 29.42% and the lowest return value
of -28.47% on July 28, 2017.
Figure 1.3: Close Price vs. Return Trend, PT. Energi Mega
Persada. Source: Processed.
In Figure Graph 1.4 shows the movement trend
of closing prices of ELSA shares over the last five
years experiencing several periods of incline and
decline, where there was an increase around the
initial period of 2013 to Q2 2014 and Quarter-1 &
Quarter-2 Year 2016, as well as the Quarter-3 period
2017 to Quarter-1 of 2018, the remaining decrease
occurs in the period in several current periods,
namely around the 3rd Quarter of 2014 to the 4th
Quarter of 2015 and the 3rd Quarter of 2016 to the
3rd Quarter In 2017. The movement of ELSA stock
value also looks very volatile with the highest value
of 21.96% on September 13, 2017, and the lowest
value occurred on August 24, 2015, with a value of -
12.85%.
Figure 1.4: Close Price vs. Return Trend, PT. Elnusa.
Source: Processed.
Based on some graphs, it can be concluded that
the growth of shares of oil and gas companies in
Indonesia in the past five years (2013-2018)
Oil and Gas Companies and Their Fair Value: Evidence from Indonesia Stock Exchange
107

experienced a fairly volatile movement. But this is
still below the average growth rate of the Jakarta
Composite Index (JCI) which tends to increase. In
assessing a company, valuation is needed. Future
cash flow or future cash flows that will be received
greatly affect the value of an investment instrument
from the company. In the world of investment, the
valuation of an asset is very important because
errors in the valuation of assets will affect the return
generated.
Every stock price always fluctuates due to
several factors circulating in the stock exchange,
Damodaran (2016) suggests that company value
(Value of the Firm) is an investor's perception of the
success rate of a company which is often associated
with the company's stock price, even though the
stock price what is on the market does not
necessarily reflect the true price of the company, so
fundamental analysis of the value of the company is
needed.
Based on the background described earlier, the
research questions in this study are as follows:
a. What is the intrinsic value of shares in MEDC,
ENRG and ELSA companies in the Indonesia
Stock Exchange using the Discounted Cash
Flow method with the Flow to Firm Free Cash
(FCFF) approach, and Relative Valuation
through the Price to Earning Ratio (PER) and
Price Book Value approaches (PBV) in a
pessimistic condition for 2018?
b. What is the intrinsic value of shares in MEDC,
ENRG and ELSA companies in the Indonesia
Stock Exchange using the Discounted Cash
Flow method with the Flow to Firm Free Cash
(FCFF) approach, and Relative Valuation
through the Price to Earning Ratio (PER)
approach and Price Book Value (PBV) in
moderate conditions for 2018?
c. What is the intrinsic value of shares in MEDC,
ENRG and ELSA companies in the Indonesia
Stock Exchange using the Discounted Cash
Flow method with the Flow to Firm Free Cash
(FCFF) approach, and Relative Valuation
through the Price to Earning Ratio (PER) and
Price Book Value approaches (PBV) in
optimistic conditions for 2018?
d. How to recommend investors to the intrinsic
value of shares in MEDC, ENRG and ELSA
companies as a basis for making decisions to
sell, buy or hold these shares in investing in
2018?
In writing this research, it is expected to have
benefits or uses for those who need it, including
theoretically this research is expected to be used as
input regarding the implementation and use of
valuation theory, especially the valuation of intrinsic
stock value and the projected value of shares more
clearly. Become a reference and description for
future research. Then there are two practical
benefits, namely for the company itself, this research
is expected to provide input for oil and gas sub-
sector companies in increasing the value of the
company through increasing performance so that the
value of shares in the market can reflect its fair
value, while for Investors, this research is expected
to provide appropriate information for investors
regarding the fair price of shares and the intrinsic
value of shares that can be used to support
investment decisions.
From the exposure of the phenomena that have
been explained above, the purpose of this research is
to look for the fair prices (intrinsic value) of the
current oil and gas sub-sector companies listed on
the Indonesia Stock Exchange (2013-2018) using the
Discounted Cash Flow (DCF) method with the Flow
to Firm (FCFF) Free Cash approach and the Relative
Valuation method with Price to Earning Ratio (PER)
and Price Book Value (PBV) approaches.
2 LITERATURE REVIEW
The values and conditions of a company are strongly
influenced by macro conditions, among others: the
political, economic, social conditions of the country
where the company carries out business activities
and the industrial conditions of the company.
Knowing the value of an asset that will be the object
of investment and what gives value to an asset is a
prerequisite for making the right decision in
choosing an investment for a portfolio. Rising
shareholders in most developed or developing
countries have caused more managers to focus on
value creation as the most important company
performance metric. This is evidence to show that
the focus of shareholder value is not only good for
shareholders but also good for the economy and
other stakeholders (McKinsey, Copeland, Koller and
Murrin, 2000).
According to Damodaran (2006), there are three
categories of approaches in conducting business
valuations of an asset, namely Discounted Cash
Flow Valuation, Relative Valuation, Contingent
Claim Valuation. The Discounted Cash Flow
approach connects the value of a stock by looking
for the present value and expected cash flow either
only from dividends (Dividend Discount Models) or
by looking for net cash flows in the future (Free
ICIB 2019 - The 2nd International Conference on Inclusive Business in the Changing World
108

Cash Flow). Relative Valuation is an approach in
estimating the value of shares by comparing the
price of a stock that has almost the same business
characteristics as paying attention to income, book
value or sales, while the Contingent Claim approach
was specifically developed for the valuation of
options and other derivative products.
Valcic, Stumpf, and Katunar (2013) states that
for business research in the oil and gas industry can
be presented with a modern neuro-fuzzy approach.
In this case, the author examines the shortcomings of
existing methods assessment in industrial
complexity and suggest contemporary models based
on computer intelligence algorithms. Identification
and evaluation of important factors that create and
determine the value of the company in the oil and
gas industry in complex calculations involving many
variables.
Zhang (2015) examined the role of income and
book value (BV) in equity valuation, by applying a
model explanatory power method to analyze the role
of accounting data and empirically test hypotheses
with samples of companies registered in China
between 2004 and 2010, where the results were
more stable in equity valuation. In addition, these
results provide references to improve the existing
valuation model and establish accounting standards
and provide some empirical evidence for the
practical application of BV in equity valuation.
Tiwari and Singla (2015) suggested that being a
developing country with a large opportunity for
growth prospects, the valuation model assessment is
important to have a more realistic estimate of value,
where the purpose of this study is to empirically test
comparative accuracy and performance explanations
of discounted cash flows (DCF) and residual income
model (RIM) valuation models for the Indian
chemical industry and produce composite valuation
models. The results of this study indicate that the
Residual Income model and Composite Assessment
model are superior to the discounted cash flow
model and most likely the same. But because the
composite value estimate considers all the bona fide
information from each model, the Composite
Assessment model estimation becomes more
reliable.
Russel (2016) explains that the paper is to value
the patents of pharmaceutical companies using
discounted cash flows, and compare the value-
relevance of these assets against alternative
intangible asset measures such as reported intangible
assets and R&D capital, which the study values
pharmaceutical intangibles using three methods: an
income method; the sum of unamortized R&D
expenditures; the firm’s reported intangible assets.
Value-relevance tests use ordinary least squares
regression and Vuong and Clarke tests. The results
of this study are, first, the study finds that the
discounted cash-flow valuation of pharmaceutical
patents is value-relevant. Second, the value of
pharmaceutical patents explains market value better
than reported intangible assets but not R&D capital.
However, the valuation of pharmaceutical patents is
more consistent with the risks of R&D than the
valuation of R&D capital which assumes recovery of
R&D expenditure.
Sim and Wright (2017) explain that historical
stock prices have long been used to evaluate the
future of stock returns and the risks associated with
these returns. Similarly, the history of dividends has
been used to evaluate the intrinsic value of a stock
using, among other methods, the dividend discount
model. In this chapter, the authors propose an
alternative use of the dividend discount model to
allow investors to assess the risks associated with
certain stocks based on their dividend history. In this
study using a bootstrap approach to generate future
cash dividend flows, and using the Monte Carlo
simulation approach to run several experiments
model. This probability distribution allows an
investor to compare expected returns for a group of
stocks and evaluate the associated risks. With this
information, investors can make investment
decisions that are more appropriate when comparing
several dividend-producing shares. Effective use of
the dividend discount model to calculate internal
returns requires the future generation of random
dividends.
Neaxie and Hendrawan (2017), conducted
research with the aim of estimating the fair value of
shares of telecommunications companies listed on
the Indonesia Stock Exchange (IDX) using the
Discounted Cash Flow (DCF) method with a Flow
to Firm Free Cash (FCFF) approach and Relative
Assessment. The results of this study indicate that
the DCF method with the FCFF approach in an
optimistic scenario TLKM fair value is undervalued,
the fair value of ISAT is overvalued and the EXCL
fair value is undervalued. Then in the moderate
scenario, the fair value of TLKM is undervalued, the
fair value of ISAT is overvalued and the EXCL fair
value is overvalued. Furthermore, in a pessimistic
scenario, TLKM's fair value is overvalued, ISAT's
fair value is overvalued and EXCL's fair value is
overvalued. As for using the relative valuation with
the PER approach, TLKM's fair value is
undervalued, ISAT's fair value is overvalued and
EXCL's fair value is considered undervalued. Then
Oil and Gas Companies and Their Fair Value: Evidence from Indonesia Stock Exchange
109

with the PBV approach, TLKM's fair value is
overvalued, ISAT's fair value is overvalued and
EXCL's fair value is undervalued. Furthermore, with
multiple EBITDA approaches, TLKM fair value is
overvalued, ISAT fair value is considered
undervalued and EXCL fair value is considered
undervalued.
Augustyniak, Laszek, Olszewski, and Waszczuk,
(2018) explain that the study aims to describe the
method of valuation of property applied in Poland.
The valuation method is explained and assessed
critically, indicated by potential problems. Loan risk
analysis is analyzed on data about non-performing
loans (NPL). The Polish valuation method is in line
with international methods, but there are several
risks, such as a small number of transactions, the
subjective behavior of the assessor. A low NPL ratio
indicates that the assessment works correctly.
Zemba and Hendrawan (2018) stated that in his
research explained that the business investment
opportunity of the health sub-sector in Indonesia is
still wide open, because the capacity of all hospitals
in Indonesia is only able to serve 3.25% of the total
potential patients, there is still a 96.75% potential
market that equivalent to 9,501,350 customers.
Some companies that invest in the health care
business in Indonesia, there are MIKA, SAMA,
SILO, and SRAJ, all of which will be evaluated
using DCF and Relative Assessment. This research
is intended to search the fair value of the company.
This assessment reveals how well each company
makes more money in the future. Valid for all
companies, especially those in services such as
hospitals, good ratings are very sensitive, once
customers are exposed to a large scale to an event
that decreases the company's rating then to restore
fair prices takes a long time. Can be seen in a
hospital whose value is undervalued.
2.1 Discounted Cash Flow with the
FCFF approach
Discounted Cash Flow Valuation is to find the value
of an asset based on the cash flow that will be
generated in the future, where with the FCFF
approach, cash is available to the capital provider or
company funds, namely shareholders and bonds
after the company conducts operations and
investment activities. According to Damodaran
(2006) said that Free Cash Flow to Firm (FCFF) is
all the sum of all cash flow for all company owners.
The following formulas from FCFF are as
follows:
(2.1)
Determining the discount rate requires an in-
depth analysis of the company's financing structure
and current market conditions. Neaxie and
Hendrawan, (2017) suggest that the discount rate is
the expected return by investors and creditors on
funds invested in the company. The discount rate
used for FCFF discounts is called the weighted
average cost of capital (WACC). The company
value will be obtained with the following formula :
t
t
t
(2.2)
Where :
FCFF = Free Cash Flow to Firm
WACC = Weighted average cost
After determining the present value of the cash
flows obtained from the time period and certain
scenarios and also from the terminal value
discounted for the present value. Then the two
present values are then added together to give the
company value or equity value. The formula used to
calculate the value of a company using the Flow to
Firm Free Cash, whose growth has stabilized in a
given year, and after that it grows constant at the
perpetual growth rate of “g”, which is as follows:
t
t
t
+
n
(2.3)
TV = FCFF
n+1
/ (WACC - g) (2.4)
Where :
FCFF = Free Cash Flow to Firm
WACC = Weighted average cost
TV = Terminal Value
Terminal Value (TV) is the present value of all
future cash flows obtained after a period of time
determined by scenario analysis which is easier to
predict by assuming a constant growth rate for a
period of time, where the perpetual growth rate is
symbolized by g. The cost of capital or the overall
capital cost of a company reflects the cost
combination of all funding sources used by the
company. Furthermore, the overall capital cost is
called the Weighted Average Cost of Capital
(WACC). According to Damodaran ( 2006)
explained that Cost of Capital is generally calculated
based on a weighted average, or in financial
terminology often referred to as a balanced average
ICIB 2019 - The 2nd International Conference on Inclusive Business in the Changing World
110

capital cost, WACC is the average after-tax cost of
each source of capital used by a company to finance
a project. WACC is one of the important factors in
the calculation using the Discounted Cash Flow
(DCF) model. Minor changes to the WACC will
result in major changes in company value. The
WACC is calculated by weighting the source of
capital according to the company's financial
structure and then multiplying them at their expense.
WACC = (Composition of Equity*rate of equity) +
((Composition of Debt*rate of debt)*(1-tax)) (2.5)
2.2 Relative valuation with PER and
PBV approaches
Relative Valuation is one of the most commonly
used valuation methods by comparing companies
that are similar or with the industry in which the
company is located. Market prices are obtained by
relative valuation, as a result of using real data
during the analysis. The tool used to do Relative
Valuation is multiples. One form of multiples is
price multiples, where the main component of price
multiple is the market price. Some examples of price
multiples include Price Earning Ratio (PER), Price
Book Value (PBV), Multiple EBITDA.
According to Damodaran (2006), the advantages
of the Relative Valuation model are also
weaknesses. First, ease in Relative Valuation can be
put together, pulling together some similar groups of
companies, can also produce inconsistent estimates
of value where key variables such as risk, growth, or
potential cash flows are ignored. Second, the fact
that multiples reflect the market atmosphere also
illustrates that using the Relative Valuation method
to value an asset can produce a value that is too high
when the market overestimates similar companies or
vice versa is too low when the market
underestimates similar companies. Third, there is
room for bias in all valuation methods, the lack of
transparency regarding the underlying assumptions
in the relative valuation method makes it vulnerable
the manipulation.
2.2.1 Approach to Price Earning Ratio
(PER)
Another alternative in valuation to calculate the
intrinsic value of a stock or fundamental value is to
use the profit value of the company (earnings).
Estimates of the intrinsic value of shares in company
analysis can be done using two important
information components of the company, namely
earnings per share and earnings multiplier or in other
words the expected function of EPS and the amount
of PER of the company's shares are the intrinsic
value of a stock. The formula for determining the
intrinsic value of stock through Price Earning Ratio
is as follows (Copeland, 2000):
Po = Estimation EPS x PER (2.6)
Where :
Po = Intrinsic Value of Shares
EPS = Earning Per Share
PER = Price Earning Ratio
2.2.2 Approach to Price to Book Value
(PBV)
One alternative approach to determine the value of a
stock with the Relative Valuation method is to use
the relationship between stock market prices and
book value per share. Theoretically, the market
value of stock must describe the value of the book.
The formula for Price Book Value (PBV), namely:
PBV = Po/BV (2.7)
Where :
Po = Stock Price (Equity Value)
BV = Book Value of Equity
2.3 Framework of Thinking
The best solution to anticipate uncertainty about
changes in stock prices is to conduct a fundamental
analysis of valuing the intrinsic value of the stock. In
analyzing this valuation based on the assumptions
and projections of the company's conditions in the
future. This research is limited by using company
historical data from 2013 to 2017 as a basis for
projections. Next, the projection is done to
determine the future cash flow and its present value.
According to Neaxie and Hendrawan (2017), the
analysis of stock valuation calculations using the
Discounted Cash Flow (DCF) method requires
assumptions and projections to determine the
condition of the company to generate free cash flows
in the future and then calculate the present value.
Determination of assumptions and projections needs
to be adjusted to certain scenarios because of
uncertainty about the condition of the company in
the future. So on this basis, this study uses three
scenario conditions, namely optimistic conditions,
moderate conditions, and pessimistic conditions. An
optimistic condition is a condition that is considered
as the highest growth condition of the company and
Oil and Gas Companies and Their Fair Value: Evidence from Indonesia Stock Exchange
111
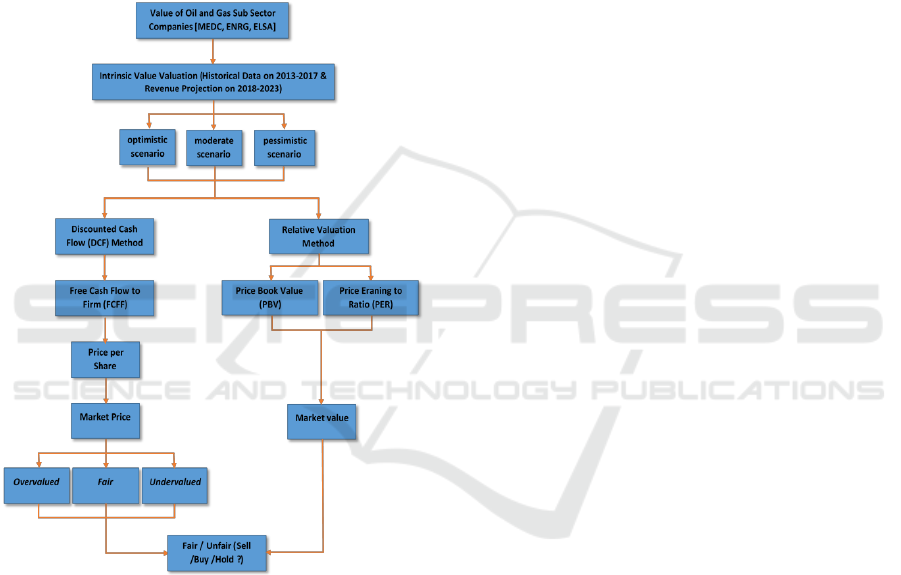
seen from the difference in industry growth and the
target of company management (above the industry
growth average). Moderate conditions are conditions
where the most likely to occur is seen from the
fundamental conditions of the company (the most
likely conditions). Whereas the pessimistic condition
is the condition where the condition of the company
is the worst. The final process of valuation with the
Discounted Cash Flow (DCF) method is to obtain
equity value or as an intrinsic value of the company
which then gets intrinsic value per share in each
condition scenario. The research framework is
presented in Figure 2.1 below:
Figure 2.1: Framework of Thinking.
3 RESEARCH METHODOLOGY
The type of research used is verification research
with quantitative methods that aim to explain the
existing phenomena by using numbers, namely
valuation to obtain the intrinsic value of shares of
companies engaged in the oil and gas sub-sector
business in Indonesia which is listed on the
Indonesia Stock Exchange with research variables
used in this study is the intrinsic value of shares
based on the fundamental value of the company.
Then the variables will be calculated using the
Discounted Cash Flow method FCFF approach and
Relative Valuation with the PER and PBV technique
approaches.
The population taken is all shares of the oil and
gas sub-sector company on the IDX, while the data
sample uses a purposive sampling technique which
is the three major oil and gas sub-sector companies
that have the largest market value listed on the JCI
index and still have active transactions until 2018,
namely Medco Energi Internasional, Tbk (MEDC);
PT. Energi Mega Persada, Tbk (ENRG); and PT.
Elnusa, Tbk (ELSA). The data source in this study
uses secondary data, namely five-year historical data
in the form of annual reports and financial reports
which are object research sourced from IDX.com,
the investment world, and the object's official
website research.
Research procedures are steps or sequences that
must be passed or worked on in a study. This needs
to be done in order to be able to answer the research
questions and research objectives achieved. The
research procedures that need to be carried out are as
follows:
a. Defining and formulating problems (related to
phenomena and defining variables in the
formulation of the problem)
b. Conduct library studies (theories that support
research and also refer to references from
previous studies)
c. Determine the research model and design (what
models and methodologies will be used in the
study)
d. Collecting the company's secondary data (in the
form of historical data on financial statements
and company annual reports)
e. Processing and presenting information
(historical processing data as a projection basis,
which is processed by mathematical
formulation)
f. Analyze and interpret data (analyze results data
that has been processed based on literature)
g. Conclusions and suggestions (conclusions from
the results of data analysis research that has
been done, and provide recommendations on
recommendations based on the conclusions)
The research method is an attempt to find,
develop and test the truth of a knowledge, which
business is carried out using scientific methods. The
data analysis method is the most important thing in
the study. Without data analysis, the validity of a
study is still in doubt. Because with data analysis,
the research will produce accurate research results.
Determining the method of analyzing data in a study
is a mandatory thing, and its determination is based
ICIB 2019 - The 2nd International Conference on Inclusive Business in the Changing World
112

on the type of research conducted. The results of the
study are strongly influenced by an analytical
method. If the method used is in accordance with the
object of research, the results will be acceptable.
Whereas if it is not appropriate, then the research is
considered to be a failure. Therefore, when
conducting a study, you must consider the object of
research and determine the method to be used in data
analysis. Data analysis can be said as an ongoing
process in research, with initial analysis informing
data that is then collected. In this study, the author
will use the Discounted Cash Flow method with the
Flow to the Firm Free Cash (FCFF) approach and
the Relative Valuation method with the Price
Earning to Ratio (PER) and Price Book Value
(PBV) approaches.
4 RESEARCH AND DISCUSSION
4.1 Intrinsic Value using Discounted
Cash Flow - FCFF
Historical data used in this study is from the
company's financial statements for 2013-2017 which
will serve as the basis for calculating the free cash
flow. The projection for obtaining free cash flow to
the firm is based on the calculation of the historical
averages of 2013 - 2017 which are locked as the
basis for projections for 2018-2022. where the
spread growth results for MEDC companies are
5.55%, ENRG has 1.92%, and ELSA is 5.26% with
historical industry growth of 1.12%. In the
calculation of the spread of the company's historical
growth, the difference between the average historical
growth of the company and the historical average
growth of the industry, where spread growth results
for MEDC companies are 5.55%, ENRG has 1.92%
and ELSA worth 5.26% with historical growth
amounting to 1.12%.
In the Sales Projection analysis, the value of
industrial growth will be projected first for 2018-
2022, as the basis for other projected components
such as EBIT and FCFF projection. The type of
projection used is the type of single moving
averages, which is a projection method carried out
by taking a group of values of observations, looking
for the average value as a forecast for the period to
come, and using the following formula:
M
t
F
t+1
=
t
+Y
t-1
+Y
t-2
+…+Y
t-n+1
(4. 1)
Where :
Mt = period moving average t
Ft + 1 = year period forecast t + 1
Yt = Actual value for year period t
n = number of moving average limits
From the results of the forecasting analysis, the
industry average growth value of 5.38% is obtained,
which will then be used as the reference basis for
calculating each company's projected growth
(MEDC, ENRG, ELSA) according to the calculation
scheme in optimistic, moderate or pessimistic
scenarios.
In the optimistic scenario, the calculation of the
company's growth projection is the sum of the value
of industry growth projection coupled with the
historical growth spread and subsequently added
another half of the historical growth spread. As for
MEDC companies, the value of the calculation
results for growth projections in the optimistic
scenario is 13.71%, ENRG is 8.26%, and ELSA has
13.26%.
For the moderate scenario, the calculation of the
company's growth projection obtained from the sum
of the growth value of industry projections is added
by the historical growth industry spread only, so that
MEDC companies value the moderate scenario
growth projection of 10.93%, ENRG has 7.30% and
ELSA worth 10.64 %.
Whereas in the pessimistic scenario, the
calculation of the company's growth projection is
assumed to be the same as the value of the growth
industry projection, so that for the three MEDC,
ENRG companies, ELSA growth projection in the
pessimistic scenario is 5.38%.
Furthermore, the value of the growth projection
will be the basis for determining other projected
values for EBIT, Depreciation, and Amortization,
Capex and Networking Capital parameters which
will then produce FCFF values, Value Terminals,
Enterprise Value, Equity Value, Fair Value and EAT
value (net income). Through the results of
processing and analyzing the overall data of stock
valuations using the Discounted Cash Flow method,
the fair value of shares for each company is
obtained, as presented in Table 4.1 as follows:
Oil and Gas Companies and Their Fair Value: Evidence from Indonesia Stock Exchange
113

Table 4.1: Value of Fair Price Calculation Results
Company Shares DCF-FCFF method.
Firm
Scenario
Fair
value
Price
per 2-
Jan-
2019
Condition
MEDC
Pessimistic
344
720
overvalued
Moderate
740
720
undervalued
Optimistic
962
720
undervalued
ENRG
Pessimistic
16
50
overvalued
Moderate
59
50
undervalued
Optimistic
81
50
undervalued
ELSA
Pessimistic
368
336
undervalued
Moderate
434
336
undervalued
Optimistic
470
336
undervalued
Based on Table 4.1, it is known that MEDC's
stock price on January 2, 2019, is IDR 720, which
means that MEDC's price condition compared to its
fair price (intrinsic value) uses the Discounted Cash
Flow method on pessimistic growth (5.38%) is
overvalued, moderate (10, 93%) are undervalued,
and optimistic (13.71%) are undervalued. This
means that MEDC is in a good performance and
fundamental performance and can show significant
growth, so MEDC still has the potential to rise and
reach its fair value because most MEDC valuation
results show undervalued. As an investment
decision, MEDC shares with fundamental conditions
and good growth can be purchased by prospective
investors in accordance with the calculated intrinsic
value
Then in the ENRG company, the market share
price per January 2, 2019, is IDR 50, which means
that ENRG's share price compared to its intrinsic
value using the Discounted Cash Flow method on
pessimistic growth (5.38%) is overvalued, moderate
(7.30%) at undervalued, and optimistic (8.26%) is
undervalued. This indicates that ENRG in
performance and fun performance is quite good and
shows significant growth, and ENRG shares still
have the potential to rise and reach its fair value. As
an investment decision, ENRG shares can be
purchased by prospective investors in accordance
with the target value of the fair price that has been
calculated.
Furthermore, for ELSA’s company, the market
share price per January 2, 2019, is IDR 336, then
this means that ELSA stock prices, when compared
to the fair price using the Discounted Cash Flow
method on pessimistic growth (5.38%) are
undervalued, moderate (10.64%) under conditions
that are undervalued, and optimistic (13.26%) which
means undervalued. This shows that ELSA is in a
good performance and fundamental performance, as
well as showing good growth as well, so ELSA
shares still have the potential to rise and reach its
fair value. As an investment decision, ELSA shares
can be purchased by prospective investors in
accordance with the calculated fair price value.
4.2 Intrinsic Value using Relative
Valuation – PER and PBV
In addition to using the Discounted Cash Flow
method with the Free Cash Flow to Firm (FCFF)
approach, the valuation calculation is also done by
the Relative Valuation method with the PER and
PBV approaches. Based on the results of calculation,
processing, and analysis of overall stock valuation
data using the Relative Valuation PER and PBV
approach, intrinsic value is obtained for the three oil
and gas companies MEDC, ENRG, and ELSA using
a pessimistic, moderate and optimistic scenario,
which are presented in Table 4.2 and range values
the PER-PBV ratio in IDX Q1-2018 market is
presented in Table 4.3 below:
Table 4.2: Value of Intrinsic Calculation Results Company
with RV-PER and PBV method.
Firm
Scenario
Intrinsic
value
PER
Intrinsic
value
PBV
MEDC
Pessimistic
2.42
4.35
Moderate
5.22
9.36
Optimistic
6.78
12.15
ENRG
Pessimistic
0.13
1.76
Moderate
0.46
6.41
Optimistic
0.63
8.83
ELSA
Pessimistic
6.59
0.88
Moderate
7.78
1.04
Optimistic
8.43
1.12
Table 4.3: Value of the oil and gas sector PER-PBV
Range Ratio in Market IDX Q1-2018.
The range of PER-PBV Ratio for the Migas Sector
at IDX Q1-2018
Category
PER
PBV
Average
Firm
22.07
Firm
2.08
The lowest
PKPK
-11.84
ARTI
0.22
The highest
ESSA
127.93
APEX
8.62
ICIB 2019 - The 2nd International Conference on Inclusive Business in the Changing World
114

The results showed that the three oil and gas
companies, namely MEDC, ENRG, and ELSA with
overall scenarios both pessimistic, moderate and
optimistic, possessed PER and PBV values which
were still in the market ratio range PER and PBV
values according to market data contained in IDX
data in the Quarter-1 2018, where the lowest PER
value in the company PT. Perdana Karya Perkasa
Tbk. (PKPK) of -11.84 times and the highest PER
value in PT. Surya Eka Perkasa Tbk. (ESSA) of
127.93 times, while for the lowest PBV value at PT.
Ratu Prabu Energi Tbk. (ARTI) of 0.22 times and
the highest PBV value in PT. Apexindo Pratama
Tbk. (APEX) of 8.62 times.
Besides that, it shows that with the calculation
results using the RV PER-PBV method which is still
in line with the range market, the assumption that is
built on the valuation processing analysis based on
the first method, Discounted Cash Flow with the
FCFF approach is fulfilled, because in the PER
calculation and This PBV, one of the most important
components, is the value of earnings data from one
of the final results of the DCF method calculation,
namely in the form of net income value or EAT
(Earning After Tax).
Based on the explanation of the three scenarios,
it is recommended for investors to buy ENRG shares
if they use the PER approach because they are
cheaper than MEDC and ELSA, and can also buy
ELSA shares if they use the PBV approach because
the price is cheaper than MEDC and ENRG.
5 CONCLUSION AND
RECOMMENDATION
5.1 Conclusion
The results of this study indicate that the fair value
of shares using the Discounted Cash Flow method in
the pessimistic scenario, namely MEDC for IDR 344
under overvalued conditions, ENRG worth IDR 16
under overvalued conditions, and ELSA at IDR 368
under undervalued conditions. Then in the moderate
scenario for MEDC, IDR 740 was in an undervalued
condition, ENRG was IDR 59 under undervalued
conditions, and ELSA was IDR 434 under
undervalued conditions. Furthermore, on the
optimistic scenario of IDR 962 valued at
undervalued conditions, the IDR 81 ENRG was
undervalued, and the IDR 470 ELSA was
undervalued.
The Relative Valuation method with the PER
and PBV approaches shows that with all calculation
scenarios both pessimistic, moderate and optimistic,
the three oil and gas companies MEDC, ENRG and
ELSA have PER and PBV values that are still in the
market ratio PER and PBV according to the data
IDX in Quarter-1 2018, where the lowest PER value
was -11.84 times in PKPK companies, and the
highest PER was valued at 127.93 times for ESSA
companies, while for the lowest PBV value was 0.22
times for the highest ARTI and PBV companies
worth 8.62 times in the APEX company.
As an investment decision, it is theoretically
recommended to buy shares under the intrinsic
value, investors can buy shares if they are in an
undervalued condition, where in this case for the
DCF-FCFF method it is advisable to choose a
moderate scenario because of the most likely
conditions of the company's growth, the market
condition value is close to its fair value, so the
shares for MEDC, ENRG, and ELSA companies are
worth buying in this condition. Then on the RV
PER-PBV method with the three pessimistic,
moderate and optimistic scenarios, then for the PER
approach, the ENRG share price is cheaper than
MEDC and ELSA, whereas in the PBV approach,
ELSA stock prices are cheaper than MEDC and
ENRG.
5.2 Recommendation
Based on these conclusions, the researcher makes
suggestions that can be used as a reference basis for
further writing, where in writing this study is
expected to be able to provide benefits or can
contribute to those in need, among others,
theoretically, this research is expected to be an input
regarding implementation and use of valuation
theory, especially the assessment of the intrinsic
value of shares and the clearer value of stock
projections, and is expected to be a reference and
illustration for future research. While practically, for
the company itself, this research is expected to
provide input for oil and gas sub-sector companies
in increasing the value of the company through
improved performance so that the value of shares in
the market can reflect its fair value and investors,
this research is expected to provide information to
investors that stock prices are reasonable and
intrinsic value of shares that can be used to support
investment decisions.
In evaluating a valuation, it depends on the data
and assumptions used. Appropriate data cleaning
needs to be done as in other income data, interest
Oil and Gas Companies and Their Fair Value: Evidence from Indonesia Stock Exchange
115

containing debt that does not occur overvalued,
while in making projected assumptions here, the
author uses the type of assumption from one single
moving average projection, so the researchers can
then use the projection assumption others are more
complete, and it is expected that the data will be
more accurate. In addition, you can also add other
valuation methods such as contingent claims,
discounted dividend model methods, etc.
Stock prices are always fluctuating, and the
amount of sentiment information circulating in the
market becomes something that is uncertain and
very risky for investors. Therefore investors should
pay attention to the target price, and they must also
pay attention to the fundamental conditions and
company performance as comparative information in
making decisions. As an investment decision, it is
theoretically recommended to buy shares under the
intrinsic price, in this case, investors can buy shares
if they are undervalued and sell them in overvalued
conditions.
To maintain and increase stock prices in the
market, companies must not only improve the
performance of companies with income, companies
must also consider the costs and expenses of
companies both OPEX and CAPEX in this case the
company must do a program of costs & expenses
that burden the company.
REFERENCES
Augustyniak, H., Laszek, J., Olszewski, K., Waszczuk, J.,
2018. Property Valuation for Mortgage Purposes in
Poland. Property Management, Vol. 36 Issue: 2,
pp.234-247.
Damodaran, A., 2006. Damodaran on Valuation second
edition, United States of America: John Wiley & Sons
Inc.
Copeland, T., Koller, T., Murrin, J., 2000. Valuation
Measuring and Managing The Value of Companies on
Third Edition, United States of America: John Wiley
and Sons Inc.
Neaxie, L.V., Hendrawan, R., 2017. Stock Valuations in
Telecommunication Firms: Evidence from Indonesia
Stock Exchange. Journal of Economic and
Management Perspectives, Volume 11, Issue 3.
Russel, M., 2016. The Valuation of Pharmaceutical
Intangibles. Journal of Intellectual Capital, Vol. 17 Iss
3 pp. 484 – 506.
Sim, T., Wright, R.H., 2017. Stock Valuation Using the
Dividend Discount Model: An Internal Rate of Return
Approach. In Growing Presence of Real Options in
Global Financial Markets. Published online: 30 Nov
2017; 19-32.
Tiwari, R., Singla, H.K., 2015. Do Combining Value
Estimates Increase Valuation Accuracy? Evidence
from Indian chemical industry. Journal of Accounting
in Emerging Economies, Vol. 5 Iss 2 pp. 170 - 183
Valcic, S.B., Stumpf, B.C., Katunar, J., 2013. Business
Valuation in Oil and Gas Industry: New Challenges.
MIPRO 2013, May 20-24, 2013, Opatija, Croatia.
Zemba, S, Hendrawan, R., 2018. Does Rapidly Growing
Revenues Always Produce An Excellent Company’s
Value? DCF & P/E Valuation Assessment on Hospital
Industry. Journal e-Proceeding of Management:
Vol.5, No.2 Agustus 2018 | Page 2045.
Zhang, T.W.T., 2015. The Roles of Accounting Data in
Equity valuation: Evidence from China. China
Finance Review International, Vol. 5 Iss 1 pp.
ICIB 2019 - The 2nd International Conference on Inclusive Business in the Changing World
116
