
The Effectiveness of the Indonesia Stock Exchange's Marketing
Communication Program: Yuk Nabung Saham
Rheza Andhika Pamungkas and Martani Huseini
Department of Communication Science, Universitas Indonesia, Depok, Indonesia
Keywords: Effectiveness, Integrated Marketing Communication, Brand Equity, Indonesia Stock Exchange, Capital
Market.
Abstract: To improve the Indonesian capital market literacy and increase the number of Indonesian capital market
investors, on 12th November 2015 The Indonesia Stock Exchange (IDX) launched a campaign program called
"Yuk Nabung Saham". This research aims to determine the effectiveness of the IDX’s Yuk Nabung Saham
Program.
1 INTRODUCTION
To improve the Indonesian capital market literacy and
increase the number of Indonesian capital market
investors, on 12th November 2015 The Indonesia
Stock Exchange (IDX) launched a campaign program
called "Yuk Nabung Saham". The purpose of this
program is to change the paradigm of the Indonesian
society from saving society to investment society and
encourage people from various groups to invest their
funds regularly as deposits in the form of shares. The
IDX marketing strategy through the Yuk Nabung
Saham campaign, as quoted from the 2015 IDX
Annual Report, is one of the four main pillars in the
strategic plan and the long-term tactical steps set by
the IDX Board of Directors, namely an increase in the
number of active investors.
Effectiveness is needed by the organization to
determine the level of success of the organization in
an effort to achieve its goals and objectives.
Effectiveness is a concept that has a broad
understanding because the achievement of goals or
objectives for an organization certainly involves all
aspects of the organization, both internal and external,
and not only limited to parts of the organization
related to the process of transforming inputs into
output only (Hari Lubis and Huseini, 2009). In order
for the marketing strategy - in this case The Yuk
Nabung Saham campaign strategy - can run
effectively, it requires the development and
implementation of various forms of persuasive
communication programs to a sustainable audience
called Integrated Marketing Communication (Shimp,
2003). The IDX's integrated marketing
communication strategy was introduced to the public
using The Yuk Nabung Saham brand. This program
invites the public to open a securities account at a
securities company and become a capital market
investor on the IDX with only an initial capital of
Rp100.000 used to buy shares of the Listed Company.
The IDX claimed that this program was effective to
increase the number of Indonesian capital market
investors. However, with some of the achievements
of the IDX in developing the capital market in terms
of the number of investors, currently the number of
capital market investors is still small compared to the
number of the middle class or consumer classes that
are considered capable and targeted by prospective
investors.
2 OBJECTIVE OF THIS STUDY
This study aims to: (1) Find out the IDX’s Yuk
Nabung Saham program has been running effectively,
(2) knowing the effectiveness of the IDX’s marketing
communication strategy in shaping brand equity from
the Yuk Nabung Saham campaign, especially on the
target population, and (3) knowing the relationship
and connectivity between marketing communication
strategies and brand equity from Yuk Nabung Saham
IDX.
208
Pamungkas, R. and Huseini, M.
The Effectiveness of the Indonesia Stock Exchange’s Marketing Communication Program: Yuk Nabung Saham.
DOI: 10.5220/0008429402080217
In Proceedings of the 2nd International Conference on Inclusive Business in the Changing World (ICIB 2019), pages 208-217
ISBN: 978-989-758-408-4
Copyright
c
2020 by SCITEPRESS – Science and Technology Publications, Lda. All rights reserved
3 RELEVANT CONCEPT AND
THEORIES
This study uses two main theories to examine the
effectiveness of marketing communication from the
IDX's Yuk Nabung Saham program. The first theory
is the Mix of Integrated Marketing Communication
Promotion from Belch and Belch (2003), and the
second theory is Brand Equity introduced by Aaker
(2017).
Belch and Belch (2007) in the journal of Shafi &
Madhavaiah (2013) define integrated marketing
communication as a strategic business procedure that
was used to carry out, evaluate, develop and
coordinate programs with stakeholders over a period
of time. Belch and Belch (2003) state that
traditionally the promotion mix includes four
elements: advertising, sales promotion, publicity/
public relations, and personal selling. However, direct
marketing and interactive marketing are seen as the
main promotional mix elements that modern
marketers use to communicate with their target
audience. Each element of the promotion mix is seen
as an integrated marketing communication tool that
plays a special role in the Integrated Marketing
Communication program. Each can consist of various
forms and certain advantages.
Related to the second theory that used in this study
- Brand Equity, Aaker (2017) defines brand equity as
a set of brand assets and liabilities relating to a brand,
its name and symbol, which increases or decreases the
value provided by an item or service company or
company customers. Brand equity was grouped into
five categories namely brand loyalty, brand
awareness, brand's perceived quality, brand
associations, and other brand assets: patents, stamp,
relationship channels and others.
The focus of this study is on the using of the
integrated marketing communication as a brand
strategy in increasing brand equity, which refers to
the research of Mongkol (2014) and Brunello (2013)
that are adapted to the situation and condition of the
object of this research, The IDX's Yuk Nabung
Saham program. The reason for referring to the two
studies is based on the finding that Integrated
Marketing Communication has far more significant
value than just attracting consumers to buy products
or services from certain companies, but also
contributes to the development of corporate brand
equity, as well as proof of the correlation between
communication integrated marketing and brand
equity in a beverages company in Thailand. This
study would like to see what if we examine the
correlation between integrated marketing
communication strategies carried out by the company
(in this case: The IDX) and its effectiveness towards
the formation of brand equity from service products
in an industry that is in the capital market industry in
Indonesia.
4 RESEARCH FRAMEWORK
AND THEORETICAL
HYPOTHESES
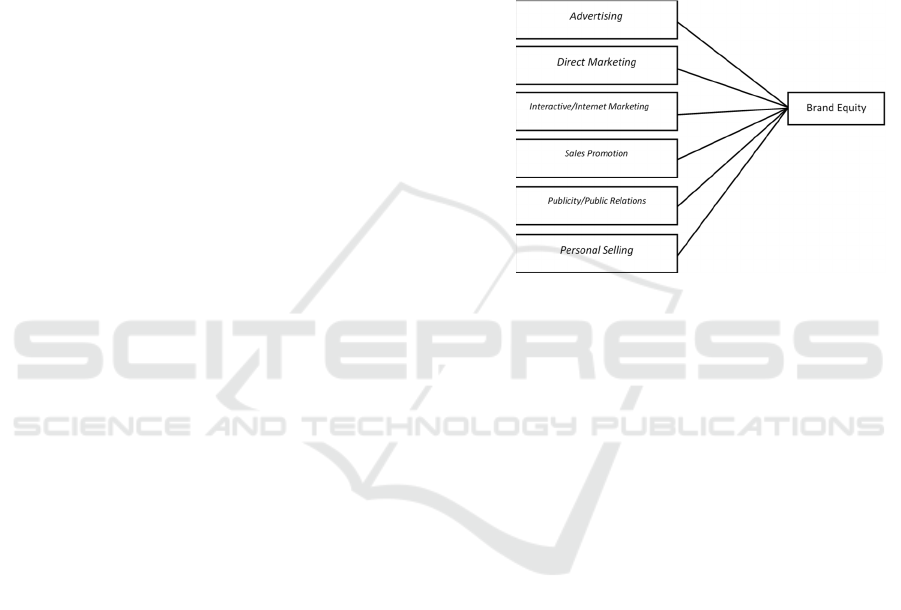
Figure 1: Framework.
Based on the research framework as figure 1, the
theoretical hypotheses of this study are:
H1: Advertising significantly influence Brand
Equity.
H2: Direct Marketing significantly influence
Brand Equity.
H3: Interactive Marketing/ Internet Marketing
significantly influence Brand Equity.
H4: Sales Promotion significantly influence
Brand Equity.
H5: Publicity/ Public Relations significantly
influence Brand Equity.
H6: Personal Selling significantly influence
Brand Equity.
5 METHODOLOGY
5.1 Population and Samples
The population of this study was the Capital Market
School participants in Jabodetabek during the period
of October 2018. IDX holds regular Capital Market
Schools in the Jabodetabek area 3 times each week.
Assuming the average number of participants of the
Capital Market School is 40 people per event, the
population of this study is 480 people. This study uses
The Effectiveness of the Indonesia Stock Exchange’s Marketing Communication Program: Yuk Nabung Saham
209

a probability sampling technique with a simple
random sampling technique. There are various
techniques for determining sample size.
According to Sugiyono (2015) there is a table for
determining the number of samples from a particular
population developed by Isaac and Michael to
calculate errors of 1 percent, 5 percent, and 10
percent. Referring to the tables of Isaac and Michael
(Sugiyono, 2015) the determination of the number of
samples of this study was applied by for a population
of 480 people with a 5 percent margin of error, the
samples were 202 respondents.
5.2 Measurement Scale of Respondents
The measurement scale of this study uses a Likert
scale. To reduce the tendency of respondents to
choose neutral answers, the researcher collects and
processes the data obtained from the questionnaire by
making the answers even and giving the weight
values for each question based on the scale as follows:
1) Strongly Agree (SA): Scale 4.
2) Agree (A): Scale 3.
3) Disagree (D): Scale 2.
4) Strongly Disagree (SD): Scale 1.
5.3 Validity and Reliability Test
This study uses a validity test using Pearson Product
Moment correlation. The reason for using this
analysis technique is because according to Gogtay
and Thatte (2017), the Pearson correlation coefficient
establishes the relationship between two variables
based on three assumptions:
1. Relationships are linear
2. Variables do not depend on each other.
3. Variables are normally distributed.
Pearson Product Moment correlation analysis uses a
method of correlating each item score with a total
score. The total score is the sum of all items. The
question items that correlate significantly with the
total score indicate that these items are able to provide
support in revealing that the significance level (α) of
this study is valid. If the r count is greater than (≥) r
table, the instrument or question items correlate
significantly to the total score so that the item is
declared valid. Whereas if r count is less than (≤) r or
r count is equal to (=) r table, then the item under
study is said to be invalid.
The reliability test of this study uses Cronbach
Alpha (α) calculations. According to Tavakol and
Dennick (2011), the number of test items, the
relevance of items and dimensions affects alpha
values. From a variety of research and research,
acceptable alpha values range from 0.70 to 0.90. Low
alpha values can be caused by a number of low
questions, weak interrelationships between items, or
heterogeneous constructs. While the maximum
recommended alpha value is 0.90 so that reliability is
considered perfect and suggest all items are reliable
and all tests consistently have strong reliability.
6 DATA ANALYSIS
The method of data analysis in this study uses
descriptive statistics. According to Neuman (2013),
descriptive statistics are a general type of simple
statistics to explain the basic patterns in data. This
study also uses factor analysis to create a single score
that represents the diversity of indicators or item
questions in linear regression analysis. To obtain an
acceptable factor score it is necessary to examine
factor analysis such as a loading factor above 0.50,
KMO above 0.50, and a significance test for Bartlett's
test.
Other tests used for data analysis in this study are
several classic assumption tests such as
multicorrelation test, Homocystaticity/
Heterocedasticity test, normality test with Chi Square
test and Kolmogorov-Smirnov test, multiple linear
regression analysis, T test or partial test, and F test or
Simultaneous Test.
7 RESEARCH HYPOTHESIS AND
STATISTICAL HYPOTHESIS
The research hypothesis is as follows:
1. hypothesis of the relationship between advertising
variables and brand equity. The higher the
credibility of advertising variables, the effect on
brand equity will also be higher, and vice versa if
the credibility of the advertising variable is low,
the brand equity formed will also be low.
2. hypothesis of the relationship between direct
marketing variables and brand equity. The higher
the credibility of the direct marketing variable, the
higher the effect on brand equity, and vice versa
if the credibility of the direct marketing variable
is low, the brand equity formed will also be low.
3. The hypothesis of the relationship between
interactive marketing (internet / marketing) and
brand equity. The higher the credibility of
interactive marketing variables, the higher the
ICIB 2019 - The 2nd International Conference on Inclusive Business in the Changing World
210

effect on brand equity, and vice versa if the
credibility of the interactive marketing variable is
low, the brand equity formed will also be low.
4. Hypothesis of the variable sales promotion (sales
promotion) with brand equity. The higher the
credibility of the sales promotion variable, the
higher the effect on brand equity, and vice versa
if the credibility of the sales promotion variable is
low, the brand equity formed will also be low.
5. Hypothesis of the relationship between public
relations / public relations with brand equity. The
higher the credibility of public relations variables,
the higher the effect on brand equity, and vice
versa if the credibility of the variable public
relations is low, the brand equity formed will also
be low.
6. Hypothesis of personal selling relationships
(personal selling) with brand equity. The higher
the credibility of the personal sales variable, the
higher the effect on brand equity, and vice versa
if the credibility of the personal sales variable is
low, the brand equity formed will also be low.
The statistical hypothesis of this study uses the
calculation of the F statistical test and the T statistical
test to formulate the null hypothesis (H0) and the
alternative hypothesis (Ha), test the hypothesis, and
draw conclusions.
7.1 Statistic F Test
The F statistic test is used to show whether all the
independent variables entered into the model have a
joint influence on the dependent variable. The null
hypothesis (H0) that is to be tested in this study is
whether all the parameters in the model are zero, or:
H0: b1 = b2 = 0 (1)
The meaning is that whether all independent variables
are not a significant explanation of the dependent
variable. The alternative hypothesis (Ha) is not all
parameters simultaneously equal to zero, or:
Ha: b1 ≠
b
2 ≠ 0 (2)
The testing criteria are:
a. If F Count ≤ F Table, then H0 is accepted as
meaning not significant.
b. If F Count> F Table, then H0 is rejected and Ha is
accepted, meaning significant.
7.2 Statistic T Test
The T Statistic test is used to test whether the
correlation coefficient (r) has been determined
significant/ meaningful or not before determining /
concluding the results of the research. The
significance level used in this study is two-way at
degrees 0.05 or α = 0.05. The null hypothesis (H0) to
be tested is whether a parameter (bi) equals zero, or:
H0: bi = 0 (3)
The meaning is whether an independent variable is
not a significant explanation for the dependent
variable. The alternative hypothesis (Ha) is that the
parameter of a variable is not equal to zero, or:
H0: b1 ≠ 0 (4)
The means that the variable is a significant
explanation of the dependent variable. The statistical
test used per variable is the t test which is calculated
by the test criteria formula as follows:
a. H0 is accepted if t count <t table.
b. H0 is rejected if t count> t table.
8 RESULTS
8.1 Demographic Information
Table 1: Respondents Gender Information.
Gender Number of Respondents Percentage
Male 120 59
Female 82 41
Total 202 100
Table 2: Respondents Age Information.
Age Number of Respondents Percentage
18-25 Years 20 10”
26-30 Years 40 20
31-40 Years” 128” 63”
Over 41 Years” 14 7
Total” 202 100 ”
Table 3: Respondents Education Information.
Education Number of Respondents Percentage
Senior High School or
Equals
12 6
Diploma Degree 6 3
Bachelor’s Degree” 158 78
Master’s Degree 26 13
Total” 202 100
The Effectiveness of the Indonesia Stock Exchange’s Marketing Communication Program: Yuk Nabung Saham
211

Table 4: Respondents Income Information for Savings and
Investments.
Income for savings and
investments (Rupiah Per Month)
Number of
Respondents
Percentage
Under Rp1.000.000 56 28
Rp1.000.000 – Rp2.500.000 73 36
Rp2.600.000 – Rp4.900.000 36 18
Rp5.000.000 – Rp7.000.000 14 7
Over Rp7.000.000 23 11
Total” 202 100
According to the Table 1 – Table 4, the findings
revealed that the majority of respondents were male
(59 percent), aged between 31 – 40 years old (63
percent), holding bachelor’s degree (78 percent), and
spent Rp1.000.000 – Rp2.500.00 for savings and
investments.
8.2 Validity and Reliability Test
Results
Validity analysis was conducted to measure the
validity and feasibility of the questionnaire, to ensure
the validity of the questionnaire. Validity test using
Pearson Product Moment method by comparing r
count and r table. If r count or correlation value is
greater than r table, then the research question is
valid. For the implementation of a validity test of 30
people, then r table is 0.349. The results of the validity
test of this research are:
- The range of the advertising variable r value is
0.606 to 0.724 so it can be concluded that the 8
questions of the questionnaire for the Advertising
variable are valid.
- The range of the direct marketing variable r value
is 0.577 to 0.679 so it can be concluded that the 7
questions of the questionnaire for the Direct
Marketing variable are valid.
- The range of r value for Interactive / Internet
Marketing variables is 0.607 to 0.702 so it can be
concluded that the 9 questions of the
questionnaire for the Interactive / Internet
Marketing variables are valid.
- The range of r value for calculating the Sales
Promotion variable is 0.587 to 0.719 so it can be
concluded that the 4 questions of the
questionnaire for the Sales Promotion variable are
valid.
- The range of the calculated r value in the Publicity
/ Public Relations variable is 0.604 to 0.690 so it
can be concluded that the 4 questions of the
questionnaire for the Publicity / Public Relations
variable are valid.
- The range of the calculated r value on the Personal
Selling variable is 0.678 to 0.725 so it can be
concluded that the 5 questions of the
questionnaire for the Personal Selling variable
questions are valid.
- The range of the calculated r value in the Brand
Equity variable is 0.548 to 0.759 so it can be
concluded that the 21 questions of the
questionnaire for the Brand Equity variable are
valid.
The SPSS software with the Cronbach Alpha method
is used to test the reliability of this research
instrument.
Table 5: Instrument Reliability Test Results.
Variables Cronbach Alpha Value
Advertising 0,886
Direct Marketing 0,860
Interactive/Internet Marketing 0,897
Sales Promotion 0,826
Publicity/Public Relations 0,826
Personal Selling 0,869
Brand Equity 0,841
From a variety of research, an acceptable alpha
values range is from 0.70 to 0.90. While the
maximum recommended alpha value is 0.90, so that
reliability is considered perfect and suggest all items
are reliable and all tests consistently have strong
reliability. From the results of the instrument
reliability test of each variable, the value of Cronbach
Alpha is obtained with a range between 0.826 to
0.897 which indicates that the instrument is very
reliable.
8.3 Factor Analysis Results
The purpose of using factor analysis in this study is to
create a single score that represents the diversity of
indicators or item questions in linear regression
analysis. Each dependent, bound, or free variable
must be represented by a single score, or what is
called in factor analysis as a factor score. The factor
score is a linear combination of the value of the
loading factor which represents the diversity of
question items. The higher the loading factor value,
the higher the level of diversity in creating a factor
score. To obtain an acceptable factor score it is
ICIB 2019 - The 2nd International Conference on Inclusive Business in the Changing World
212
necessary to examine factor analysis such as a loading
factor above 0.50, KMO above 0.50, and a
significance test for Bartlett's test less than 0,05.
Table 6: Loading Factor Analysis, KMO, and Significance
Bartlett’s Test Results.
Variable
Number of
Valid Items
Loading
Facto
r
KMO
Significance
Barlett's Test
Advertising 8
0,704 -
0,807
0,885 0,000
Direct
Marketing
7
0,693 -
0,784
0,890 0,000
Interactive/
Internet
Marketing
9
0,693 -
0,775
0,926 0,000
Sales
Promotion
4
0,760 -
0,859
0,802 0,000
Publicity/
Public
Relations
4
0,774 -
0,838
0,804 0,000
Personal
Selling
5
0,782 -
0,835
0,858 0,000
Brand Equity –
Brand Loyalty
6
0,683 -
0,797
0,861 0,000
Brand Equity –
Brand
Awareness
5
0,715 -
0,824
0,800 0,000
Brand Equity –
Perceived
Quality
5
0,714 -
0,831
0,842 0,000
Brand Equity -
Brand
Association
5
0,771 -
0,827
0,863 0,000
The results in Table 6 show that all variables
represent the diversity of indicators or question items
for linear regression analysis based on a range of
factor loading values above 0,50, KMO values above
0,50 and the significance value of Bartlett's test less
than 0,05.
8.4 Classic Assumption Test Results
8.4.1 Multicorrelation Test Results
The first classic assumption test is to test
multicorrelation to find out whether the relationships
between independent variables have multicorrelation
problems (symptoms of multicollinearity) or not. To
find out whether or not multicollinearity can use the
value of VIF (Variance Inflation Factory). Symptoms
of multicollinearity occur when the tolerance value is
less than 0.1 or VIF is more than 10.
Table 7: Multicorrelation Test Results.
Model
Collinearity
Statistics
Tolerance VIF
1 (Constant)
Advertising .330 3.026
Direct Marketing .233 4.288
Interactive/ Internet Marketing .235 4.260
Sales Promotion .323 3.092
Publicity/ Public Relation .314 3.182
Personal Selling .260 3.842
a. Dependent Variable: Y: Brand Equity
The results of the multicorrelation test through the
SPSS system above show that the tolerance values of
all the X variables to variable Y are less than 0.1 and
VIF values are less than 10 so that multicollinearity
does not occur or there is no high correlation between
all of the X variables which are the independent
variables.
8.4.2 Homocystaticity/ Heterocedasticity
Test Results
Homocystaticity / heterocedasticity test is a test that
assesses whether there is an inequality of variants
from residuals for all observations in the linear
regression model. This test is one of the classic
assumption tests that must be done in linear
regression analysis. If heterocedasticity assumptions
are not fulfilled, then the regression model is declared
invalid as a forecasting tool.
Detecting the presence or absence of
heterocedasticity is done by looking at a scatterplot
diagram. If there are certain patterns, such as dots that
form a certain pattern and are regular (wavy, widened
and then narrowed) then heterocedasticity occurs. If
there is no clear pattern, and the spread points occur
homocystaticity or heterocedasticity does not occur.
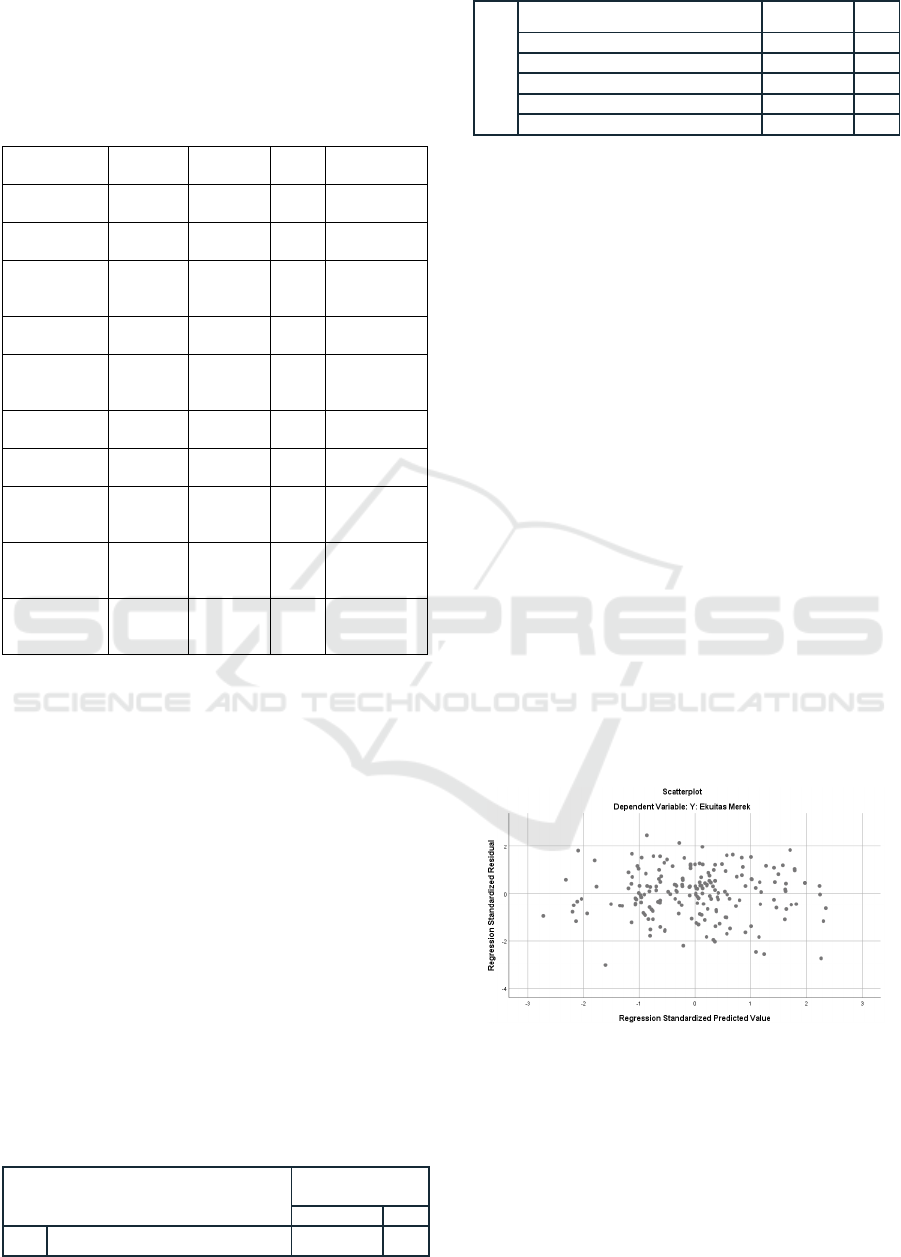
Figure 1: Homocystaticity / heterocedaticity test results.
Based on the scatterplot diagram as in Figure 1, it
can be seen that the data does not form a particular
pattern (irregularly dispersed) or in other words the
research model is homocedasticity. This means that
the research model is free from heterocedasticity
problems.
The Effectiveness of the Indonesia Stock Exchange’s Marketing Communication Program: Yuk Nabung Saham
213
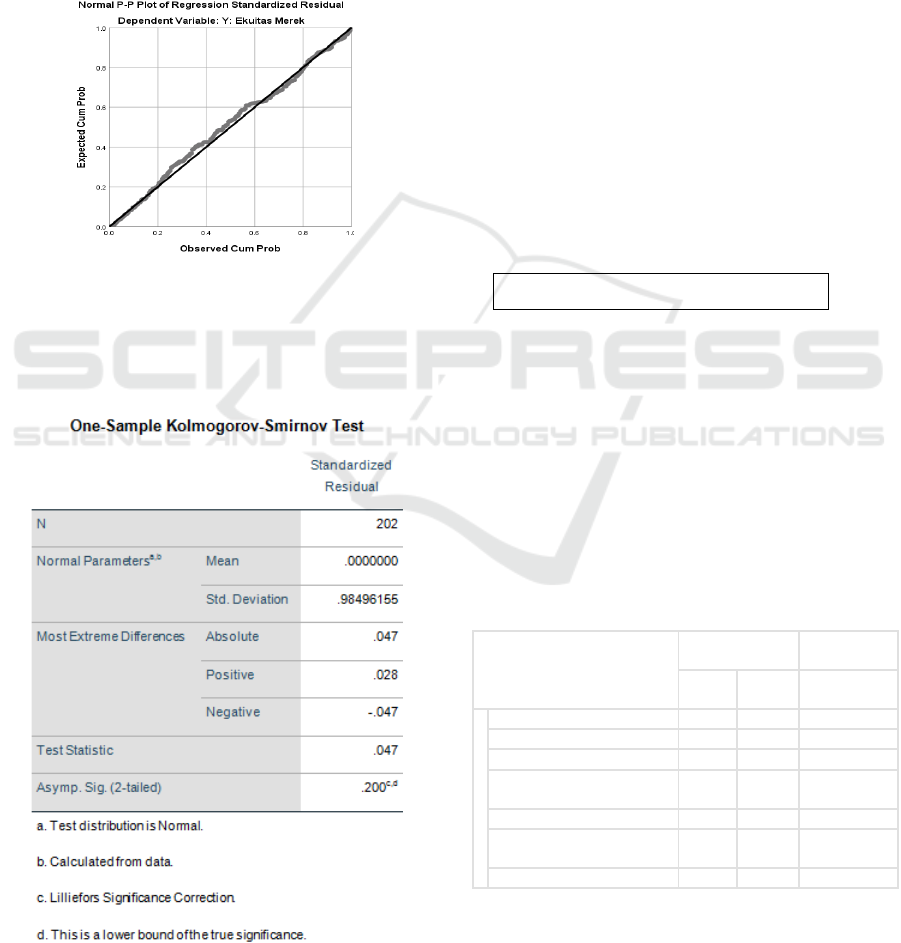
8.4.3 Normality Test Results
The normality test is to see whether the residual value
is normally distributed or not. A good regression
model is to have a residual value that is normally
distributed. The normality test was carried out by
looking at the results of the residual distribution plot
from the research data, and using the Kolmogorov-
Smirnov test. The following Figure 2 are the results
of the residual distribution plot from the research
data:
Figure 2: Normality Test Results.
Next is the normality test that carried out on the
residual value and not on each variable using the
Kolmogorov-Smirnov test. The following figure 3
shows the results of the Kolmogorov-Smirnov test:
Figure 3: Kolmogorov-Smirnov Normality Test Results.
If the probability or significance value is more
than 0.05 then the data is normally distributed, and if
the probability or significance value is less than 0.05
then the data is not normally distributed. From the
Kolmogorov-Smirnov test results obtained a
significance value above 0.05, which is 0.200. This
means that the distribution of residual data is
normally distributed.
8.5 Hypothesis Testing
8.5.1 Multiple Regression Analysis
Multiple linear regression analysis is used to see
whether there is an influence between Integrated
Marketing Communication and Brand Equity.
Testing this hypothesis is done through simultaneous
significance test or simultaneous test (F statistical
test), significance test for individual parameters or
partial test (T statistical test), and test the coefficient
of determination (R square). The multiple regression
equation in this study is formulated with the
following models:
(5)
Information:
Y: Brand Equity (dependent)
a: Constant value
b: Regression Coefficient Value
X1: Advertising
X2: Direct Marketing
X3: Interactive/ Internet Marketing
X4: Sales Promotion
X5: Publicity/ Public Relations
X6: Personal Selling
Table 8: Multiple Regression Analysis Results.
Coefficients
a
Model
Unstandardized
Coefficients
Standardized
Coefficients
B
Std.
Erro
r
Beta
1
(Constant)
.079 .074
X1: Advertising .230 .041 .227
X2: Direct Marketing .286 .045 .306
X3: Interactive/ Internet
Marketing
.087 .045 .093
X4: Sales Promotion .050 .034 .060
X5: Publicity/ Public
Relations
.148 .038 .164
X6: Personal Selling .182 .041 .204
a. Dependent Variable: Y: Ekuitas Mere
k
Based on the table 8 the equation is obtained as
follows:
Y=a+b1X1+b2X2+b3X3+b4X4+b5X5+b6X6
ICIB 2019 - The 2nd International Conference on Inclusive Business in the Changing World
214

(6)
Explanation of the equation is:
- The value of 0.230 X1 is the variable regression
coefficient of Advertising variable, which means
that every addition of 1 value or number for
Advertising it will increase Brand Equity by
0.230.
- The value of 0.286 X2 is the regression coefficient
value of Direct Marketing variable, which means
that every addition of 1 value or number for Direct
Marketing, it will increase the Brand Equity by
0.286.
- The value of 0.087 X3 is the regression coefficient
value of Interactive/ Internet Marketing variable,
which means that every addition of 1 value or
number for Interactive Marketing will increase the
Brand Equity by 0.087.
- The value of 0.050 X4 is the regression coefficient
value of Sales Promotion variable, which means
that every addition of 1 value or number for Sales
Promotion will increase Brand Equity by 0.050.
- Value of 0.148 X5 is the regression coefficient
value of Publicity/ Public Relations variable,
which means that every time there is an addition
of 1 value or number for Publicity/ Public
Relations, it will increase Brand Equity by 0.148.
- The value of 0.182 X6 is the regression coefficient
value of Personal Selling variable, which means
that every addition of 1 value or number for
Personal Selling will increase the Brand Equity by
0.182.
8.5.2 Simultaneous Test / F Test Results
Simultaneous test or F statistical test is intended to
test whether the independent variables included in the
model have a significant effect together on the
dependent variable. The null hypothesis (H0) that is
to be tested is whether all parameters in the model are
zero, in the sense that all independent variables are
not significant explanations of the dependent
variable. The alternative hypothesis (Ha) is not all
parameters simultaneously equal to zero.
The testing criteria are, if F Count is less or equal
to (≤) F Table or its significance value is more than
(>) 0.05, then H0 is accepted meaning not significant,
and if F Calculate more than (>) F Table or less
significance value from (<) 0.05, H0 is rejected and
H1 is accepted, meaning significant.
a. Dependent Variable: Y: Brand Equity
b. Predictors: (Constant), X6: Personal Selling, X4: Sales
Promotion, X5: Publicity/ Public Relation, X1: Advertising, X3:
Interactive/ Internet Marketing, X2: Direct Marketing
Figure 4: Annova Test Results.
From the results of the ANOVA test as in figure
4, the F statistic value of 274,286 with the calculated
F value is more than F table or the significance value
is less than 0.05, which is 0,000. This means that H0
is rejected and H1 is accepted, which means that the
independent variables namely Advertising, Direct
Marketing, Interactive / Internet Marketing, Sales
Promotion, Publicity / Public Relations, and Personal
Selling, together have a significant effect on the
dependent variable: Brand Equity.
8.5.3 Partial Test / T Test Results
The significance test of individual parameters or
partial test or T test was intended to test whether the
independent variables partially have a significant
effect on the dependent variable.
The hypotheses to be tested are as follows:
H0: Variable Advertising, Direct Marketing,
Interactive/ Internet Marketing, Sales Promotion,
Publicity/ Public Relations, and Personal Selling,
partially do not have a significant effect on Brand
Equity.
Ha: Variable Advertising, Direct Marketing,
Interactive/ Internet Marketing, Sales Promotion,
Publicity/ Public Relations, and Personal Selling,
partially have a significant effect on Brand Equity.
Table 9: Correlation Between Advertising, Direct
Marketing, Interactive/ Internet Marketing, Sales
Promotion, Publicity/ Public Relations, and Personal
Selling, and Brand Equity of The Firm Based on Partial Test
or T Test Results.
Integrated Marketing
Communication (IMC) Variables
Correlation with The Brand
Equity
Advertising
.000*
Direct Marketing
.000*
Interactive/ Internet Marketing
.054
Sales Promotion
.146
Publicity/ Public Relations
.000*
Personal Selling
.000*
*significant level at .05
Y = a + 0,230 X1 + 0,286 X2 + 0,087 X3 + 0,050 X4 +
0,148 X5 + 0,182 X6”
The Effectiveness of the Indonesia Stock Exchange’s Marketing Communication Program: Yuk Nabung Saham
215

The result is shown in table 9 that advertising,
direct marketing, publicity/ public relations, and
personal selling were directly related to brand equity.
In contrast, interactive/ internet marketing and sales
promotion were the tools which was not related to
brand equity.
8.5.4 Determination Coefficient Test (R
Squared) Results
Below was the result of testing of the Determination
Coefficient (R Squared) of all X variables in the
model against the variation of Y variable, to measure
the contribution of all independent variables (X) in
the model to the dependent variable (Y):
Table 10: Determination Coefficient Test (R Squared)
Results.
Model Summary
b
Model R R Square
Adjusted R
Square
Std. error of
the Estimate
1 .946
a
.894 .891 .14892
a. Predictors: (Constant), X6: Personal Selling, X4: Sales
Promotion, X5: Publicity/ Public Relations, X1: Advertising, X3:
Interactive/ Internet Marketing, X2: Direct Marketing
b
. Dependent Variable: Y: Brand Equity
The value of R Squared of 0.894 in the table above
shows that 89.4 percent of the variance Y can be
explained by changes in the variable Advertising -
X1, Direct Marketing - X2, Interactive/ Internet
Marketing - X3, Sales Promotion - X4, Publicity/
Public Relations - X5, and Personal Selling - X6.
While the remaining 10.6 percent was explained by
other factors outside the linear regression model of
this study.
9 CONCLUSIONS
After conducting research with survey methods and
data analysis with multiple linear regression tests, the
results of the study were as follows:
1. The IDX’s Yuk Nabung Saham Program so far
can be said to have run effectively along with the
increasing public awareness to invest in the
capital market and the growing number of stock
investors on the IDX significantly, especially
since the Yuk Nabung Saham campaign was
launched on 12 November 2015 with the growth
in the number of investors has grown 91,06
percent from 434,107 single investor
identification (SID) at the end of 2015 to 829,426
SID as of November 19, 2018.
2. The marketing communication strategy carried
out by IDX has effectively built brand equity from
Yuk Nabung Saham, especially to the target
population of Capital Market School participants
in Jabodetabek during the October 2018 period.
This is reflected in the data of the majority of
respondents in this study who have been able to
know and understand well information about
capital market products and Yuk Nabung Saham
campaigns and are interested in trying to save
shares and become investors in the Indonesian
capital market. The interest was because the
respondents had seen the Yuk Nabung Saham
advertisement in electronic media (TV, radio and
videotron), were interested and had participated in
and became IDX Capital Market School
participants which led to the opening of stock
accounts, and BEI trainer explanations in the
Capital Market School about investment capital
market and investment to the capital market.
3. From the results of multiple linear regression it
was concluded that there are a relationship and the
relationship between the integrated marketing
communication strategy carried out by the IDX
with brand equity from The Yuk Nabung Saham.
The results of this study were certainly in line with
the theory used by this study, namely Integrated
Marketing Communication theory from Belch and
Belch (2003) and Brand Equity Theory from
Aaker (2017). The results of this study have also
been in line with the results of previous studies
conducted by Brunello (2013) and Mongkol
(2014) which agreed that organizations could
create brand equity by implementing integrated
marketing communication. However there are
differences in the results of this research with
previous research, namely at the level of the
integrated mix of promotional marketing
communications that most significantly influence
the increase in brand equity of research subjects.
For example, a study conducted by Mongkol
(2014) which saw that all variables other than
advertising variables had a significant effect on
the formation of brand equity. Where as in this
study the integrated marketing communication
promotion mix which has a significant effect on
the formation of brand equity from Yuk Nabung
Saham was Advertising, Direct Marketing,
Publicity/ Public Relations, and Personal Selling.
There are two variables that have no significant
effect on brand equity, namely Interactive/
Internet Marketing, and Sales Promotion. Overall
brand equity in this study can be explained by the
Integrated Marketing Communication variable
through the Determination Coefficient test (R
ICIB 2019 - The 2nd International Conference on Inclusive Business in the Changing World
216

Squared) with a value of 0.891. This indicates that
89 percent of variations that occur in the high and
low brand equity were caused by changes in
Advertising, Direct Marketing, Interactive/
Internet Marketing, Sales Promotion, Publicity/
Public Relations, and Personal Selling. While the
remaining 10.6 percent was explained by other
factors outside of this research variable.
10 RECOMMENDATION
1. Exploration of research can be more focused on
other marketing strategies that might be able to
create more brand equity in the company besides
Integrated Marketing Communication.
2. The results of this study can be applied in different
industries to confirm the results of research
whether integrated marketing communication can
have a significant effect on the brand equity of a
company, industry, or strategy/ company
campaign.
3. Further research can also use qualitative studies in
depth to help a researcher better understand the
creation of brand equity, especially in the capital
market industry.
REFERENCES
Aaker, David A., 2017. Manajemen Ekuitas Merek. Jakarta,
Penerbit Mitra Utama.
Belch, George E., dan Belch, Michael A., 2003.
Advertising and Promotion. New York. The McGraw-
Hill Companies. 6th Edition.
Brunello, Adrien., 2013. The Relationship Between
Integrated Marketing Communication and Brand
Equity. International Journal of Communication
Research.
Gogtay, NJ, Thatte, UM., 2017. Principles of Correlation
Analysis. Journal of The Association of Physicians of
India. Vol 65. p. 78-81.
Hari Lubis, S.B., Huseini, Martani., 2009. Pengantar Teori
Organisasi: Suatu Pendekatan Makro. Depok,
Universitas Indonesia.
Mongkol, Kulachet., 2014. Integrated Marketing
Communication to Increase Brand Equity: The Case of
a Thai Beverage Company, International Journal of
Trade, Economics and Finance, Vol. 5, No. 5. p. 445-
448.
Neuman, Lawrance W., 2013. Metodologi Penelitian
Sosial: Pendekatan Kualitatif dan Kuantitatif. Jakarta.
PT Indeks, 2nd edition.
Shafi, Irfan Syed, Madhavaiah, C., 2013. Role of Integrated
Marketing Communications in Building Brand Equity:
A Review and Research Agenda. Amity Business
Review. Vol 14. No. 2. p. 54-66.
Shimp, Terence A., 2003. Periklanan Promosi Aspek
Tambahan Komunikasi Pemasaran Terpadu. Jakarta.
Erlangga. 1st Edition.
Sugiyono. 2015. Metode Penelitian Pendidikan. Bandung.
Alfabeta. 22nd Edition.
The Effectiveness of the Indonesia Stock Exchange’s Marketing Communication Program: Yuk Nabung Saham
217
