
Assessment of Green Supply Chain Management Implementation
using Green SCOR Approach:
Batik SME Tourism Jarum Village, Klaten
Retno Setyorini and Erlin Sabatian
Department of Business Administration,Telkom University, Bandung, Indonesia
Keywords: Green Supply Chain Management, Green SCOR, Importance Performance Analysis, SMEs.
Abstract: Batik is an artwork that has a high value. In 2009, the United Nations Educational, Scientific and Cultural
Organization (UNESCO) established batik as a world cultural heritage. This has an effect on the increasing
demand for batik production. Increasingly production of Batik is also contributing to the environmental
problem due to the waste. Batik and textile industry is one of the producers of liquid waste originating from
the coloring process. Besides the highly color substance, industrial waste from Batik and textile also consist
of murky and thick synthetic materials. This colored liquid waste is the reason for the environmental problem.
The color of liquid waste that was produced by a small textile industry mostly is a non-degradable organic
compound that causes environmental pollution, especially water. The aim of this research is to implement
Batik Green Supply Chain Management on Tourism Jarum Village SME, Klaten to obtain a percentage of
69% which means it includes into the good category. This study uses a quantitative method with the type of
research is applied research, with there are 28 Batik SMEs as the respondents. The analytical method used is
with Important Performance Analysis (IPA). The results showed that in performance the implementation of
Green Supply Chain Management in the UKM Batik Jarum Tourism Village, Klaten received a percentage of
69% which means it was in a good category. The results of the analysis using the IPA method show that there
are 5 statements that are the company's top priorities in making improvements, namely P4, P7, P9, P10, and
P25.
1 INTRODUCTION
In order to participate in the sustainable development,
SME sector must have capability to produce a
qualified product and one with excellent
competitiveness and innovation so that it can lead to
consumer satisfaction and good effects on the
environment, so that it is necessary for a step to
produce a green product starting from production and
until to consumers.
From results of a research conducted by Nurdalia
in Santosa, Susanty & Tania (2017), there is an
ineffective use of wax in the batik production stage,
since there is spilled remaining wax or mark of used
wax in the batik process that cannot be used anymore.
There is an ineffective use of dye due to an error in
the weighting of the amount of required dye,
attaching or sediment in the used place, or spilled
coloring place when it is poured.
Wax use inefficiencies are approximately 60%,
the use of dyes ranges from 0.07% to 54.58% per
year, and water use is estimated at between 10% and
30% per year. This inefficiency will aggravate
environmental performance due to the high level of
waste released as Non-Product Output (NPO). In
addition, there is also another arising negative effect
namely wastewater from the process of making batik
containing Biological Oxygen Demand (BOD) of
366.45 kg/day, Chemical Oxygen Demand (COD) of
620.4 kg/day and Total Suspended Solid (TSS) of to
83.9 kg/day. In addition, wastewater originating from
the process of batik production also produces oil fats
of 0.0000108 kg/day and CNH-N of 0.0004431
kg/day (Suhartini, 2012).
Based on interviews conducted with consumers
from natural batik pioneers in Jarum Tourism Village,
there are 28 batik SMEs in the batik center, and 10 of
them are environmentally friendly batik SMEs. Ten
batik entrepreneurs in the batik Jarum Tourism
village center have applied the Green Supply Chain
Management (GSCM) concept. Based on the results
358
Setyorini, R. and Sabatian, E.
Assessment of Green Supply Chain Management Implementation using Green SCOR Approach: Batik SME Tourism Jarum Village, Klaten.
DOI: 10.5220/0008431203580362
In Proceedings of the 2nd International Conference on Inclusive Business in the Changing World (ICIB 2019), pages 358-362
ISBN: 978-989-758-408-4
Copyright
c
2020 by SCITEPRESS – Science and Technology Publications, Lda. All rights reserved
of interviews with the owner of batik business, he
explained that in the process of producing natural
batik, a reuse system was used in wax used to do
batik, the use of dyes obtained from the furniture
industry's wood waste, the use of dyed water is used
several times a day, the use of coloring materials is
used for several dyeing processes and recycle process
in the use of packaging made from recycled paper,
coloring waste is used as fertilizer and use of
remaining batik patchworks is another valuable
product.
By the description, it is expected that each
business actor can prepare a program to eradicate any
existing negative effects, as described in Law
Number 32 of 2009 concerning protection and
management of life environment and by the
development of consumer awareness on
environmental issues requiring company to start to
implement friendly environmental regulations, such
as implementation of reuse, remanufacturing, and/or
recycling in the business implementation.
Implementation of various regulations related to
environmentally sound aspects in a business is an
implementation of Green Supply Chain Management
(Djunaidi, Mufid & Sholeh, 2018).
From results of the interview with Mr. Sarwidi as
the natural batik pioneer as well as the owner of Batik
Natural SME in Tourism, Jarum Village Klaten
described that Batik SME in Jarum Village has
implemented GSCM practice in the business but for
the measurement of GSCM implementation is yet
applied. To assess the implementation of GSCM, it
can use Green Supply Chain Operation Reference
(Green SCOR) approach. Implementation of Green
SCOR model can identify supply chain performance
indicators showing a company supply chain process
so that it can be used as an evaluation to improve
company performance (Anggani, Syawarni &
Wahyuniardi, 2017)
Thus, it is necessary for batik SME to implement
GSCM practice in order to minimize any arising
problems in business practices. This research aims to
conduct an assessment on the implementation of
GSCM practice in Tourism Jarum Village Klaten by
making an assessment using Green SCOR approach.
2 RESEARCH METHODS
Population.
According to Sugiyono (2013), a population is a
regional generalization consisting of objects/subjects
that have certain qualities and characteristics set by
researchers to be studied and then drawing
conclusions. The populations used in this study are all
SME members in Tourism Jarum Village Klaten,
namely, there are 28 SMEs.
Samples.
According to Sugiyono (2013), the sample is part of
the number and characteristics of the population. In
this study, it uses a saturated sampling technique.
According to Sugiyono (2013), saturated sampling is
a sampling technique if all members of the population
are used as samples. This is often done if the
population is relatively small, less than 30 or wants to
make generalizations with very little errors. So, in this
study, researchers use all 28 members of the Batik
SMEs in Tourism Jarum Village as the samples.
Data Collection Technique.
According to Sugiyono (2014), Data collection
techniques applied in quantitative research can be
done by tests, questionnaires, interviews, structured
observations. In this study, it uses questionnaires,
interviews, observation and literature studies.
Variable Operationalization.
Research variable is an attribute, property or value of
people, object or activity with specific variations set
by researchers to be studied or drawn a conclusion
(Darmawan, 2013) which can be seen in table 1.
Table 1: Variable Operationalization.
Variable
Dimension
Indicators
Plan
Plans to minimize harmful energy and material use
(P1, P2)
Plan for control and hazardous material storage (P3,
P4)
Plans for cleaning ordinary waste and hazardous
waste (P5, P6)
Plan for adjustments from all supply chain activities
(P7, P8)
Source
Selecting suppliers with a positive environmental
record (P9, P10)
Selecting environmentally friendly materials (P11,
P12)
Determining packaging requirements (P13, P14)
Determining shipping requirements to minimize
transportation and maintenance requirements
(P15,P16)
Make
Schedule production to minimize energy
consumption (P17, P18)
Managing waste results during the manufacturing
p
rocess (P19, P20)
Managing emissions (air and water) from the
manufacturing process (P21, P22)
Deliver
Minimizing the use of packaging material (P23,
P24)
Plan for delivery to minimize fuel consumption
(P25, P26)
Return
Schedule of aggregate transportation and shipping to
minimize fuel consumption (P27, P28)
Source: Researcher Processing, 2018
Assessment of Green Supply Chain Management Implementation using Green SCOR Approach: Batik SME Tourism Jarum Village, Klaten
359

According to (Indrawati, 2015) validity shows the
extent to which a measuring device can measure what
is willing to be measured so that it can be said that
higher validity of a measuring instrument will lead to
the increasingly possible measuring device to hit the
target. In this test, it uses a significance level of 5%
(α = 0.05) and is obtained r-Table of 0.374. Looking
at the results of data processing, it shows that results
of the validity test of this study are valid with R
arithmetic values greater than R Table (0.374) (R
arithmetic > R Table) then the statement is valid and
can be understood or accepted by the respondents.
According to Suhartanto (2014), an instrument is
said to be a reliable measuring device is it is used to
measure similar items to give consistent results. The
following table 2 is the results of reliability testing
results of questionnaire data from 28 respondents.
Table 2: Results of Reliability Test.
Statements
(N of items = 25)
Cronbach’s Alpha Notes
Performance 0,943 Reliable
Expectation 0,947 Reliable
Source: Testing Results of SPSS version 23, 2018.
Based on the results of questionnaire data
reliability test shown in the Table above, the
Cronbach's Alpha coefficient is greater than 0.70
which is equal to 0.943, so the category can be said to
be reliable.
3 RESULTS AND DISCUSSION
3.1 GAP Analysis
In this study, it is obtained the average results of all
statements of performance and expectations. To
determine the gap value, it can be seen from the
difference between the performance and expectation
values. The following is the results of a gap analysis
between performance conditions and expectations.
Based on the Table.3, all statements have negative
gaps. This indicates that the actual conditions in the
field are still not in accordance with the expected
conditions.
Table 3: GAP Analysis.
Source: Researchers’ Processing Results, 2018.
3.2 Important Performance Analysis
According to Hideki & George (2011), Important
Performance Analysis (IPA) is an evaluation tool
used to determine attribute priority that must be
corrected and can be used as guidelines in strategic
development". In addition, it is also explained that the
two-dimensional science model is divided into 4
quadrants with importance on x-axis and performance
on the y-axis as the following figure 1.
Based on the Cartesian diagram Figure, it is
obtained results of variable mapping based on its
priority scale with IPA method as follow:
ICIB 2019 - The 2nd International Conference on Inclusive Business in the Changing World
360
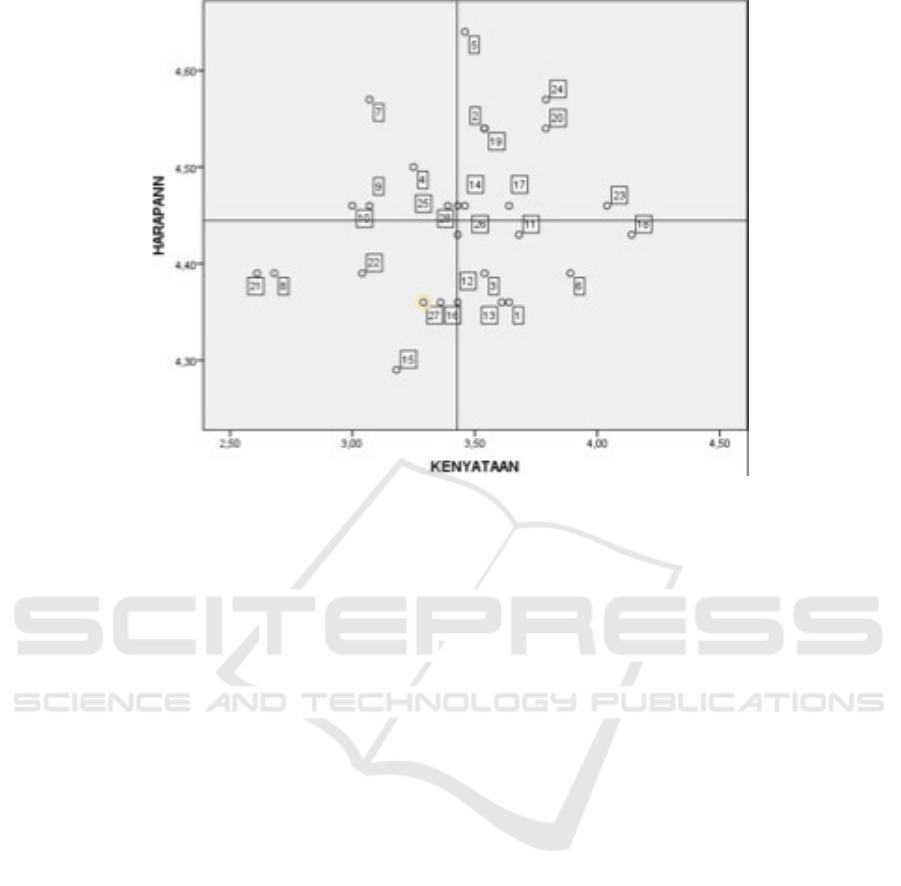
Figure 1: Cartesians diagram of importance performance analysis. (Source: Testing results of SPSS version 23, 2018).
I-Quadrant.
The existing attributes in this quadrant represent
necessary areas to be improved by being the top
priority as follows:
(P4) SMEs implement an environmental management
system; (P7) SMEs plan for coloring waste treatment;
(P9) SMEs choose suppliers that produce
environmentally friendly waste; (P10) SMEs choose
suppliers who implement environmental management
systems in their production processes; (P25) SMEs
are scheduling deliveries directly to consumers to
reduce overall transportation
II-Quadrant.
The existing attributes in this quadrant represent the
company strengths and pillars, the following is the
company prides, namely:
(P2) SMEs plan to reduce hazardous materials in the
production process; (P5) SMEs calculate the amount
of waste produced from the production process; (P14)
SMEs use recyclable packaging; (P17) SMEs make
production schedules to minimize energy
consumption; (P19) SMEs recycle produced dye
waste during the production process; (P20) SMEs
recycle produced fabric waste during the production
process; (P23) SMEs do not use plastic packaging in
each product unit; (P24) SMEs do product packaging
using reusable materials
III-Quadrant.
The attributes in this quadrant are considered not
important and result in no treats for the company, as
follow:
(P8) SMEs plan the implementation of WWTP; (P15)
SMEs choose the shortest route in the process of raw
material transportation; (P16) SMEs reduce the use of
transportation fuels by using vehicles based on the
company demand capacity; (P21) SMEs manage the
results of waste water in the production process with
the presence of WWTP; (P22) SMEs switch from the
use of wood to gas in the batik process in order to
reduce air pollution; (P27) SMEs make delivery
scheduling according to slots.
IV-Quadrant.
This quadrant shows any attributes with much
pressure given by the organization, thus the company
must reflect to these attributes, instead of focusing on
this quadrant, it is better for the company to allocate
solutions to improve I quadrant. The following is the
attributes in the IV quadrant:
(P1) SMEs plan to minimize energy consumption in
the production process; (P3) SMEs have a place to
store non-organic raw materials (wax for batik
making); (P6) SMEs plan to use wax; (P11) SMEs use
environmentally friendly raw materials; (P13) SMEs
use packaging from environmentally friendly
materials; (P18) UKM puts HR according to the
needs of each production unit.
Assessment of Green Supply Chain Management Implementation using Green SCOR Approach: Batik SME Tourism Jarum Village, Klaten
361

After determining results from I quadrant until IV
quadrant, it is obtained 3 statements including in
median points (P12; P26; P28) meaning that
performance and expected one is well-adjusted since
the gap value is similar to zero.
Based on the IPA analysis conducted by the
researchers, this research focuses on I quadrant since
this Quadrant includes any necessary aspects to
improve and used as the main priority and the
statements above include in the plan (P4; P7), source
(P9; P10) and deliver (P25) dimensions. This implies
that in the GSCM implementation, these three
dimensions are the companies main priority for
improvement since the aspects in this quadrant are yet
applied appropriately.
4 CONCLUSIONS
Based on the research results, it can draw some
conclusions that are expected to answer any problems
formulated in this research. The conclusions are as
follow:
1. Based on the descriptive analysis results
regarding expectation value from the Green
Supply Chain Management implementation in
Batik SMEs in Jarum Tourism Village, Klaten, it
is obtained the percentage of 89% from total
average importance value with an excellent
category. This indicates that there is a very
important importance value on the
implementation of Green Supply Chain
2. Based on the descriptive analysis results
regarding performance value from the Green
Supply Chain Management implementation in
Batik SMEs in Jarum Tourism Village, Klaten, it
is obtained the percentage of 69% from total
average importance value with the good category.
This indicates that there is the implementation of
Green Supply Chain in Batik SMEs, Jarum
Tourism Village, Klaten has been good. However,
it is still necessary for improvement in some
aspects which still have scores below the good
category namely by applying environmental
management system, WWTP implementation
plan, selecting supplier producing environmental
friendly waste, selecting supplier applying
environmental management system in the
production process, selecting the shortest route in
the process of raw material transportation,
reducing the use of transportation fuels by using
vehicles based on the company demand capacity,
managing the results of waste water in the
production process with the presence of WWTP,
switching from the use of wood to gas in the batik
process in order to reduce air pollution, making
delivery scheduling according to slots
3. Based on the analysis results of Important
Performance Analysis, it can be seen 5 statement
items as the main attention for improvement
namely applying environmental management
system, making plans for coloring waste
management, selecting suppliers producing
environmental friendly waste, selecting supplier
applying environment management system in the
production process and scheduling direct
transportation to consumers to reduce overall
transportation.
REFERENCES
Anggani, R., Syawarni, M., Wahyuniardi. 2017.
Measurement of Supply Chain Performance with the
Approach of Supply Chain Operation Reference
(SCOR). Journal of Industrial Engineering. Vol. 16
Darmawan. 2013. Quantitative Research Methods.
Bandung: Teenager Rosdakarya.
Djunaidi, M., Sholeh, M, A, A., Mufiid, M, N.,
“Identification of Factors in the Application of Green
Supply Chain Management in the Wood Furniture
Industry” JTIUMM. Vol. (19)
Indrawati. 2015. Research Methods in Management and
Business Convergence of Communication and
Information Technology. Bandung: PT Refika Aditama.
Sugiyono. 2013. Business Research Methods. Bandung:
Alfabeta.
Sugiyono. 2015. Business Research Methods. Bandung.
Alfabeta.
Suhartanto, Dwi. 2014. Marketing Research Methods.
Bandung: Alfabeta.
Suhartini. (2012). “Implementation of Green Productivity
to increase the productivity of small and medium
enterprises development”. Proceedings of Industrial
Estate Development and Sustainable Innovation to
Increase Competitiveness. Bangkalan Indonesia,
September 22.
Susanty, A., Santoso, H., Tania, F. 2017. Assessment of
Implementation of Green Supply Chain Management in
Pekalongan Batik UKM with Green SCOR Approach.
Industrial Engineering Scientific Journal. Vol. (14)
Wong S. M., Hideki. N., George.P., 2011. “The Use of
Importance-Performance Analysis (IPA) in Evaluating
Japan's e-government Services”. Journal of Theoretical
and Applied Electronic Commerce Research. Vol. 6.
ICIB 2019 - The 2nd International Conference on Inclusive Business in the Changing World
362
