
Forecasting Airline Passenger Demand for the Long-haul Route: The
Case of Garuda Indonesia
Adha Mahmeru Bala Putra and Ratih Dyah Kusumastuti
Department of Management, Faculty of Economics and Business, Universitas Indonesia, Kampus UI Depok 16424, West
Java, Indonesia
Keywords: Forecasting, Airline Passenger, Aviation Industry, Long-haul Route.
Abstract: This paper discusses the forecasting of passenger demand for the long-haul route at Garuda Indonesia, which
is the legacy air carrier of Indonesia. We focus on routes with the largest share, namely China and Saudi
Arabia. We use two forecasting models for this purpose. First is a regression model with the population in
each country as the independent variable, and second is the Winter's model that is suitable for data with trend
and seasonality characteristics, such as airline passenger. The performance of both methods is analysed using
forecast errors, which are a mean squared error (MSE), mean absolute deviation (MAD), mean absolute
percentage error (MAPE) and Tracking Signal. The results show that Winter's model is more suitable for the
China route, while the regression model is more suitable for Saudi Arabia route. The forecasting results for
2019-2028 show a significant growth of passengers for both routes that must be anticipated by the company.
1 INTRODUCTION
The airline's industry normally deals with massive
risks, from the rise and fall in jet fuel price and
currency exchange rates, to enormous capital
expenditures, rivalry from low cost carrier and
instability in passenger demand (Pyke et al., 2018).
The industry is a significantly highly-regulated
industryto be based, it is vital for the decision maker
and policy planner to observe and assess the airline’s
performance by utilizing productivity analysis and
efficiency (Chen et al., 2018).
The aviation authority of every nation distributes
factual indicators each year, for example, cargo and
passenger turnover volume, which demand for
improvement of the nation's aviation industry (Xu et
al. 2019). Accurate forecasting of these indicators is
important for both airlines and airports, to oversee
and build their capability, increment passenger load
rate, decrease operation costs, enhance service
quality, reduce environmental impact affect and
enhance their competitive advantage (Xu et al.,
2019). Demand forecasting enables administrators to
make master plans on investment, management and
construction (Flyvbjerg et al., 2005). For this purpose,
selecting a forecasting model that is suitable for the
aviation business is a valuable task and crucial (Xie
et al., 2014).
Based on Airbus (2013) and Boeing (2013) data,
the aviation industry will experience growth of
passenger demand at the rate of almost 5% annually
for the next 20 years.
The airlines carriers adjust their capacity to deal
with the passenger growth, by either increasing the
aircraft size or frequency, which may prompt
distinctive quantities of aircraft movements, but the
movement of the aircraft, which is the number of
operated flights on one leg, affects the different parts
of the air transport system (Kolker 2016). For
instance, Kolker (2016) describes that one trip with a
wide-body aircraft may prompt less emission and less
immersion of airplane terminals and air space than
two flights with narrow body aircraft that carrying
together a similar number of passengers. For this
reason, Kolker (2016) also explains that forecasting
aircraft movements are essential for assessing future
developments and technologies of the air
transportation framework system.
Other researcher, such as Gelhausen (2018), also
explains that long-term planning of transportation
system requires to know future transport prerequisites
for various financial scenarios.
The objective of this study is to select a forecast
model that is suitable to predict the number of an
flights flying Garuda Indonesia airlines that can be
used as a reference for various strategic and
530
Putra, A. and Kusumastuti, R.
Forecasting Airline Passenger Demand for the Long-Haul Route: The Case of Garuda Indonesia.
DOI: 10.5220/0008433305300537
In Proceedings of the 2nd International Conference on Inclusive Business in the Changing World (ICIB 2019), pages 530-537
ISBN: 978-989-758-408-4
Copyright
c
2020 by SCITEPRESS – Science and Technology Publications, Lda. All rights reserved

operational decision making, such as selecting the
number of aircraft for certain types of aircraft needed
in the future (or fleet planning). We focus on long-
haul routes with highest revenue share, namely,
China and Saudi Arabia. China is chosen because the
growth of Chinese travellers to Indonesia is the
largest in recent years (The Jakarta Post, 2018), while
Saudi Arabia is selected because the country is the
popular pilgrimage destination for Indonesian
Moslem residents (Susanty, 2017). According to the
data from The Ministry of Religious Affairs (MRA),
there is a 63.6% increase in pilgrimage to 818,000 in
2016 from just 500,000 in 2012 (Susanty, 2017).
It is expected that this study will provide better
understanding related to the implementation of
forecasting decisions related to the operation
planning that is very important in the aviation
industry. Specifically, this study gives insights on the
reality of airline passengers in Indonesia, especially
for the long haul. It can be used as a reference for
Garuda Indonesia to choose the right operational
decision to maximize its profitability and customer
service level.
The paper is structured as follows. A relevant
literature review is presented in Section 2, relevant
literature review in Section 3, findings and discussion
in Section 4, and conclusion and recommendation in
Section 5.
2 LITERATURE REVIEW
Forecasting is very important in demand
management, because forecasting provides an
estimation of future demand which is the basis of
many business decisions (Wiesner et al., 2019).
Forecasting methods are basically can be classified
into quantitative and qualitative methods (Wisner et
el., 2018; Heizer et al., 2017). Qualitative techniques
are used when the available data is very limited, or
even irrelevant, for this reason a qualitative technique
is needed to be based on intuition or judgment from
an expert in their field, while quantitative techniques
use mathematical methods that utilize historical data
and can also include a number of relevant variables
(Wiesner et al., 2019).
According to Heizer et al. (2017), the quantitative
approaches are basically can be classified into time-
series models (such as moving average and
exponential smoothing models, which forecast only
based on past data) and associative models (such as
regression model, that use changes in one or more
variables to predict the changes in dependent
variables). Concerning, the the time series models,
they usually have the following components: trend
variations (persistent upward and downward pattern),
cyclical variations (repeating up and down
movements that are more than one year and
influenced by external factors such as political or
macroeconomic factors), seasonal variations (regular
up and down fluctuations, such as monthly or yearly),
and random variations (erratic, unsystematic
fluctuations due to random variations or unforeseen
events) (Heizer et al., 2017).
Regarding airline passenger demand forecasting,
Carreira et al. (2017) forecast passenger demand of TAP
Portugal airline, the legacy airlines of Portugal, to
predict the demand in several cities in Brazil. They use
a regression model by looking at the relationship
between the passenger demand, the city’s population,
and whether there is a direct flight to the destination.
Kolker et al. (2016), on the other hand, implement the
forecast of aircraft movement (FoAM) method, which
basically divides each flight segment into a quantity of
passengers, distance and aircraft type category, and then
predicts the passenger growth rate each year as the input
parameter from the data obtained from airbus (2013).
The FoAM model is done using Java and the forecast
process is done automatically.
Hsu et al. (2011), on the other hand, conduct
forecasting on demand that is very fluctuating using
Grey topological and Markov-chain models carried
out on EVA air in Taiwan by considering several
different economic conditions.
Lastly, Xu et al. (2019) use a mixture of
autoregressive, integration, moving average,
seasonal autoregressive, seasonal integration, and
seasonal moving average (SARIMA) and support
vector regression (SVR). In their research, Xu et al.
(2019) include the white gaussian noise in the
forecast model and the proposed procedure are as
follows. First, time series data is used in SARIMA
models to get the parameters. Second, the SARIMA
results are obtained based on the parameters
specified. Third, the white noise gaussian is
recalculated based on the results of SARIMA.
Fourth, four variable combinations are combined to
be processed into a mixed model to predict statistical
indicators in the airline's industry. Finally, the results
of the forecast can be obtained.
As can be seen, there are different forecasting
models that are used to predict airline passenger
Forecasting Airline Passenger Demand for the Long-Haul Route: The Case of Garuda Indonesia
531

demand, however the models are a bit complex and
may not be practical to be used in the real world.
Therefore, in this study, we choose to compare two
forecasting models that are practical and can be used
to forecast Garuda Indonesia’s airline passengers.
3 RESEARCH METHOD
3.1 Research Stages and Data
Collection
The purpose of this study is to predict Garuda
Indonesia passenger demand for long-haute routes,
focusing on Saudi and Chinese routes, which will be
valuable for several strategic decisions, such as fleet
planning.
We use two forecasting models that are suitable for
predicting airline passenger demand, namely the
regression model by Carreira et al. (2017), and the
classic Winter’s model that takes into account trend and
seasonality aspects (Chopra and Meindl, 2016). In order
to determine the suitable forecast method, we use
compare passenger demand data and the forecast results
for the period of 2013-2018. Concerning Winter’s
model, we use MS Excel Solver to find the optimal
values of the smoothing constants. The suitability of the
models is then determined by analysing their
performances using the forecast errors (MAD, MSE,
MAPE, and tracking signals). Based on the results, we
then forecast the demand for 2019-2028 using the
forecast method with the least errors.
Data for this study are collected through internal
demand passenger data from the Market Research
Department in Garuda Indonesia. The data is obtained
from the Global Distribution system (GDS) for bi-
direction passenger traffic from all cities with the
origin of all cities in Indonesia and all cities in China
and Saudi Arabia, including transit passengers
specifically for Garuda Indonesia passengers. The
population data of China and Saudi Arabia are
retrieved from http://www.worldometers.info, which
is owned by DADAX, that is run independently by an
international team of volunteers, researchers and
developers (Worldometers, 2019).
3.2 Forecasting Models
As previously mentioned, the first model is adjusted
from Carreira et al. (2017), which formulate a
regression model using comparative demand data
and population data. The advantage of using this
method is to utilize the size effects of the Chinese and
Saudi Arabian populations on demand from Garuda
Indonesia. The regression equation is formulated as
the following:
ln D = a + b. ln P +
(1)
Then, the future demand equation is:
D = e
(a+ )
P
b
(2)
Where D is airline passenger demand, P is the
country’s population, a and b are regression
coefficients, and ɛ is the error term.
The second model that we use is Winter’s model.
Chopra and Meindl (2016) explain that Winter’s
model is suitable when the systematic factor of
demand has a trend, a level, and a seasonal factor.
The formulation is just like in Formulation (3).
Systematic Component of Demand =
(3)
(Trend + Level) x Seasonal Component
The forecast equation, on the other hand is
presented in Formulation (4), while the trend equation
is explained in Formulation (5), level equation is
presented in Formulation (6), and the seasonal factor
equation is described in Formulation (7).
F
t+1
= (L
t
+T
t
)S
t+1
and F
t+l
= (L
t
+ lT
t
)S
t+l
(4)
Tt+1 = (Lt+1 – Lt) + (1- )Tt
(5)
Lt+1 = (Dt+1 / St+1) + (1- )(Lt + Tt)
(6)
St+p+1 = (Dt+1 / Lt+1) + (1- )St+1
(7)
Where:
F
t
forecast at time t
L
t
level at time t
T
t
trend at the time t
S
t
seasonal component at the time t
𝛼 𝛼 is the weight for the level
𝛽 weight for the trend
δ weight for the seasonal component
P seasonal period
l time step ahead to forecast
The value for the (the level’s smoothing constant)
is 0 < < 1. The value for the (trend’s smoothing
constant) is 0 < < 1, while the value for the (is (the
seasonal factor’s smoothing constant) is 0 < < 1).
Using this method, we need at least one-year actual
data to forecast future demand.
ICIB 2019 - The 2nd International Conference on Inclusive Business in the Changing World
532
3.3 Measures of Forecast Errors
In this study the forecast error analysis is carried out
by using several commonly used methods, which are
MSE, MAD, MAPE and Tracking Signal.
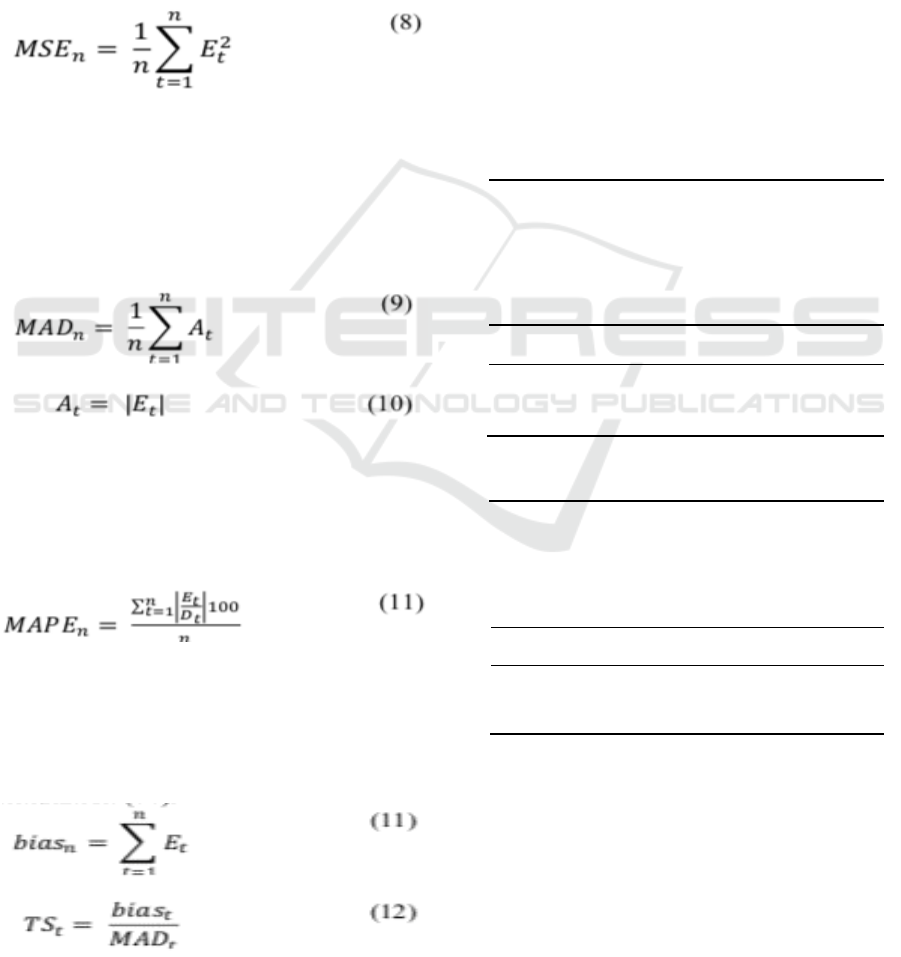
Mean Squared Error (MSE) is one of the forecast
error analysis methods that compare whether errors
generated by one forecast method are greater than
other forecast methods that are more accurate. MSE
is related to the of the forecast errors. MSE equation
is in Formulation (8), where Et is the error (the
difference between forecast and actual values) at
period t.
Mean Absolute Deviation (MAD) is used in
estimating the standard deviation from random
components when the assumed random component is
normally distributed. MAD is better at measuring errors
than MSE when the cost of forecast error in forecasting
technique is proportional to the number of errors. The
MAD equation is in Formulation (9), and is the sum of
the absolute deviation At (Formulation 10).
MAPE, on the other hand, is the average of the
absolute error in terms of percentage. MAPE is a
very good measure in measuring forecast error when
the calculated forecast has significant seasonality
and demand related between one period to another.
MAPE equation is in Formulation (11), where Et and
Dt are error and demand in period t respectively.
The last measure that we use is tracking signal
(TS), which is the ratio of bias to MAD. When TS in
a period is outside the ±6 value, it is a sign that the
forecast is biased. The tracking signal equation can be
seen in Formulation (12), and the bias value is
explained in Formulation (11).
4 FINDINGS & DISCUSSIONS
4.1 Adjusted Carreira et al. (2017)
Model
The results of applying the adjusted regression model
by Carreira et al. (2017) to forecast Garuda
Indonesia’s passenger demand to China and Saudi
Arabia can be seen in Tables 1 and 2.
It can be seen that for China route that the adjusted
R square value is 0.815, with the t-value of 4.2, and
the p-value is less than 0.005. For the Saudi Arabia
route, we can see that the adjusted R square value
which is 0.815, with t- value 4.20 and the p-value is
less than 0.005. Thus, we can say that the model can
be used to forecast the passenger demand to both
routes.
Table 1: Regression result for China.
R Square
0.81554618
Adjusted R
0.76943272
Square
Standard
0.16868676
Error
Coefficients
t Stat
P-value
Intercept
-741.017503
-4.1327289
0.01446176
X Variable 1
35.8061659
4.2054303
0.01363614
Table 2: Regression result for Saudi Arabia.
R Square
0.81544393
Adjusted R
0.76930491
Square
Standard
0.10966107
Error
Coefficients
t Stat
P-value
Intercept
-67.7377908
-3.5319395
0.02418827
X Variable 1
4.66742158
4.2040016
0.01365181
Applying the model, the comparisons between
actual and forecasted passenger demand can be seen
in Figures 1 and 2. The results show that the forecasts
look relatively China and Saudi Arabia routes, using
both forecasting models.
Forecasting Airline Passenger Demand for the Long-Haul Route: The Case of Garuda Indonesia
533
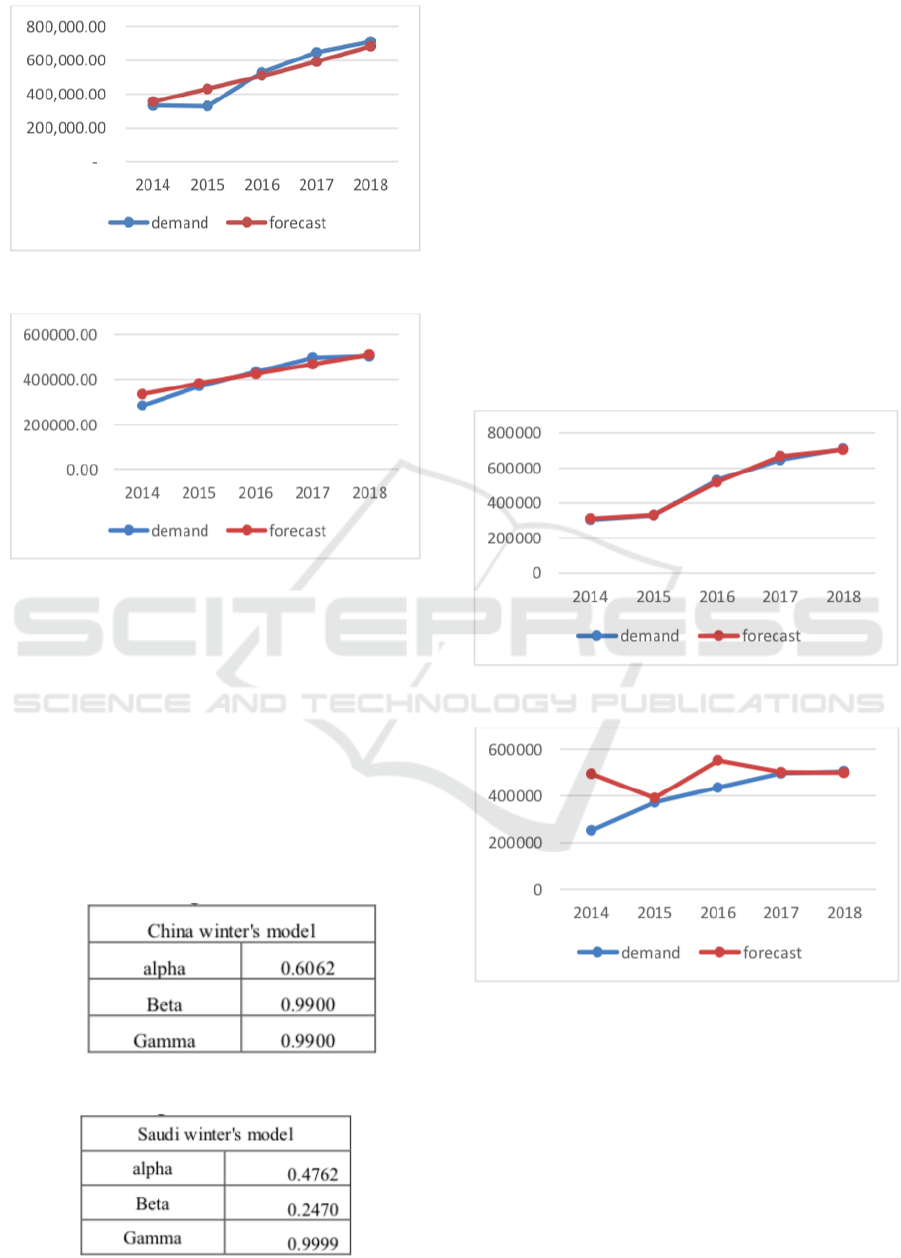
Figure 1: Actual and forecast (regression model) for China.
Figure 2: Actual and forecast (regression model) for Saudi
Arabia.
4.2 Winter’s Model
As previously mentioned, in applying Winter’s
model to forecast the passenger demand to China and
Saudi Arabia routes, we use optimal values of
smoothing constants generated by MS Excel Solver,
and the optimal values for the smoothing constants
can be seen in Tables 3 and 4.
Table 3: Smoothing constants for China’s route.
Table 4: Smoothing constants for Saudi Arabia route.
The smoothing constants values are then used in
Winter’s model formulations, and the actual and
forecast values for both routes are presented in
Figures 3 and 4.
The forecast results of Chinese routes (Figure 3)
look very close to the actual demand, even better
than the results of the to route the previous
regression model (Figure 1). However, this is
contrary to the forecast results of Saudi Arabia
(Figure 4). It can be seen that the differences
between actual and forecast in 2014 and 2016 are
significant, although the differences are not that
significant in the other years. Thus, it seems that the
forecast using adjusted Carreira et al. (2017) model
looks better for the Saudi Arabia route than Winter’s
model.
Figure 3: Actual and forecast (Winter’s model) for China.
Figure 4: Actual and forecast (Winter’s model) for Saudi
Arabia.
4.3 Forecast Errors
The forecast errors of both models on both routes are
calculated, and presented in Table 5.
For the Chinese route, the MAD, MSE, and
MAPE values of Winter's model look much smaller
than the regression model, ±while tracking signal for
ICIB 2019 - The 2nd International Conference on Inclusive Business in the Changing World
534
both models is still within 6, with tracking signal.
value of the regression model is closer to zero than
that of Winter’s model.
Contrary to the results for China route, the results
for Saudi Arabia route show that the MAD, MSE,
and MAPE values of the regression model are much
smaller than those of Winter's model, with tracking
the signal of regression model close to zero.
The difference in the results of China and Saudi
Arabia routes may be due to the fact that the Chinese
route has a seasonal pattern in each year compared to
the Saudi Arabia route, which seasonal pattern
cannot be well described because the Hajj season and
the Ramadan season move in advance approximately
10 days each year.
Table 5: Forecast errors.
CHINA ASSOCIATIVE REGRESSION MODEL
TS
MAD
MSE
MAPE
(0.49)
44,801
2,954,183,230
10.6%
CHINA TIME SERIES WINTER'S MODEL
TS
MAD
MSE
MAPE
(1.40)
21,378
744,040,486
6.0%
SAUDI ASSOCIATIVE REGRESSION MODEL
TS
MAD
MSE
MAPE
(1.35)
9,276
136,243,278
1.8%
SAUDI ARABIA TIME SERIES WINTER'S
MODEL
TS
MAD
MSE
MAPE
(4.87)
77,525
14,603,142,791
26.0%
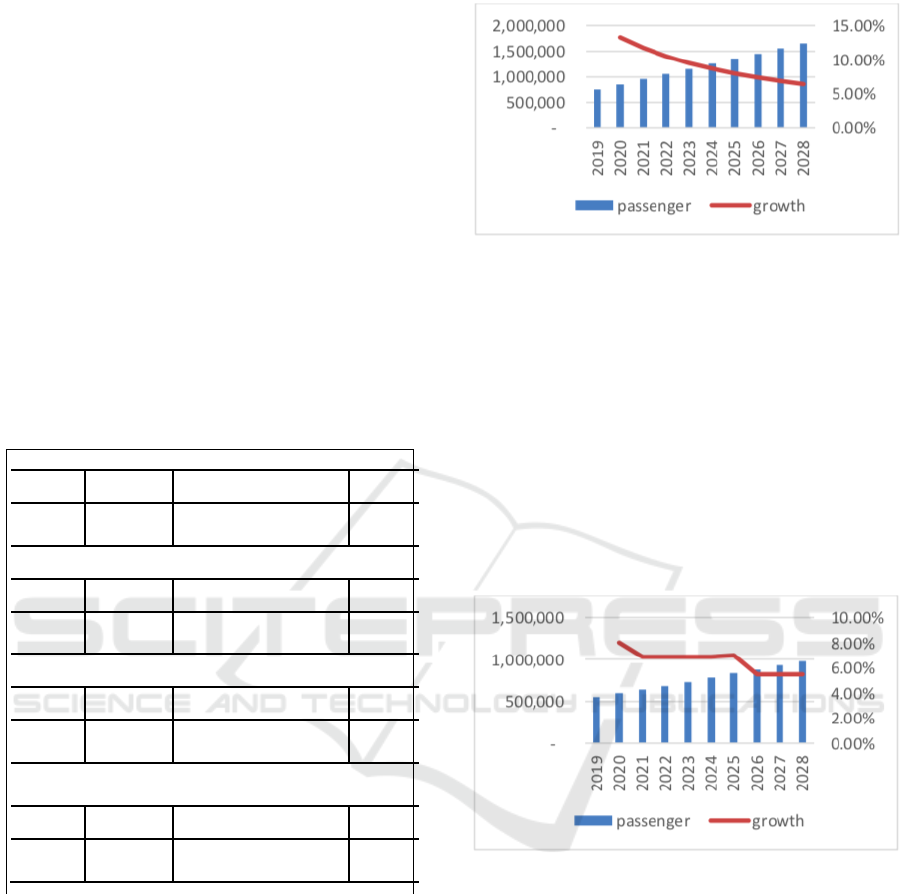
4.4 Forecasting Future Demand
Based on the results explained in the previous
subsections, we forecast demand for Garuda's airline
passengers for the next 10 years (2019-2028).
Demand for China route is predicted using the
Winter's model forecast method (see Figure 5), while
the demand for Saudi Arabia route is carried out by
the regression model (see Figure 6). The line in
Figures 5 and 6 indicate the growth rate of airline
passengers for both routes.
Figure 5: Forecast (Winter’s model) for China.
The forecast results for the China route for the
next 10 years show an annual average growth of
almost 9 percent with a predicted 750.000 passengers
in 2019 and reach more than 1.6 million passengers
in 2028, while for Saudi Arabia the route shows the
average growth of 6 percent each year with a
prediction of about 550.000 passengers in 2019 and
reaching more than 900.000 in 2028. The growth for
the China and Saudi Arabia routes shows a higher
number than Airbus (2013) and Boeing (2013)
predictions, while they expect only almost 5 percent
growth in passengers for Next 20 years.
Figure 6: Forecast (Regression model) for Saudi Arabia.
To address the results of this forecast, it is highly
recommended that Garuda Indonesia increase its seat
capacity for flights to China and Saudi Arabia. This
can by increasing the frequency of flights to China
and Saudi Arabia, as well as opening routes directly
from secondary cities in Indonesia to China or Saudi
Arabia, and vice versa. The increase in the number of
seats also needs to be supported by good fleet
planning, which is the planning of the number of
aircraft that can meet the demands for both routes,
which must also be balanced with the company's
financial capability.
Forecasting Airline Passenger Demand for the Long-Haul Route: The Case of Garuda Indonesia
535

5 CONCLUSIONS
The paper presents the forecasting analysis of airline
passenger demand for the long-haul routes at Garuda
Indonesia, the legacy airline of Indonesia. We
compare two forecasting methods, which are suitable
for the purpose, namely an adjusted regression model
from Carreira et al. (2017) and Winter’s model with
optimal smoothing constants.
The results show that the regression model is
more suitable for Saudi Arabia route, while Winter’s
model is more suitable for China route as indicated
by the forecast error values.
The results may be due to the fact that China
demand shows a seasonal pattern in each year, while
for Saudi Arabia route, the passenger demand is
mainly depending on the Hajj season and Ramadan
season which are moving forward in approximately
10 days every year.
Forecast results for 2019-2028 show that the
demand for Saudi Arabia and China grow at the rate
of 6% and 9% and reach 900.000 and 1.6 million
passengers in 2028 respectively. The results imply
that Garuda Indonesia must anticipate the growth by
increasing the seating capacity by increasing the
flight frequency and/or using larger aircraft.
This study has limitations. Even though demand
data from Garuda Indonesia is monthly data,
however, the population data in annual data, thus,
forecasting is conducted using annual data, that may
not accurately reflect the actual situation.
Future research may include using the resulting
forecast for strategic fleet planning, to maximize the
profitability of the airline.
ACKNOWLEDGEMENTS
We would like to thank Garuda Indonesia, especially
the Market Research Department for their support in
this study.
REFERENCES
Airbus. (2013) Future Journeys. Global Market Forecast
2013. Blagnac Cedex, France.
Boeing (2013) ‘Current Market Outlook 2013-2032’,
Boeing-Website, pp. 2013–2014. Available at:
http://www.boeing.com/boeing/commercial/cmo/.
Carreira, J. S., Lulli, G. and Antunes, A. P. (2017) ‘The
airline long-haul fleet planning problem: The case of
TAP service to/from Brazil’, European Journal of
Operational Research. Elsevier B.V., 263(2), pp. 639–
651. doi: 10.1016/j.ejor.2017.05.015.
Chen, Z., Tzeremes, P., Tzeremes, N.G. (2018)
Convergence in the Chinese airline industry: A
Malmquist productivity analysis. Journal of Air
Transport Management, pp. 77-86.
Chopra, S., Meindl, P. (2016) Supply Chain Management
Strategy Planning and Operation, 6
th
Ed. Essex:
Pearson.
Flyvbjerg, B., Skamris, M. K., Buhl, S. L. (2005) How (in)
accurate are demand forecasts in public works projects?
The case of transportation, 131-146.
Gelhausen, M. C., Berster, P. and Wilken, D. (2018) ‘A new
direct demand model of long-term forecasting air
passengers and air transport movements at German
airports’, Journal of Air Transport Management.
Elsevier Ltd, 71(April), pp. 140–152. doi:
10.1016/j.jairtraman.2018.04.001.
Heizer, J., Render, B., Munson, C. (2017). Operation
Management Sustainability and Supply Chain
Management, I2th Ed, Boston: Pearson.
Hsu, C. I. et al. (2011) ‘Aircraft replacement scheduling: A
dynamic programming approach’, Transportation
Research Part E: Logistics and Transportation Review.
Elsevier Ltd, 47(1), pp. 41–60. doi:
10.1016/j.tre.2010.07.006
Jakarta Post. (2018) Chinese tourists' favorite places in
Indonesia. [Online] Available at:
https://www.thejakartapost.com/travel/2018/03/02/chi
nese-tourists-favorite-places-in-indonesia.html
[Accessed 19th January 2019].
Klker, K., Bießlich, P. and Ltjens, K. (2016) ‘From
passenger growth to aircraft movements’, Journal of
Air Transport Management, 56(Part B), pp. 99–106.
doi: 10.1016/j.jairtraman.2016.04.021.
Pyke, D. and Sibdari, S. (2018) ‘Risk Management in the
Airline Industry’, Finance and Risk Management for
International Logistics and the Supply Chain, pp. 293–
315. doi: 10.1016/b978-0-12-813830-4.00012-5.
Susanty, F., Ramadhani, N. F. (2017) Indonesians love of
Mecca boosts lucrative ‘umrah’ business. [Online]
Available at: https://www.thejakartapost.com/ news/
2017/01/21/indonesians-love-of-mecca-boosts-lucrative
-umrah-business.html [Accessed 18th January 2019].
Wiesner, J. D., Choon, K., Leong, G. K. (2019). Principles
of Supply Chain Management, 5
th
Ed, Mason: Cengage
Learning.
Worldometers, 2019. http://www.worldometers.info.
[Online]Available at: http://www.worldometers.info
/world-population/china-population/ [Accessed 15
january 2019].
Worldometers, 2019. http://www.worldometers.info.
[Online] Available at: http://www.world
ICIB 2019 - The 2nd International Conference on Inclusive Business in the Changing World
536

ometers.info/world-population/saudi-arabia-
population/ [Accessed 15 january 2019].
Xie, G., Wang, S. (2014) Short-term forecasting of air
passenger by using hybrid seasonal decomposition and
least squares support vector regression approaches.
Journal of Air Transport Management, 20-26.
Xu, S., Chan, H. K. and Zhang, T. (2019) ‘Forecasting the
demand of the aviation industry using hybrid time
series SARIMA-SVR approach’, Transportation
Research Part E: Logistics and Transportation Review.
Elsevier, 122(October 2018), pp. 169–180. doi:
10.1016/j.tre.2018.12.005.
Forecasting Airline Passenger Demand for the Long-Haul Route: The Case of Garuda Indonesia
537
