
Analysis of Hedonic Shopping Motives to H&M Paris Van Java
Bandung Consumers
Arianis Chan, Pratami Wulan Tresna and Firna Firliana
Business Administration Padjadjaran University, Jl Raya Bandung Sumedang km 21, Sumedang, Indonesia
Keywords: Consumer Behavior, Buying Motive, Hedonic Shopping Motive.
Abstract: This study aims to study and find out the hedonic shopping motives to the consumers of H&M Paris Van
Java. The object examined in this research is hedonic shopping motives. The research method used is
comparative descriptive research with survey design. The sampling technique is non-probability sampling
using incidental sampling with 63 people who were made as the respondents. The primary data collection is
by questionnaires, observations, and interviews to obtain an overview of hedonic shopping motives and the
secondary data obtained is by literature study. The data analysis technique used is explanatory factor
analysis using SPSS. The result of this research shows that there are hedonic shopping motives which are
dominant to the consumers of H&M Paris Van Java, namely gratification shopping. The suggestions that the
writers propose are hedonic shopping motives to the consumers of H&M Paris Van Java can be used as a
benchmark for H&M in terms of market opportunities to increase sales by additional attractive offers beside
the comfort-shopping.
1 INTRODUCTION
Increasing the needs and desires of a community
encourage the availability of various product
choices. As one of the primary needs, the need for
clothing is increasing but it is not only the clothing
but also the latest fashion which shows a trend and
lifestyle. This is proven by the development of the
fashion industry.
The increasing people’s interest in fashion, as
well as their purchasing power of also, supports the
development of retail business in Indonesia,
especially in the fashion sector. Based on the GRDI
index, Indonesia is ranked fifth out of thirty
developing countries in the world with a score of
55.6 and retail sales of USD324 billion
(www.beritasatu.com).
As a potential market, the retail fashion industry
in Indonesia is increasing both for local and
international brands. One of the Swedish brands
developing in Indonesia is H&M. Its "stylish and
affordable fashion at the best price" concept means
that H&M products have good quality. It is one of
the leading multinational brands. So, consumers
must have the motivation to shop. oOpen research to
thirty-one consumers of H&M Paris Van Java in
Bandung City shows that there are negative and
positive phenomena related to hedonic shopping
motives. Respondents from this pre-research are
consumers of H&M Paris Van Java. The researcher
found a phenomenon in each sub-variable of hedonic
shopping motives.
Based on the result of the pre-research, there are
allegations that the consumers of H&M Paris Van
Java Bandung are included in the type of hedonic
shopping motives despite the negative phenomena,
namely gratification shopping, and idea shopping.
The initial findings are as follows:
1. Layout. Lighting makes consumers feel
comfortable when shopping at H&M but;
2. not all consumers feel their mood is getting
better.
3. Consumers feel happy when shopping at H&M
Paris Van Java with family or friends.
4. Consumers do not look for the latest trend in
H&M.
5. For consumers, a discount is the main
attraction at H&M Paris Van Java.
6. H&M Paris Van Java products are suitable to
be treated as gifts to friends or family.
544
Chan, A., Tresna, P. and Firliana, F.
Analysis of Hedonic Shopping Motives to HM Paris Van Java Bandung Consumers.
DOI: 10.5220/0008433505440554
In Proceedings of the 2nd International Conference on Inclusive Business in the Changing World (ICIB 2019), pages 544-554
ISBN: 978-989-758-408-4
Copyright
c
2020 by SCITEPRESS – Science and Technology Publications, Lda. All rights reserved

2 LITERATURE
2.1 Consumer Behavior
Consumer behavior is an activity and process related
to searching, using, and purchasing products and
services. The behavior underlies or influences
consumers to make a decision in the use of a product
or service. Consumer behavior according to Engel et
al. (1994: 3) is "actions that are directly involved in
acquiring and consuming products and services,
including processes that precede and follow from
those actions". Meanwhile, according to Schiffman
and Kanuk (2008: 6), "consumer behavior is the way
individuals make a decision to utilize their available
resources (time, money, business) to buy goods
related to their consumption".
2.2 Consumer Motivation
2.2.1 Definition of Consumer Motivation
There is always an urge to taking action from
various human activities. Thus, this encouragement
can be called motivation. Every consumer has an
action taken to achieve his desire to obtain and
consume a product in the form of goods or services.
According to Setiadi (2008: 26), “motivation can be
interpreted as a willingness to issue a high level of
effort toward the goals to be achieved, conditioned
by the ability of efforts to meet an individual’s
need". While the definition of motivation according
to Schiffman Kanuk (2008: 72), “motivation can be
described as a driving force of individuals which
force them to act".
According to the American Encyclopedia in
Setiadi (2008: 94), “motivation is a tendency (a trait
which is the subject of conflict) at someone who
raises support and action. Motivation includes the
factor of biological and emotional needs that can
only be expected from observers of human
behavior".
Schiffman Kanuk (2008: 78-79) divides
motivation into rational and emotional motivation.
1. Rational motivation
The term rationality is a traditional term which
assumes that consumers behave rationally if
theycarefully consider all alternatives and choose
alternatives that give them the greatest usage.
2. Emotional motivation
On emotional motivation, consumers do not
attach importance to the use of the product.
However, it makes sense to assume that consumers
always try to choose alternatives that in their view
help to maximize decisions.
2.2.2 Shopping Motivation
Shopping motivation can be divided into two (Sheth,
1983; Kim, 2006 in Arifianti 2010: 77), namely:
1. Utilitarian shopping motivation which is based
on functional needs or providing practical
benefits; and
2. Hedonic shopping motives which are
associated to Maslow's motivation theory and
the hedonic shopping motives’ highest rank,
namely the social factor. Hedonic motivation
emphasizes self-esteem from others compared
to the needs of others. Consumers feel that the
desire to actualize can defeat the desires of
others.
Utilitarian and hedonist are behaviors that arise
when a consumer is faced with a decision to buy a
product or service (Hirshman & Holbrook, 1982;
Herabadi et al., 2009).
Utilitarian Shopping Motivation.
According to Chaudhauri and Holbrook (2001),
utilitarian motivation is the ability to perform
functions in the daily life of a consumer. Holbrook
and Hirschman (1982) mention that utilitarian values
show the use of products or services efficiently,
task-specific and economically. Babin et al. (1994)
and Batra and Ahtola (1990) in Arifianti (2010: 77)
specifically say that utilitarian consumer behavior is
described as functional or task-related perspectives.
Additionally, Babin et al. (1994) in (Arifianti 2010:
77) elaborates that utilitarian shopping behavior is
characterized by task-related motivation, product-
oriented, rational, and extrinsic. Being utilitarian
itself is encouraged because it feels benefits received
when using a product or service rather than getting a
pleasant taste of its products (Lim & Ang, 2008).
Utilitarian motives are usually judged with more
conscious intentions (Babin et al., 1994). Utilitarian
purchasing motives include desires, like a search for
convenience, diverse search, looking for qualified
products or services, and reasonable price level
(Sarkar, 2011: 58).
Engel et al. (2000) say that utilitarian motivation
is: "when someone will shop and someone feels that
they get the benefits of a product they want. This
motivation is based on objective thinking. Thus,
utilitarian shopping motivation is a motivation
where consumers do shopping activities because
they really need or want to get the benefits of the
product itself. There are two things that must be
Analysis of Hedonic Shopping Motives to HM Paris Van Java Bandung Consumers
545

considered in utilitarian motivation, namely quality
of goods and quality of service".
Babin et al. (1994) mention that consumer
consumption activities can produce both utilitarian
and hedonic values. Meanwhile, the utilitarian value
is described as a matter that comes from several
types of consciousness to pursue intended
consequences. The concept of utilitarian value can
be regarded as a task-oriented and rational thing and
it can also be said as work. Consumer evaluation
from the point of view of utilitarian value is usually
based on the function of a product or service that it
consumes. In other words, consumer evaluation
based on utilitarian values includes the fulfillment of
instrumental consumer expectations that can be
obtained from consumer consumption of a product
or service. It also includes the existence of rational
motivation that looks at the time consumption takes
place and the need for ownership.
Based on this utilitarian value’s perspective,
consumers are seen as more concerned with
purchasing products or services that can streamline
their cost and their time to achieve goals with
minimum disruption. According to Babin et al.
(1994), consumers who are concerned with the
utilitarian aspect will even feel happy if they have
completed their shopping activity because they feel
their task has been completed.
Hedonic Shopping Motives.
It is a general understanding that hedonic or
hedonism is a thought held by individuals about
pleasure which solely fulfills the satisfaction of that
individual. The definition of a hedonic shopping
motive according to Arnold and Reynold (2003) is a
behavior of customer which views an activity as
enjoyable and exciting experiences.
Setiadi (2013:96) defines hedonic shopping as
psychological needs, such as satisfaction, prestige,
emotion, and other subjective feelings. These needs
often appear to meet social and aesthetic demand
which is also called emotional motives.
Boedeker (in Trang, Tho, and Barret, 2006) adds
that hedonic shopping motivation is a pleasant
shopping experience rather than gathering
information or purchasing products. Whereas in the
study of Engel and Minard (2000) in Kusuma et al.
(2013:242), hedonic shopping motivation is a
person's motive to shop based on emotional
responses, sensory pleasures, dreams, and aesthetic
considerations.
Gültekin and Özer (2012:181) in their research
elaborate that
"Hedonism emphasizes the basic philosophy of
taking pleasure in life and avoiding sadness and
sorrow (Murray, 1964). Consumer experience arises
following the hedonic shopping experience. From
that perspective, hedonic shopping comprises issues,
such as cheer, jealousy, fear, passion, and joy. Those
emotions are the phenomenon which relates to the
motives (Hirschman and Holbrook, 1982)".
Bhatnagar and Ghosh (2004) mention that
hedonic motivation is a purchase motivation based
on the individual's emotional needs which are
primarily intended for pleasure and comfort. In
addition, Solomon (2007) explains that hedonic
motivation refers to intensive experimental and
emotional for consumers to be engaged in shopping
activity. Consumers with their motivation based on
hedonic needs can be involved in a shopping-related
activity that involves multisensory, fantasy, and
emotional experiences (Solomon, 2007). Holbrook
and Hirschman (1982) add that hedonic motivation
can be associated with fun and playfulness rather
than completing tasks.
In Sarkar (2011: 59), it is stated that:
“Hedonic consumption involves emotional
arousal taking place while purchasing or consuming
(Holbrook & Hirschman, 1982 b). In hedonic
consumption, different types of emotional feelings,
which are both physiological and psychological,
play major roles. Hopkinson & Pujari (1999) have
explained how hedonic consumption takes place in a
high-involvement situation, where an individual is
deeply involved in experiencing a consumption
event. This research points out that the level of
hedonism varies across products or brands depends
on the changing levels of involvement. In high-
involvement consumption situations, the level of
hedonism is expected to be higher”.
According to Toa et al. (2007: 775):
"Hedonic motivation refers to those consumption
behaviors in search for happiness, fantasy,
awakening, sensuality, and enjoyment. The benefit
of hedonic motivation is experiential and emotional.
The reason that hedonic consumers love to shop is
that they enjoy the shopping process. It is not about
obtaining the physical objectives or completing the
mission".
In the study of Babin et al. (1994):
“Increased arousal, heightened involvement,
perceived freedom, fantasy fulfillment, and escapism
all may indicate a hedonically valuable shopping
experience (Bloch and Richins 1983b; Hirschman
1983). Furthermore, vicarious consumption can
provide hedonic value by allowing a consumer to
ICIB 2019 - The 2nd International Conference on Inclusive Business in the Changing World
546

enjoy a product's benefits without purchasing it
(Macinnis and Price 1987)”.
Meanwhile, Arnold and Reynold (2003:80)
classify hedonic motivation into six types, namely:
1. Adventure Shopping
Adventure shopping leads to shopping
activities aimed at stimulation, adventure, and
the feeling of being in another world.
Adventure shopping provides sensation and
excitement and enters the world that is
different from interesting sights, smells, and
sounds.
2. Social Shopping
Social shopping is a purchase motivation that
refers to the enjoyment of the atmosphere of
togetherness, shopping with friends and family,
and socializing and uniting while shopping.
Shopping people say they really enjoy
socializing with other visitors when shopping
and shopping can provide an opportunity to
blend with other shopping people.
3. Gratification Shopping
Gratification shopping is a form of shopping
activity in which someone's involvement in
shopping is done with the aim of relieving
stress as an alternative to eliminate negative
moods. The shopping activity is used to
improve mentality.
4. Idea Shopping
Idea shopping is a form of shopping activity
used to find out the latest trend, fashion, and
innovation.
5. Role Shopping
Role shopping is a shopping activity in which
someone does it for someone else. Someone
will be happy to include purchase and hope that
the person who is given the gift will feel happy.
6. Value Shopping
Value shopping shows that all buyers enjoy
purchasing discount items and looking for
offers and discounts. Overall, buying items for
lower prices leads to an increase in customer
satisfaction and happiness.
Utami (2006) in Ira (2008) in Kusuma et al.
(2013:242) mentions six hedonic shopping
motivations:
1. Adventure shopping motivation occurs when
consumers shop for stimulation, adventure, and
the feeling of being in their own world.
2. Gratification shopping motivation occurs when
consumers shop to relieve stress, to alleviate
negative moods, and to forget about present
problems.
3. Role shopping motivation happens when
consumers enjoy shopping for others rather
than for their own selves.
4. Value shopping for consumers who offer
shopping discounts, sales, or bargains.
5. Social shopping motivation occurs when
consumers feel enjoyment and gain
information from potential products by
shopping with their family and friends and
view shopping as a social activity with
consumers or workers at the mall.
6. Idea shopping is a motivation that happens
when consumers shop to keep up with the latest
trend and see new products and innovations.
Irawan in Arifianti (2010:75) as the Chairman of
Frontier Consulting Group shares the character of
Indonesian consumers who support consumers to
buy a product due to the hedonic nature of the
consumers themselves, namely:
1. Consumers who tend to focus on the context
rather than the content because consumers do
not digest the amount of sufficient information
before deciding to choose and buy a product.
2. Consumers who like foreign products.
3. Consumers who do not have a plan.
4. Consumers who like the praise they get from
their surrounding environment will show their
status.
3 RESEARCH METHOD
3.1 Research Object
The object of this research is hedonic shopping
motives as a single variable which includes sub-
variables of adventure shopping, social shopping,
shopping gratification, idea shopping, role shopping,
and value shopping for consumers who shop at
H&M Paris Van Java Bandung.
3.2 Research Method
The type of method used by the writers in this
research is quantitative method of descriptive
analysis with an explanatory approach.
3.2.1 Exploration Factor Analysis (EFA)
Exploration Factor Analysis (EFA) is the process of
identifying meaning, construction, or dimension
evaluated by the observed covariance (Panter, 1997).
Gorsuch (1983) in Crowley & Fan (1997) says that
EFA is useful for the purpose of generating
Analysis of Hedonic Shopping Motives to HM Paris Van Java Bandung Consumers
547

structures, theoretical models, and testing
hypotheses.
The basic theory of factor analysis:
V
T
= V
co
+ V
sp
+ V
e (1)
V
co
: common variance, i.e. the variance possessed
by ≥ 2 estimated variables of communality: h
2
= ai + bi + ci
V
sp
: specific variance which is the variance with
only 1 measurement (unique)
EFA can be interpreted as a method for
identifying items or variables based on their
similarity as indicated by high correlation values so
then they will form a factor. Exploration factor
analysis is a method of factor analysis to identify the
relationship between manifested variables or latent
variables in constructing a construct. Researchers
can use SPSS software to analyze EFA by inputting
data from indicator variables. A measure which
indicates that an indicator is put into a particular
indicator in the EFA is the value of the loading
factor. When the factor value is loading a larger
indicator against one particular factor, then the
indicator can be grouped into these factors.
Factor analysis in this research uses the Kaiser-
Meiyer-Olkin (KMO) method whose value more
than 0.5 and the Measure of Sampling Adequacy
(MSA) measurement method. The variable selection
process in this research is:
a. Kaiser-Meiyer-Olkin (KMO) and Barlette’s
Test.
The KMO test is conducted to determine what
factors are valid or not in this research. Based on
Gozali’s research (2009:307), KMO figures and
Barlette’s test must be above 0.5. The provision is
based on these criteria:
1) If the probability of ∑ < 0.05 then the
research variable cannot be analyzed further.
2) If the probability of ∑ > 0.05 then the
research variable can be analyzed further.
b. Anti Image Matrics.
Gozali (2011:304) elaborates that to see which
variables are feasible to be made a factor analysis
and to find out the factors used as the factors of
analysis has a strong correlation or not with a value
greater than or equal to 0.5. If the value is greater or
equal to 0.5 then all the factors forming the variable
are valid and there are no reduced factors. In the
Anti-image Correlation section, the first to be issued
is a variable that has the smallest MSA value and
less than 0.5. The number of MSA ranges from 0
and 1 with the following criteria:
1) MSA = 1, the item can be predicted without
error by another item.
2) MSA > 0.5, the item can still be predicted
and analyzed further
3) MSA < 0.5, the item cannot be predicted and
cannot be analyzed further.
c. Eigenvalue.
The eigenvalue is used to analyze the feasibility of a
new factor. The eligible requirement to be a new
factor is eigenvalue greater than or equal to 1,
whereas if there is a factor that has an eigenvalue
less than 1 then the factor will be issued or not be
used.
d. Cumulative Variance.
The cumulative value of the variance shows the
level of representation of new factors formed on the
initial or original factor. If the new factors formed
are able to represent the initial or original factor,
then the cumulative value of variance is > 60%.
e. Loading Value.
The loading value aims to determine whether a
variant fits into a new factor or not. This loading
value can be seen from eigenvalue. If the eigenvalue
is more than 1, then the variance is worth entering
into a new factor.
In this research, the first step in factor analysis is
to assess eighteen statements that will form hedonic
shopping factors.
The data are processed using the SPSS 25.0
software tool. Eighteen items that have been
considered valid and reliable, then enter into factor
analysis to be tested whether the value is greater
than the value of KMO and Barlett's Test above 0.5
which is the initial stage in the factor analysis.
4 RESULT AND DISCUSSION
4.1 Exploratory Factor Analysis Test
Results
The factor analysis is used to reduce eighteen
manifest variables (statement items) into latent
variables (factors) that can provide an overview of
the dominant factors in hedonic shopping. From the
result of processing statistical test through Statistical
Package for the Social Sciences (SPSS) Version
25.0, several indicators are obtained stating that data
processing with the factor analysis is indeed suitable
for this research. There are four stages in the EFA
analysis.
ICIB 2019 - The 2nd International Conference on Inclusive Business in the Changing World
548
Kaiser-Meiyer-Olkin (KMO) and Barlette's Test
All Items.
The Kaiser-Meiyer-Olkin value for Measure of
Sampling Adequacy obtained is 0.738 in which this
value states the amount of data needed for the factor
analysis. The KMO value for Measure of Sampling
Equity is above 0.5. It is the minimum limit of KMO
for the use of factor analysis.
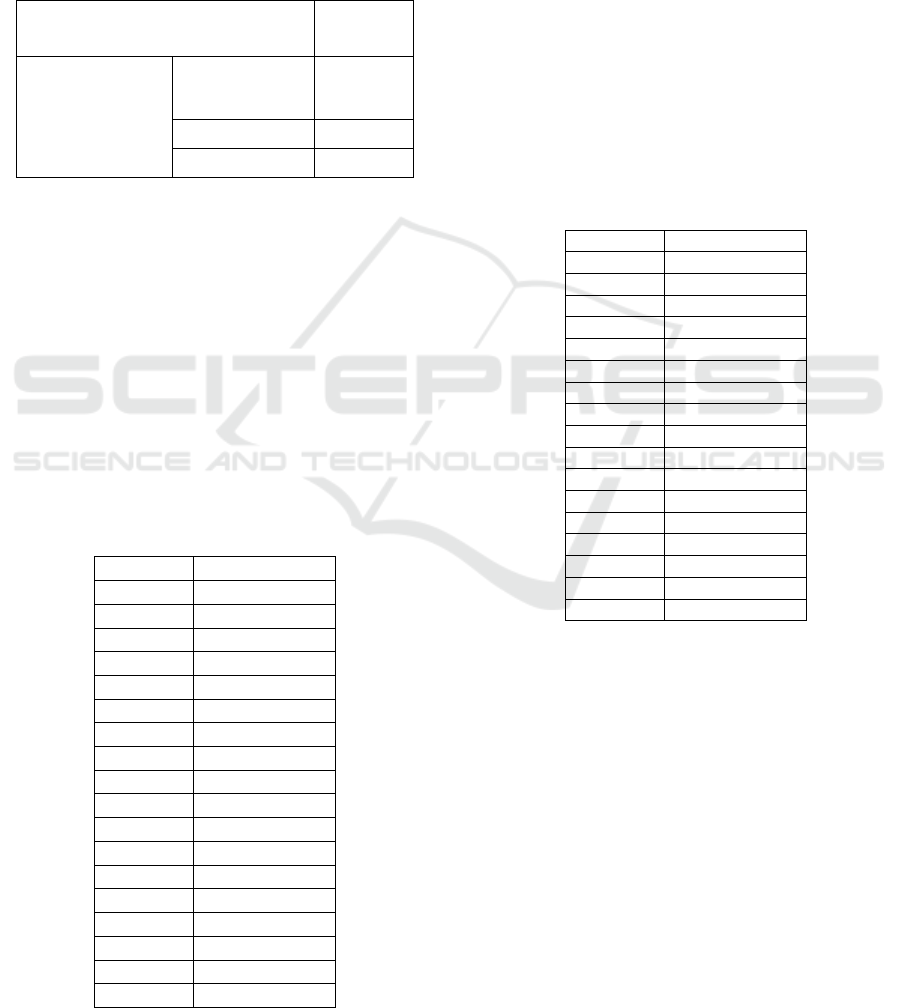
Table 1: KMO and Bartlett's Test All Items.
Kaiser-Meyer-Olkin Measure of
Sampling
Adequacy.
.738
Bartlett's Test of
Sphericity
Approx.
Chi-Square
617.797
Df
153
Sig.
.000
The Bartlett Test of Sphericity value obtained is
617.797 with the significance of 0.000. This value
gives an indication that the correlation matrix
formed is not an identity matrix. Because the
correlation matrix is not an identity matrix, the
factor analysis can be used to process the data.
Anti Image Matrics for All Items.
Testing the value of MSA (Measure of Sampling
Adequacy) can be seen in the Anti Image Matrics
with the provision that if the MSA is > 0.5 then the
item can still be predicted and analyzed further. The
following are the results of MSA measurements:
Table 2: Value MSA All Items.
No. Item
MSA
1
0,748
2
0,803
3
0,514
4
0,628
5
0,662
6
0,749
7
0,836
8
0,839
9
0,804
10
0,797
11
0,769
12
0,847
13
0,466
14
0,643
15
0,824
16
0,636
17
0,790
18
0,574
Based on the results of processing the data
above, it can be seen that there is one factor that
does not meet the 0.5 limits so that these factors will
be removed from the matrix and the test will be
repeated.
Test Kaiser-Meiyer-Olkin (KMO) and Barlette's
Test Worthy Items.
The following are the results of testing the KMO and
Barlett Test and MSA (Measure of Sampling
Adequacy) after retesting.
Based on the results of the retesting, it is seen that
the KMO and Barlett’s Test number is 0.765 with
the significance far below 0.5 (0.000 < 0.05), then
the existing variables can still be analyzed further.
Furthermore, the following are the results of the re-
test of the MSA (Measures of Sampling Adequacy);
Anti Image Matrics Worthy Items.
Table 3: MSA Value Test Results.
No. Item
MSA
1
0,772
2
0,805
3
0,507
4
0,619
5
0,651
6
0,763
7
0,826
8
0,836
9
0,865
10
0,797
11
0,774
12
0,840
14
0,859
15
0,863
16
0,628
17
0,783
18
0,550
After items that do not meet the criteria > 0.5 are
not included in this research, the results above show
all MSAs above 0.5 and can be analyzed further.
Cumulative Variance and Eigenvalue.
The analysis of communality, this analysis is
basically the amount of variance (can be in
percentages) of an initial variable that can be
explained by existing factors. The communality
value requirement is greater than 0.5 (Santoso, 2011:
82). The following is the results of the communality
analysis of the remaining seventeen items and
further testing.
Analysis of Hedonic Shopping Motives to HM Paris Van Java Bandung Consumers
549
Table 4: Results of Communalities Analysis.
Initial
Extraction
P1
1.000
.566
P2
1.000
.792
P3
1.000
.541
P4
1.000
.690
P5
1.000
.808
P6
1.000
.625
P7
1.000
.711
P8
1.000
.799
P9
1.000
.793
P10
1.000
.843
P11
1.000
.802
P12
1.000
.812
P14
1.000
.439
P15
1.000
.629
P16
1.000
.822
P17
1.000
.774
P18
1.000
.763
From the communality table above, it can be
seen that those seventeen items have communal
values above 0.5 so that all of these variables can be
tested using further factor analysis. Furthermore,
based on the table above, it can be seen that the
value for item 1 is 0.566 which means 56.6% of the
variation in item 1 can be explained by the factors
formed. Likewise the explanation for the value of
the next variables, with the provision that the greater
value of communality a manifest variable (item), the
closer the relationship with the variables formed
(Santoso, 2011: 82).
The next process of factor analysis is testing
Total Variance Explained. According to Santoso
(2011: 85), the table of Total Variance Explained
describes the number of factors formed. To
determine the factors formed, it must be seen that
the eigenvalue value must be above 1. If it is already
under 1 then none factor is formed. Eigenvalue
shows the relative importance of each factor in
calculating the variance of the total variable
presented. The number of eigenvalue number is
always sorted from the largest to the smallest value.
The following is the result of the total variance test
explained from this research.
As previously explained, to determine the factors
formed, it must be seen that the eigenvalue must be
above 1. If it is already under one 1 then none factor
is formed. From the table above, it is known that
there are five factors formed because from factor
number 1 to 5, the eigenvalues are still above 1; that
is 1.183. Whereas for other factors, the eigenvalue
number is below 1, which is 0.978.
Table 5: Total Variance Explained Test Results.
Extraction Method: Principal Component Analysis
So, the factoring process stops at five factors. Up
to this process, it can be seen that seventeen items
included in the factor analysis formed five factors.
This shows that there are groupings of items into
certain factors because there are similarities in the
characteristics of certain variables.
The number of factors in the analysis of this
factor is determined based on the value of the
cumulative proportion. If the value of the cumulative
proportion ranges from 60%—70%, then the
component can be selected as a component or main
factor. Based on these provisions, there are five main
components which have a cumulative proportion
ranging from 60%—70%. So, those five main
components are the summary of the best information
from the number of items analyzed. In the table
above it explains the formation of five factors after
the simplification of some of the original items.
The first factor is able to explain 36.817% of the
diversity of the total items of research. In the second
factor, it explains 12.286% of the total diversity
while the third factor can explain 8.32%. The fourth
one explains 7.351% of total diversity and the fifth
factor can explain 6.959%. So the five cumulative
factors formed can account for 71.804% of the total
diversity of the research items.
Loading Value.
The next step is to determine the dominant items at
each of these components. This can be seen from the
Component Matrix table which shows the
distribution of the research items in the five factors
formed. The Component Matrix consists of the
initial items for the factors formed. An item can be
determined to enter which factor by looking at the
magnitude of the weighting factor for each item
against the five matrices of the factors formed.
Component
Initial Eigenvalues
Extraction Sums of Squared
Loadings
Rotation Sums of Squared
Loadings
Total
% of
Variance
Cumulative
%
Total
% of
Variance
Cumulative
%
Total
% of
Variance
Cumulative
%
1
6.259
36.817
36.817
6.259
36.817
36.817
3.846
22.621
22.621
2
2.089
12.286
49.103
2.089
12.286
49.103
2.496
14.680
37.301
3
1.427
8.392
57.495
1.427
8.392
57.495
2.113
12.430
49.732
4
1.250
7.351
64.846
1.250
7.351
64.846
1.927
11.333
61.065
5
1.183
6.959
71.804
1.183
6.959
71.804
1.826
10.740
71.804
6
.978
5.755
77.559
7
.727
4.279
81.838
8
.650
3.821
85.659
9
.511
3.004
88.663
10
.416
2.447
91.109
11
.337
1.982
93.091
12
.290
1.706
94.797
13
.237
1.397
96.194
14
.196
1.153
97.347
15
.177
1.042
98.389
16
.149
.875
99.264
17
.125
.736
100.000
ICIB 2019 - The 2nd International Conference on Inclusive Business in the Changing World
550
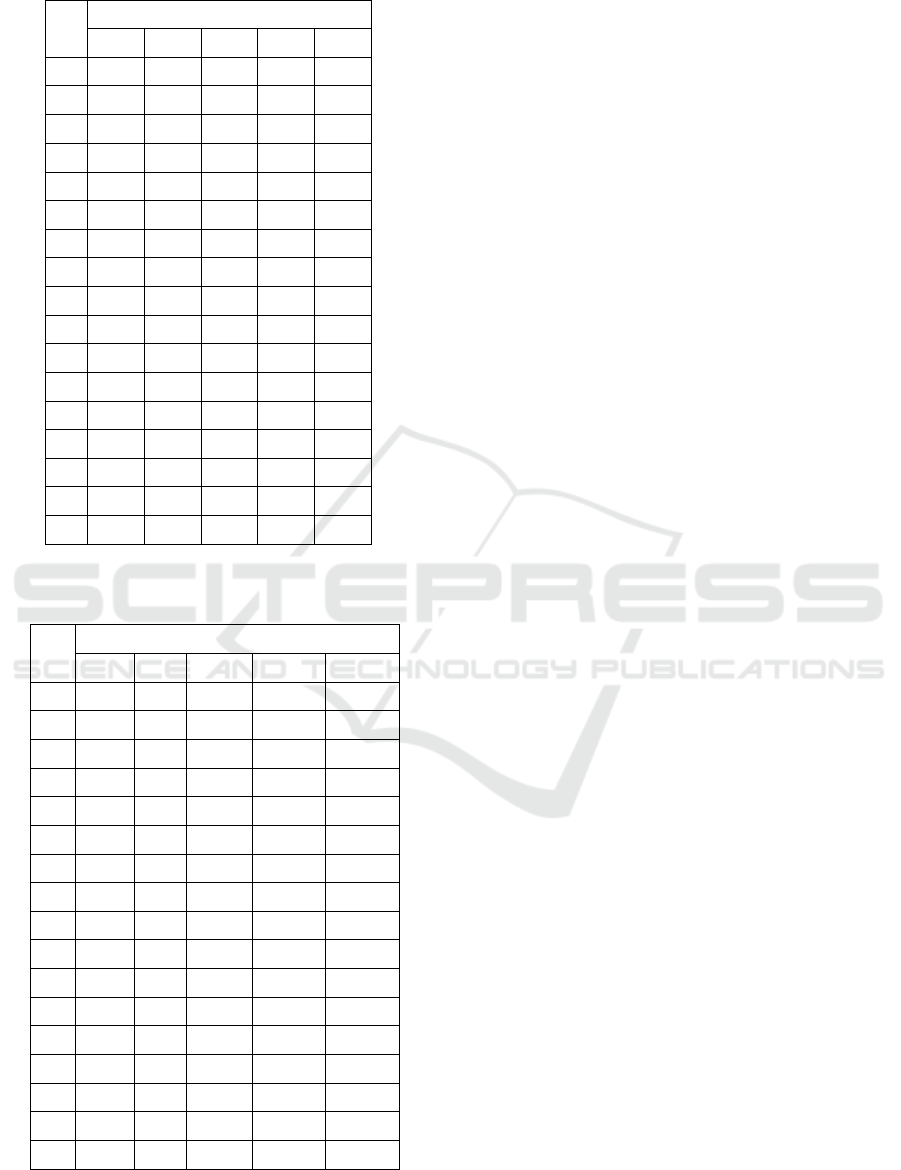
Table 6: Component Matrixa Test Result.
Component
1
2
3
4
5
P1
.682
-.062
-.223
.202
-.073
P2
.569
.258
-.341
-.528
.082
P3
.374
.439
-.347
-.258
.143
P4
.464
.540
.123
.400
.090
P5
.462
.495
.068
.516
.280
P6
.612
.282
-.170
.222
.303
P7
.711
-.284
-.069
.197
-.286
P8
.730
-.438
-.160
.126
-.181
P9
.768
-.404
.002
.068
-.185
P10
.720
.128
.326
-.279
-.351
P11
.674
.363
.303
-.287
-.205
P12
.643
.422
.414
-.121
-.182
P14
.542
-.195
-.257
.175
-.106
P15
.709
-.122
-.335
-.010
-.002
P16
.481
-.296
.354
-.213
.577
P17
.583
-.334
-.127
-.248
.494
P18
.379
-.442
.609
.125
.192
Table 7: Rotated Component Matrixa Test Result.
Component
1
2
3
4
5
P1
.656
.129
.290
.065
.172
P2
.223
.313
.013
.134
.791
P3
.056
.155
.247
-.026
.672
P4
.097
.288
.770
-.049
.054
P5
.107
.113
.882
.058
.050
P6
.311
.070
.614
.189
.332
P7
.793
.252
.102
.071
-.049
P8
.861
.136
.005
.199
.018
P9
.800
.282
.007
.270
-.027
P10
.357
.827
.036
.121
.120
P11
.173
.811
.201
.108
.252
P12
.121
.810
.346
.094
.107
P14
.638
.022
.134
.043
.111
P15
.664
.101
.146
.157
.364
P16
.111
.151
.077
.882
.056
P17
.386
-
.042
.012
.697
.372
P18
.232
.249
.055
.648
-.473
At first, the extraction is still difficult to
determine the dominant item included in the factor
because the correlation value is almost the same as
the several items. To overcome this problem, a
rotation that is able to explain the distribution of
variables that are clearer and more real is done. The
following table shows the rotation result to clarify
the position of the variable on the factor.
In this research, the rotation used is the varimax
method. The mechanism of rotation of varimax is to
make item correlation only dominant to one factor.
The method is to make the item correlation close to
absolute value 1 and 0 on each factor. It makes it
easier in interpreting the dominant items. It can be
seen that after rotation, it is easier to determine to
factor one up to the fifth factor. The highest value of
the loading factor (red letter) shows the items
incorporated in one factor. From the result of the
table above, it can be described as the spread of the
existing factors as follows:
FACTOR 1: Consisting of six factors including P1
derived from Adventure Shopping sub-variable; P7,
P8, and P9 derived from Shopping Gratification sub-
variable; P14 and P15 derived from Role Shopping
sub-variables. This factor is incorporated in the
GRATIFICATION SHOPPING FACTOR.
FACTOR 2: Consisting of two factors including P11
and P12 derived from the Idea Shopping sub-
variable. This factor is incorporated in the
SHOPPING IDEA FACTOR.
FACTOR 3: Consisting of three factors including
P4, P5 and P6 derived from the Social Shopping
sub-variable. This factor is incorporated in the
SOCIAL SHOPPING FACTOR.
FACTOR 4: Consisting of three factors including
P16, P17 and P18 derived from the Value Shopping
sub-variable. This factor is incorporated into the
VALUE SHOPPING FACTOR.
FACTOR 5: Consisting of two factors including P2
and P3 derived from the Adventure Shopping sub-
variable. This factor is incorporated in the
ADVENTURE SHOPPING FACTOR.
Based on the result, it can be explained that the
factors that influence hedonic shopping are shopping
gratification, idea shopping, social shopping, value
shopping, and adventure shopping. Of all eighteen
items, there is one factor that must be reduced
because the value produced after several stages of
factor analysis does not meet the requirement until
the last stage. It results in seventeen items of factors
are truly dominant and affect hedonic shopping.
Analysis of Hedonic Shopping Motives to HM Paris Van Java Bandung Consumers
551
4.1.1 Dominant Factor Analysis
Based on the proportion of variance that can be
explained by each factor, factor 1 is the first rank
that most influences Hedonic Shopping.
FACTOR 1: Gratification Shopping is able to
explain 36.817% regarding Hedonic Shopping.
FACTOR 2: Idea Shopping is able to explain
12.286% regarding Hedonic Shopping.
FACTOR 3: Social Shopping is able to explain
as much as 8.32% regarding Hedonic Shopping.
FACTOR 4: Value Shopping is able to explain
7.351% regarding Hedonic Shopping.
FACTOR 5: Adventure Shopping is able to
explain 6.959% regarding Hedonic Shopping.
In accordance with the proportion of variance in
each factor, the following can show the ranking of
the dominant factors.
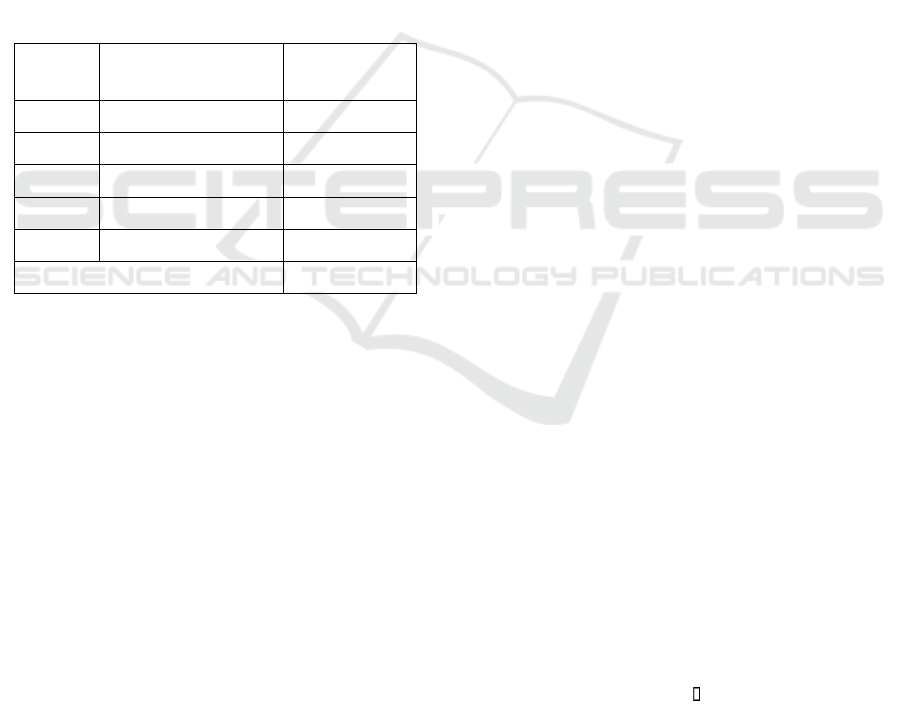
Table 8: Dominant Factor.
Faktor
Sub Variabel
% of Variance
1
Gratification Shopping
36,817%
2
Idea Shopping
12,286%
3
Social Shopping
8,392%
4
Value Shopping
7,351%
5
Adventure Shopping
6,959%
Total
71,804%
Overall, these five factors can explain more than
50% of the factors that influence Hedonic Shopping;
which is 71.804%. Based on the ranking of the
factors that influence Hedonic Shopping above, it
obtains a general description in which the five
factors must be the top priority to find out the factors
that influence Hedonic Shopping so that they must
be fulfilled. Thus, the most dominant factor affecting
hedonic shopping comes from the Shopping
Gratification sub-variable.
The sub-variable with the highest score is
Gratification Shopping. This shows that consumers
of H&M Paris Van Java tend to shop to eliminate
stress because seeing and buying fashion products at
H&M Paris Van Java can improve the mood of
consumers. In a line with the research of Ozen and
Engizek (2013), many consumers claim that they
shop to reduce stress or to stop thinking about the
problem at hand, even escaping for a moment from
the reality. It is proven by the results of the
Gratification Shopping of the dominant H&M Paris
Van Java consumers in the high category.
Next is the sub-variable Idea Shopping. By
shopping for fashion products at H&M Paris Van
Java, consumers can find out about the fashion trend
because the available products at H&M Paris Van
Java Bandung are up-to-date and always change
according to the theme or season at H&M itself.
Furthermore, from the Social Shopping sub-
variables, consumers feel happy if, at the time they
are shopping, they are accompanied by friends or
family due to the frequent social interaction.
Followed by the Value Shopping sub-variable, it
shows that consumers feel that if H&M Paris Van
Java Bandung gives enough discounts to make them
happy, consumers can get fashion products at cheap
prices with good quality so they get another value
from the product. In a line with the research by
Chandon et al. (2000) in Ozen and Enginek (2013),
consumers who buy discounted items will feel happy
and consider themselves to be a smart buyer. It is
evident that H&M often holds discounts for
consumers and they feel happy and proud if they get
discounted items purchased at H&M Paris Van Java
The last sub-variable is Adventure Shopping. In
accordance with the research conducted by Ozen and
Engizek (2013), which is about adventure/exploring
shopping, it is an adventure or exploration of
shopping done by consumers to find something new
and interesting and the practice of enjoyment felt
during the shopping process (Westbrook and Black
1985). The H&M Paris Van Java has created a
comfortable atmosphere in which the consumers can
enjoy the shopping process with the existing layout,
lighting, and so on. Some consumers explain that
H&M Paris Van Java is too crowded so that it is one
reason why adventure shopping is not the dominant
sub-variable for consumers when they shop at H&M
Paris Van Java Bandung.
4.2 Hypothesis Testing
The decisions taken are as follows:
H
0
: There are no dominant hedonic shopping
motives to the consumers of H&M Paris Van
Java Bandung.
H
1
: There are hedonic shopping motives that are
dominant to the consumers of H&M Paris Van
Java Bandung.
The basis of decision making is:
a. If chi-square counts
≤
chi-square table then H
0
is rejected.
b. If chi-square counts < chi-square table then H
0
is accepted.
Or
a. If p-value ≤ 0.05 then H
0
is rejected.
ICIB 2019 - The 2nd International Conference on Inclusive Business in the Changing World
552

b. If p value > 0.05 then H
0
is accepted.
Based on the result of Bartlett's Test, it appears
that the chi-square value is equal to 561,224 with df
= 136 and α = 0.05. Thus chi-square counts
(561,224) > chi-squared tab (164,216) or p-value
(0,000) < 0.05 so H0 is rejected and H
1
is accepted.
This can mean that there are dominant results from
hedonic shopping motives, namely Gratification
Shopping.
These results indicate that among the six sub-
variables of hedonic shopping motives, Gratification
Shopping is the dominant sub-variable of 36.81%
for consumers who shop at H&M Paris Van Java. In
a line with the research results conducted by Park,
Kim, and Forney (2005), it is explained that
emotional elements, namely gratification shopping,
and positive emotions will indirectly affect fashion-
oriented purchases. In addition, it is also in a line
with the research by Arbold and Reynold (2003)
explaining that there are positive results from
hedonic shopping motives in the retail industry.
The result of the interview also shows when
viewing fashion products at H&M tend to improve
mood. Besides, because H&M is located at Paris
Van Java mall, the atmosphere is not boring
because, besides shopping, consumers can at the
same time walk around the mall. It becomes one of
the reasons for consumers to change their mood
when shopping at H&M Paris Van Java Bandung
5 CONCLUSIONS AND
RECOMMENDATIONS
5.1 Conclusions
Based on the results of research and discussion on
the analysis of hedonic shopping motives to
consumers of H&M Paris Van Java, the writers draw
the following conclusions:
1) For Hedonic Shopping variables, it is known
that respondents' ratings are in the high
category based on the respondents' assessment
toward six hedonic shopping motives, namely
Adventure Shopping, Social Shopping,
Gratification Shopping, Idea Shopping, Role
Shopping, and Value Shopping with the
percentage obtained 77.5%. The results of
overall factor analysis can explain more than
50% of the factors that influence Hedonic
Shopping; which is equal to 71.804%.
2) Among the six hedonic shopping motives sub-
variables, there is a hedonic shopping motive
which has the highest or most dominant
response from the respondents who are the
consumers of H&M Paris Van Java Bandung.
The most dominant hedonic shopping motive is
gratification shopping with the result of 36,
81% compared to the others. These results
illustrate that the consumers of H&M Paris
Van Java Bandung do shopping activity with
the aim of relieving stress and as an alternative
to eliminate negative mood in themselves.
5.2 Recommendations
Based on the above conclusions, the writers would
like to give a number of suggestions to H&M Paris
Van Java Bandung regarding hedonic shopping
motives analysis to consumers of H&M Paris Van
Java outlet as follows:
1) Hedonic shopping motives for consumers of
H&M Paris Van Java can be used as a
benchmark for H&M in terms of market
opportunity because if someone already has the
hedonic shopping motivation for the preferred
item, it can increase sales. It would be better if
there are other attractive offers that can support
the achievement of sales volume targeted by
the H&M Paris Van Java.
Even though H&M Paris Van Java has Bloch, P.,
Ridgway, N., & Dawson, S. 1994. The shopping
mall as consumer habitat. Journal of Retailing,
70 (1), 23-42
2) a strategic place to shop because it is located
near the basement so that it becomes the
entrance for visitors to the Paris Van Java Mall,
it is better for H&M Paris Van Java to pay
more attention to the convenience of the
consumers who shop because many visitors are
just passing through the H&M Paris Van Java
as access to the entrance or exit of the mall.
3) H&M Paris Van Java should regularly give
discounts to the consumers as they have done.
The discounts that H&M provide are unique
because they provide thematic discount names
for the products sold according to "the season"
or certain seasons that have been set. In
addition, because of the discount, it can attract
other consumers to shop at H&M Paris Van
Java Bandung.
Analysis of Hedonic Shopping Motives to HM Paris Van Java Bandung Consumers
553

REFERENCES
Arnold,M. J., & Reynolds, K. E. 2003. Hedonic shopping
motivations. Journal of Retailing, 79(2), 77–95
Babin, B. J., W. R. Darden, & M. Griffin. 1994. Work
and/or fun: Measuring hedonic and utilitarian
shopping value. Journal of Consumer Research 20:
644–65.
Beatty, S. E., & Smith, S. M. 1987. External search effort:
an investigation across several product categories.
Journal of Consumer Research, 14(1), 83–95.
Beatty, S. E., & Ferrell, M. E. 1998. Impulse buying:
modeling its precursors. Journal of Retailing, 74(2),
169–191.
Bloch, P. H., Sherrell, D. L.,& Ridgway, N. M. 1986.
Consumer search: an extended framework. Journal of
Consumer Research, 13(1), 119–126.
Chaudhuri A., Holbrook, M. B. 2001. The Chain of
Effects from Brand Trust and Brand Affect to Brand
Performance: The Role of Brand Loyalty. Journal of
Marketing, 65 (2): 81-93
Childers, T. L., C. L. Carr, J. Peck, & S. Carson. 2001.
Hedonic and utilitarian motivations for online retail
shopping behavior. Journal of Retailing 77: 511–35
Haytko, D. L.,&Baker, J. 2004. It’s all at themall:
exploring adolescent girls’ experiences. Journal of
Retailing, 80(1), 67–83.
Herabadi, A. G., Verplanken, B., Knippenberg, A. 2009.
Consumption experience of impulse buying in
Indonesia: Emotional arousal and hedonistic
considerations. Asian Journal of Social Psychology,
12: .20–31.
Hirschman, E. C., & Holbrook, M. B. 1982. Hedonic
consumption:emerging concepts, methods and
propositions. Journal of Marketing, 46(3), 92–101
Kim, J., & S. Forsthye. 2007. Hedonic usage of product
virtualization technologies in online apparel shopping.
International Journal of Retail & Distribution
Management 35 (6): 502–14.
Kim, H., & Kim, Y. 2008. Shopping enjoyment and store
shopping modes: the moderating influence of chronic
time pressure. Journal of Retailing and Consumer
Services, 15(5), 410–419.
Lim, E. A. C., Ang S. H. 2008. Hedonic vs. utilitarian
consumption: A cross-cultural perspective based on
cultura conditioning. Journal of Business Research,
61: 225–232.
Mark, Yi-Cheon Y., Seung Chul Y., Paul L. S., Joo Hwan
S. 2014. Hedonic shooping motivation and co-shopper
influence on utilitarian grocery shopping in
superstores. J.of the Acad. Mark. Sci., 42 (2014), 528-
544.
Roy, A. 1994. Correlates of mall visit frequency. Journal
of Retailing, 70(2), 139–161.
Swinyard,W. R. 1993. The effects ofmood, involvement,
and quality of store experience on shopping intentions.
Journal of Consumer Research, 20(2), 271–280.
Wakefield, K. L., & Baker, J. 1998. Excitement at the
mall: determinants and effects on shopping response.
Journal of Retailing, 74(4), 515–539.
Westbrook, R. A., & Black, W. C. 1985. A motivation-
based shopper typology. Journal of Retailing, 61(1),
78–103.
ICIB 2019 - The 2nd International Conference on Inclusive Business in the Changing World
554
