
Metal and Mineral Mining Firm’s Equity Valuation
in Indonesia Stock Exchange
Marfani Hasan, Riko Hendrawan
Magister Management, Telkom University, Jalan Gegerkalong Hilir No.47, Bandung, Indonesia
Keywords: Valuation, Discounted Cash Flow, Relative Valuation, Intrinsic Value, Metal, and Mineral
Abstract: The purpose of this research is to estimate the intrinsic values of the shares on the metal and mineral mining
companies listed in IDX 2018 using Discounted Cash Flow - Free Cash Flow to Firm method and verifies the
results with the relative valuation - PER and PBV methods. The sample of this research is the dominant
industry players ANTM, INCO, and TINS. The valuation baseline was the analysis of the financial statements
of those companies in the period 2013-2017 which was considered as the reference for the projection years
2018-2022. This research involved three scenarios namely pessimistic, moderate and optimistic, and the
reference market price was on January 2, 2018. The analysis concluded that using DCF-FCFF the stock’s
price of ANTM was undervalued in all scenarios, while INCO and TINS were overvalued in all scenarios.
The PER and PBV analysis found that all evaluated stocks within the industry range that mean the valuation
result is correct. Hence, the conclusion of this research is to buy ANTM stocks and to sell INCO and TINS
stocks.
1 INTRODUCTION
Investing in the capital market, especially stocks, has
a high risk considering the characteristics of these
financial instruments are high-risk and high-returns
(Damodaran, 2006). Fundamental analysis is
considered as one of the easiest ways to evaluate a
company before investing. The main objective of the
fundamental analysis is to examine the actual value
of the company today by predicting future profits and
risks to calculate the intrinsic value of a company's
stock (Baresa et al., 2013).
Nickel price is predicted to experience a stronger
trend in 2018. The main contributor to the positive
trend is the increasing demand for battery raw
materials. China's battery imports grew 26.88% year-
on-year in the first quarter of 2018 (Haffiyan, 2018).
Meanwhile, strengthening of the tin price is flat due
to slowing sales of electronic goods, especially
smartphones (Haffiyan, 2018). The projections for
world smart telephone shipments from 2015 to 2022
are expected to be gentler (Atwal et al., 2018).
However, Indonesia's tin and nickel export trend are
still growing positively in the year from 2016 to mid-
2018 (Pusat Data dan Informasi Kementrian
Perdagangan, 2018).
Nickel and tin price trend could influence the
stock price fluctuations and the level of risk and
return in this industry. However, the researchers
would not explore that hypothesis further. That
symptom had brought the researchers to discover the
stock trend in Metal and Mineral Sub-Sector in
Indonesia.
Figure 1: KOMPAS100 index trend and the risk/return
January 2013 - June 2018
The stock price fluctuations and the level of risk
and return in this sub-sector are shown in the initial
analysis of the stock prices of the three sampled
companies, ANTM, INCO, and TINS. The three
companies were selected based on three purposive
sampling criteria, namely, listed on the Indonesia
Stock Exchange (BEI) mining sector - metal and
662
Hasan, M. and Hendrawan, R.
Metal and Mineral Mining Firm’s Equity Valuation in Indonesia Stock Exchange.
DOI: 10.5220/0008435106620673
In Proceedings of the 2nd International Conference on Inclusive Business in the Changing World (ICIB 2019), pages 662-673
ISBN: 978-989-758-408-4
Copyright
c
2020 by SCITEPRESS – Science and Technology Publications, Lda. All rights reserved
mineral mining sub-sector, listed on the
KOMPASS100 index on the Indonesia Stock
Exchange (IDX), and never suspended and actively
transacted in The IDX is at least up to June-2018
Shares up to June 2018.
Based on Figure 1, we can see that in the period
January 2013 to June 2018, overall the KOMPAS100
Index showed a positive growth trend. The highest
KOMPAS100 index value occurred on February 19,
2018, at the value of 14,214,960, and the lowest value
occurred on August 27, 2013, at the value of
8,366,960.
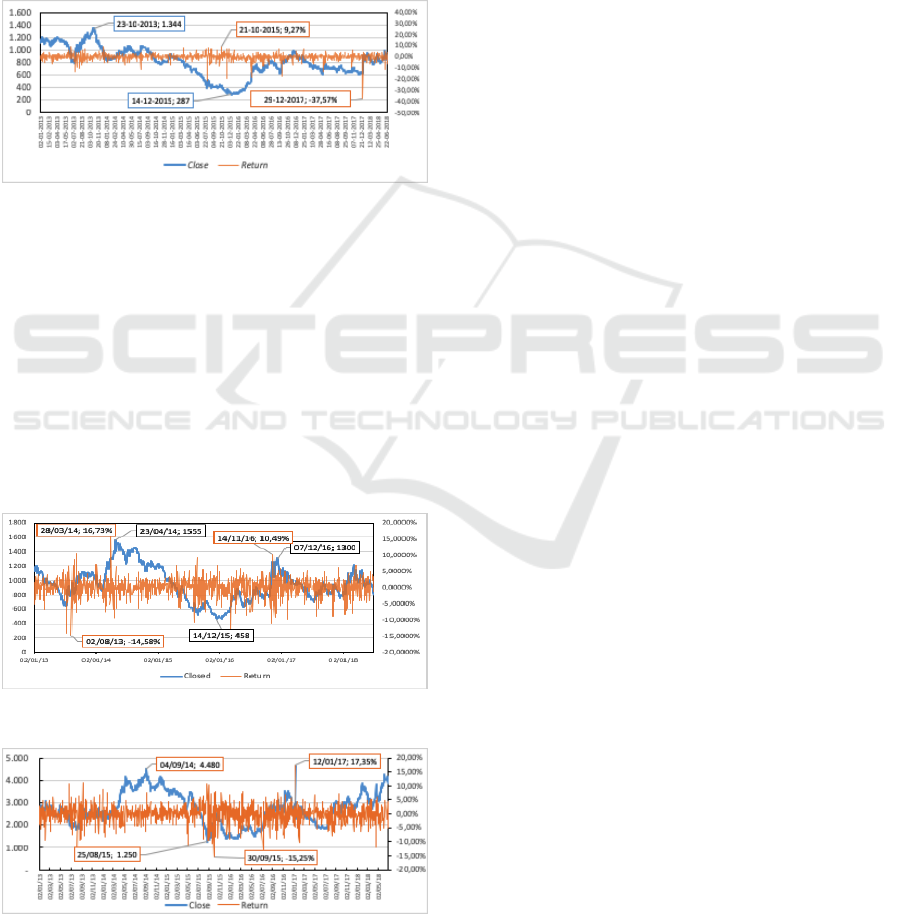
Figure 2: ANTM stock prices trend and the risk/return
January 2013 - June 2018 (processed)
Further, in the same graph on the second axis, we
can see other critical information, namely the risk and
returns figure. From the chart, there were several high
yield points, which occurred on August 27, 2015, at
5.7%, and the lowest yields that occurred on August
19, 2013, amounted to -6.5%. This phenomenon
shows that a positive trend in stock price performance
is not enough for us to decide an investment, risk and
returns factors also need to be becoming another
critical considerations of an investment.
Figure 3: INCO stock prices trend and the risk/return
January 2013 - June 2018 (processed)
Figure 4: TINS stock prices trend and the risk/return
January 2013 - June 2018 (processed)
In Figure 2, we can see that in the period of
January 2013 to June 2018, the trend of the ANTM's
shares tended to stagnate and decline until December
2017, but raised by around 50-100 points in the period
January to June 2018. The lowest value was IDR 287
on December 14, 2015, and the highest value was
IDR 1,344 occurred on October 23, 2013. Likewise,
the rate of return, the highest occurred at the value of
9.27% on October 21, 2015, and the lowest occurred
at the value of -37.57% on December 29, 2017.
In Figure 3, we can see that in the period January
2013 to June 2018, the INCO share’s value also
tended to be stagnant, but raised quite well in the last
two years. The lowest value was IDR 1,250 on
August 25, 2015, and the highest value was IDR
4,480 occurred on September 4, 2014. The second
peak value occurred again at the value of IDR 4,250
on June 6, 2018. The rate of return, the highest
occurred at the value of 17.35% on January 12, 2017,
and the lowest occurred at the value of -15.25% on
September 30, 2015.
In Figure 4, we can also see that in the period
January 2013 to June 2018, the trend of TINS shares
also tended to be stagnant, but experienced significant
fluctuations in the last two years. The lowest value
was IDR 458 on December 14, 2015, and the highest
value of IDR 1,555 occurred on April 23, 2015. The
second peak value occurred again at the price of IDR
1,300 on December 7, 2016. The highest return
occurred at 16, 73% on 28 March 2014, and the
lowest occurred at -14.58% on 2 August 2013.
Based on the phenomenon mentioned earlier, the
goal of this research is to analyze the intrinsic value
of the stock prices of companies in the Metal and
Mineral Mining Sub Sector listed in the
KOMPAS100 Index on the Indonesia Stock
Exchange in 2018, then to provide the
recommendations to the investor whether these shares
are worth buying, selling or holding after comparing
the value of shares in the market with the intrinsic
value obtained from this research.
2 LITERATURE REVIEW
2.1 Valuation Theory
In general, there are four approaches for valuing an
asset (Damodaran, 2006).
a. Asset-Based Valuation
We estimate the current asset value owned by a
company that is worthy of appreciation with this
method (Damodaran, 2006). Furthermore, we can
reveal two techniques in this method, namely using
valuation when an asset needs to be liquidated now
(liquidation value), or when we have to replicate or
Metal and Mineral Mining Firm’s Equity Valuation in Indonesia Stock Exchange
663

replace the asset (replicate/replacement value)
(Damodaran, 2006).
b. Discounted Cash Flow Valuation
In discounted cash flow (DCF) valuation, the
value of an asset is the present value of the expected
cash flows on assets, discounted at a rate that reflects
the risk of these cash flows (Damodaran, 2006).
c. The Relative Valuation
Valuation of assets using relative valuation is the
purpose of valuing an asset based on the similarity of
the asset valued in the market (Damodaran, 2006).
There are two primary consequences in relative
valuation. First, when we will do a valuation using
this method, the price of an asset must be
standardized first. General practice is by converting it
to multiples of frequently used variables, such as
earnings, book value, or revenue. Second, looking for
similar assets to compare (Damodaran, 2006).
d. Contingent Claim Valuation
In a contingent claim valuation (CCV), the option
price model is used to assess an asset. A contingent
claim or option is an asset that is paid only in certain
contingency conditions, for example in the
mechanism of a call option in the condition of the
underlying asset more penetrating the agreed value,
or put option mechanism if less than the agreed value
(Damodaran, 2006).
With these valuation methods, we can estimate an
intrinsic price, then, compared to the market price. If
the intrinsic price is higher than the market price, that
is mean the current market price is in an undervalued
position, so it is worth buying. If the intrinsic price
obtained is lower than the market price, then the stock
price is in an overvalued position, so the stock should
be sold. Moreover, if the intrinsic price is the same as
the market price, then the stock price is in the position
of fair-valued, so it is recommended to hold the stock
(Damodaran, 2006).
Relative valuation is used to validate the DCF
valuation results. The valuation results using this
method must be compared between one company and
another. One of the most popular approach in relative
valuation is price earnings ratio (PER) (Aljifri and
Ahmad, 2018). Before deciding to invest, it is
necessary to know whether the PER value of a
company is above or below the industry average. If it
is smaller, then the PER value of the company is in an
undervalued, so it is worth buying. Conversely, if it is
higher than the industry average, then the stock is in
an overvalued position, so it is worth selling. If the
PER is equal to the value of the industry, then the
stock is in a position fair-valued, and the shares
should be held (Damodaran, 2006).
Another popular multiple is the Price Book Value
approach (Aljifri and Ahmad, 2018). With the PBV,
the reference is the book value of the company's
shares, as reported in the audited financial statements.
Based on this theory, the best PBV is one, meaning
that the market price is equal to the book valuation
price. If it is smaller than one, the company's stock is
in an undervalued position, so it is worth buying.
Conversely, if it is higher than one, then the stock is
in overvalued position, so it should be sold
(Damodaran, 2006). However, since PBV is one
approach of relative valuation, we also need to
compare with the industry average as a baseline when
making an investment decision using PBV.
2.2 Firm Value
The value of an investment is essentially the present
value of cash flows obtained from the company
resources management (Mohammad, 2016). The
value of an investment in a company is closely related
to the value of the company's shares (Baresa et al.,
2013). Two main controls that determine the value of
share, the first is the perception of investors, and the
second is demand and fulfilment (demand and
supply) (Damodaran, 2006). The stock price in the
market (market price) does not necessarily reflect the
real price of the company (Paramitha et al., 2014).
The business conditions of the company will
significantly influence the value of a company
(Paramitha et al., 2014).
Meanwhile, the macro conditions, such as the
political, economic, social conditions of the country
strongly influences the company operation and the
industrial conditions. Therefore, in addition to
evaluating the company, it is essential to conduct an
assessment of macroeconomic and industrial
conditions in the country where the company is
engaged in business activities (Paramitha et al.,
2014).
The main objective of corporate financial
management is to maximize company value.
Financial policies, corporate strategies, and company
values are mutually supportive (Damodaran, 2006).
The positive growth of company value is an
achievement desired by its owners because the
increase in the value of the company is synonymous
with the welfare of its owners as well (Zemba and
Hendrawan, 2018).
2.3 Discounted Cash Flow
The Discounted Cash Flow (DCF) is a valuation
method of an assets by assuming its present value’s
cash flows (cash flows) that can be generated by the
asset, discounted at a specific ratio which represents
the risk of cash flows (Damodaran, 2006). We can
calculate the cash flow generated by an asset with
following basic formula where E(CF) is the
ICIB 2019 - The 2nd International Conference on Inclusive Business in the Changing World
664

estimation of the cash flow, n this year of estimation,
and r is the discounted rate (Damodaran, 2006).
(1)
The Discounted Cash Flow (DCF) method is
divided into three models, i.e. Dividend Discounted
Model (DDM), Free Cash Flow to Equity (FCFE),
and Free Cash Flow to Firm (FCFF) (Damodaran,
2006).
2.3.1 Dividend Discounted Model
Dividend Discounted Model (DDM) is the longest
Discounted Cash Flow model practiced (Damodaran,
2006). Many researchers are shifting from the DDM
model because the results obtained from this model is
overly conservative (Damodaran, 2006). The
underlying principle of the DDM model is when
investors buy shares in a public company, in general,
they expect two benefits; first, the profit from
dividends during the holding period, and the second
is the profit from the increase in the share price itself
at the end of the holding period. Because the expected
stock price is determined by future dividends, the
value of a stock can be reflected as the present value
of dividends forever (Damodaran, 2006).
The following is an example of a formula that can
be used to calculate the intrinsic value of shares using
the DDM model in n years, assuming the revenue is
in stable growth and the company pays dividends
regularly.
(2)
2.3.2 Free Cash Flow to Equity
Free Cash Flow to Equity (FCFE) is the cash flow
available after repayment of obligations to non-equity
investors (interest obligations, debt repayment, and
preferred dividend) has been fulfilled (Damodaran,
2006). Furthermore, there are several stages that must
be done to estimate the cash flow that can be
generated by a company to shareholders (Damodaran,
2006).
The first stage, each investment expenditure
issued must be reduced first with net income (net
income) from a company so that it can represent the
cash outflows. It is then added with depreciation.
In the second stage, if there is an increase in
working capital, it will reduce the cash flow available
to shareholders. In the last stage, if the company gets
new debt and debt that has been paid in the company's
cash flow, then the principal debt payment represents
cash out money, while the issuance of new debt will
represent the money that enters.
Following is the formula for calculating FCFE
values, where NWC is the net working capital.
FCFE = Net Income
– Capex
+ Depreciation
– NWC
+ Cash
(3)
2.3.3 Free Cash Flow to Firm
The Free Flow to Firm Cash (FCFF) is the amount of
cash flow available to all investors in a company,
including common stockholders, bondholders, or
preferred-stockholders (Damodaran, 2006). The
general calculation formula for getting a Free Cash
Flow to Firm (FCFF) is as follows:
FCFF = (EBIT x (1-Tax)
+ Depreciation
– Capex
– NWC
(4)
The value of the company is obtained by
discounting the Free Cash Flow to Firm (FCFF) with
the Weighted Average Cost of Capital (WACC)
factor in this method (Damodaran, 2006). We can use
the following formula to calculate the value of the
company, where t is the year of calculation
(Damodaran, 2006):
(5)
After getting the present value of the cash flow
obtained from a particular scenario (FCFF) and
discounted terminal value. Then, the two present
values are summed to get the firm value or equity
value (Damodaran, 2006). The formula that can be
used to calculate company value using FCFF whose
growth has stabilized in a given year, and continues
to grow stably at the perpetual growth level of g is as
follows (Damodaran, 2006). TV is the terminal value
that will be discussed in the next section.
(6)
Metal and Mineral Mining Firm’s Equity Valuation in Indonesia Stock Exchange
665

(7)
2.4 Cost of Capital
The cost of capital definition is the rate of return that
becomes an return expectation when an investor put
an investment in a capital market (Damodaran, 2006).
In general, the expected rate of return is represented
by the Weighted Average Cost of Capital (WACC) in
the company value formula. The Weighted Average
Cost of Capital (WACC) provides an illustration to
investors that the capital cost of a company is a
weighted average of the various costs contained in the
company's capital structure (Damodaran, 2006).
WACC is a very important parameter when
estimating the value of a company using the DCF
model. Minor changes in WACC will result in major
change in company value. The WACC is calculated
by weighting the source of capital according to the
company's financial structure and then multiplying it
with the portion of their costs. The WACC calculation
formula is as follows:
WACC = (Equity ratio x Equity rate) + ((Debt
ratio x Debt rate) x (1 – tax)
(8)
In the WACC calculation there are two main
factors explained as follows:
a. Cost of equity
Definition of cost of equity (R
e
) is the rate
of return expected by the shareholder (equity)
on his investment in a company (Damodaran,
2006). The formula to calculate the cost of
equity (R
e
) is as follows (Damodaran, 2006):
(9)
If the company distributes dividends
regularly, alternative formula that can be used
to calculate R
e
is as follows (Damodaran,
2006):
R
e
=
(10)
b. Cost of debt
Cost of debt (Rd) is the interest rate that
must be paid by the company for its debt or
external capital (Damodaran, 2006).
2.5 Terminal Value
The technical problem that often arises is how to
determine the proxy that can represent the value of
the company after an explicit projection period. For
example, the company conducts financial report
projections for five years. Terminal value provides an
estimate of the amount of the estimated value of the
company after the fifth year period. Terminal value is
a proxy to simplify the calculation of company value
after an explicit period (Damodaran, 2006).
One common method used to calculate proxy
terminal values is the Gordon Growth method. The
Gordon Growth method uses the potential for growth
in calculating the proxy terminal value. This method
is derived to two, namely: (1) Growing Free Cash
Flow Perpetuity; and (2) Shortcut Growing Cash
Flow Perpetuity (Damodaran, 2006).
a. Growing Free Cash Flow Perpetuity
This method assumes that free cash flow
will grow continuously over a very long period
of time, or forever, after passing an explicit
projection period, when the growth rate is
constant. The formula for Growing Free Cash
Flow Perpetuity is as follows (Damodaran,
2006):
(11)
b. Shortcut Growing Free Cash Flow Perpetuity
This method is the same as the method of
Growing Free Cash Flow Perpetuity whose
terminal value is calculated from the expected
free cash flow for the first year after the explicit
projection period. The difference is that this
method simplifies how to get FCF
t + 1
by
assuming FCFt + 1 = FCF
t + 1
x (1 + g), so that
the formula is as below (Damodaran, 2006):
(12)
2.6 Relative Valuation
The easiest analogy for understanding relative
valuation is if we are going to buy a 100m
2
type
house, then we will compare the price of the similar
type of house around it with the price of the house we
will buy. With the relative valuation method, we
value an asset based on the similarity of similar assets
valued in the market (Damodaran, 2006).
ICIB 2019 - The 2nd International Conference on Inclusive Business in the Changing World
666

There are several approaches that can be used to
do a valuation of a company using the relative
valuation method.
a. Price Earnings Ratio Approach
Price/Earnings (P/E) multiple analysis is
considered as the king of relative valuation. It is
computed as the ratio between the share price and
earnings per share (EPS) or alternatively as market
capitalization over total earnings. The multiple can be
built in different ways, depending on the
methodology used to select earnings (Massari et al.,
2018):
(13)
b. Price to Book Value Approach
Another approach that can determine the value of
a stock in relative valuation method is to compare the
stock market price to the book value per share
(Damodaran, 2006). In ideal conditions, the market
value of a stock must describe the value of the book
(Damodaran, 2006).
The formula that can be used to determine price
book value (PBV) is as follows (Damodaran, 2006):
(14)
2.7 Building Research Assumptions
Uncertainty is an unpredictable part and reward of the
valuation process, two things that are crucial are the
times when we make a valuation of a company, and
how long our valuations last until new information is
found that affects the valuation validity. Information
can be in the form of the specific information related
to the company, and it can also be more general
related to the sector in which the company operates,
or more general market information, such as interest
rates and general economic conditions (Damodaran,
2006).
Furthermore, the valuations can be wrong with
several reasons that can be categorized into three
groups as follows (Damodaran, 2006):
a. Estimation uncertainty. Although the source of
information used is indisputable, at the time of
valuation, a valuator must convert raw
information into inputs, and process it in a
research model. An error in data processing or
assessment that occurs at this stage can cause
estimation errors.
b. Firm-specific uncertainty. Estimates built when
valuing a company can be completely wrong. A
company can in fact produce better or worse
performance than our prediction, causing
earnings and cash flows to be far different from
our estimates (Abdullah et al., 2017).
c. Macroeconomic uncertainty. When both of
these things are in accordance with the
estimation of a valuator, macroeconomic
conditions can change unexpectedly. Interest
rates can go up or down in certain situations,
and general economic conditions can get better
or worse. Changes in these macroeconomic
conditions will affect the value of a company
2.8 Framework of Thinking
Stock price valuation analysis in this research was
carried out by utilizing the Discounted Cash Flow
(DCF) method Free Flow to Firm (FCFF) approach,
then comparing the results with the relative valuation
(RV) method to validate the estimates using the FCFF
method. The validation using RV can minimize bias
and assumptions error when doing valuations. RV is
carried out with the Price Earnings Ratio (PER) and
Price Book Value (PBV) approach by utilizing data
that is already available in quarterly reports on the
Indonesia Stock Exchange.
The basis of estimation utilizes company data
samples taken in the last five years, namely from
2013 to 2017. The stock valuations using the
Discounted Cash Flow (DCF) method require
assumptions and projection determinations the
condition of the company to produce free cash flow
in the future and then calculate the present value
(Neaxie and Hendrawan, 2017). Determination of
assumptions and projections needs to be adjusted to
specific scenarios because of uncertainty on the
company condition in the future. The research uses
three scenarios, namely optimistic conditions,
moderate conditions, and pessimistic conditions
(Neaxie and Hendrawan, 2017).
The scenarios can be determined based on
information on environmental data and facts (Neaxie
and Hendrawan, 2017). An optimistic condition is a
condition that is considered as the highest growth
condition of the company and seen from the
difference in industrial growth and the target of
company management (above the industry growth
average). Moderate conditions are conditions where
the most likely to occur is seen from the fundamental
states of the company (the most likely conditions)
whereas the pessimistic condition is the condition
where the condition of the company is the worst
(Neaxie and Hendrawan, 2017).
The optimistic condition will be calculated from
the average growth of the industry plus the spread
Metal and Mineral Mining Firm’s Equity Valuation in Indonesia Stock Exchange
667

between the average growth of the industry and the
average growth of the company coupled with half of
the spread of growth. While moderate conditions will
be calculated from the average growth of the industry
coupled with the average growth of the company.
Pessimistic conditions will be calculated only based
on the average growth industry (Zemba and
Hendrawan, 2018).
Figure 5: Research framework of thinking
The final process of valuation with Discounted
Cash Flow (DCF) method is to obtain equity value or
intrinsic value of the company which then gets the
intrinsic value per share in each defined scenario.
Then, the equity value obtained from the fundamental
estimation is compared to the market price, so it can
be concluded whether the stock price is fair-valued,
undervalued, or overvalued (Damodaran, 2006).
After knowing the position of the stock price, we
can advise whether the shares can be bought, held, or
sold so that investors can maximize their investment
to get the maximum profit.
The framework of thinking developed in this
research follows the flow diagram in Figure 5.
3 PROBLEM DEFINITION
Based on the introduction and literature review in
previous sections, the problem definition in this
research are:
a. What is the intrinsic value of ANTM, INCO,
and TINS shares in the Indonesia Stock
Exchange using the Discounted Cash Flow
method with the Free Cash Flow to Firm
(FCFF) approach? Also, What is the value of
the Price Earnings Ratio (PER) and Price Book
Value (PBV) in the optimistic scenario for
2018?
b. What is the intrinsic value of ANTM, INCO,
and TINS shares in the Indonesia Stock
Exchange using the Discounted Cash Flow
method with the Free Cash Flow to Firm
(FCFF) approach? Also, What is the value of
the Price Earnings Ratio (PER) and Price Book
Value (PBV) in the moderate scenario for
2018?
c. What is the intrinsic value of ANTM, INCO,
and TINS shares on the Indonesia Stock
Exchange using the Discounted Cash Flow
method with the Free Cash Flow to Firm
(FCFF) approach? Also, What is the value of
the Price to Earnings Ratio (PER), and Price
Book Value (PBV) in the pessimistic scenario
for 2018?
d. What recommendations can this research give
to the investors after knowing the share’s
intrinsic value, PER and PBV of these
companies in those three scenarios? Is it sold,
bought or held?
4 METHODOLOGY / APPROACH
This research took a quantitative descriptive approach
and aimed to provide an up-to-date description of the
fair price of sampled company stocks. Quantitative
descriptive research is a type of research giving a
deeper picture of the present situation (Zemba and
Hendrawan, 2018). The fair price reference in this
research is the intrinsic stock price obtained from the
valuation techniques used in this research.
The research variable used in this study is the
intrinsic value of shares based on the company's
fundamental value (firm value). Then the variables
will be calculated using the Discounted Cash Flow
Market (ISE)
Exploration (data
and news)
KOMPAS100
Index Exploration
Population and
Sampling
(3 companies)
KOMPAS100
Index Analysis
2013-2017
Sample historical
data and analysis
Projection
Development
2018-2023
Estimating intrinsic
value of the stocks
DCFRV
PER PBV FCFF
FCFF stock
valuation in
the range?
Optimistic Value
Moderate Value
Pessimistic Value
Overvalued ?
Fair-valued ?
Undervalued ?
Buy
Sell
Hold
Offered Price
ICIB 2019 - The 2nd International Conference on Inclusive Business in the Changing World
668

(DCF) method Flow to the Firm Free Cash (FCFF)
approach, and Relative Valuation approaches with
Price Earnings Ratio (PER), Price Book Value Ratio
(PBV) approaches. The measurement scale used to
measure the research variable is the ratio
measurement scale (Zemba and Hendrawan, 2018).
The sampling technique used by researchers was
purposive sampling technique. The purposive
sampling technique is a sampling selection technique
that selects a specific sample intentionally by the
researcher because only the sample represents or can
provide information to answer the research problem
statements (Sekaran, 2003).
The criteria of the purposive sampling technique
in this research are as follows:
a. Shares in the Indonesia Stock Exchange (IDX)
mining sector in the metal and mineral mining
sub-sector,
b. Shares listed on the KOMPASS100 index on
the Indonesia Stock Exchange (IDX),
c. Active shares up to June 2018 on the Indonesia
Stock Exchange (IDX) and are not suspended.
From each of these criteria, the companies that
become the population are obtained and the sample as
follows:
a. Based on the first criteria acquired nine
companies as follows:
1. Aneka Tambang Tbk.
2. Cita Mineral Investindo Tbk.
3. Cakra Mineral Tbk.
4. Central Omega Resource Tbk.
5. Vale Indonesia Tbk.
6. Merdeka Copper Gold Tbk.
7. J Resource Asia Pacific Tbk.
8. Timah Tbk.
9. Kapuas Prima Coal Tbk.
b. Based on the second criteria, three companies
were sampled, namely Aneka Tambang Tbk.,
Vale Indonesia Tbk., And Timah Tbk. The
reference used in determining the companies
that enter KOMPAS100 is the announcement of
the Indonesia Stock Exchange regarding
companies coming to the KOMPAS100 Index
Number Peng-00698 / BEI.OPP / 07-2018,
dated July 25, 2018, which is valid from August
2018 to January 2019.
c. Based on the data available on the website
www.duniainvestasi.com daily transaction data
for these three companies complete the
observation period January 1, 2013, to June 30,
2018, which means that the three companies
never experience the suspension throughout the
period of data collection
The type of data used in this research is the
secondary data types, such as company financial
statements, Indonesia Stock Exchange, World Stocks,
and Yahoo Finance. Secondary data is supporting
data obtained from other sources.
The data used in this research are secondary data
originating from the published and audited financial
statements historically in the last five years of the
sample companies, i.e., from January 2013 to
December 2017. The five-year historical data of the
KOMPAS100 index is taken from Yahoo Finance.
4.1 DCF-FCFF Share Value Approach
Estimating the share's intrinsic value stages using the
Discounted Cash Flow (DCF) - Free Cash Flow to
Firm (FCFF) approach is as follows (Damodaran,
2006):
a. Classify the historical data as the basis for
projection
In this stage data classification from
financial statements and company annual
reports is in the form of sales data (revenue),
the percentage of operating expenses (EB),
depreciation and amortization costs (DA),
EBIT, tax costs, capital expenditure, and net
working capital. The data was taken in the
range from 2013 to 2017.
Based on the historical data, we can get the
average data percentage (%) on revenue. That
leads us to its cost behavior. The cost behavior
is used as a reference for projecting over the
next five years, namely 2018-2022.
b. Conduct projections and analysis of financial
statement ratios
The basis of future financial statement
projections is taken from financial statement
data in the past. So that conducting company
valuation involves elements of forecasts,
estimates, and assumptions.
c. Calculating the free cash flow
After projecting the financial components
that form the EBIT, such as sales, costs, and
depreciation/amortization, then calculate FCFF
using formula 4.
d. Calculating the estimated cost of capital
The next is determining the discount. In this
approach, the discount rate used is WACC.
WACC is calculated based on the proportion of
the company's financing sources (equity and
debt). WACC is calculated using formula 8.
e. Figuring Value Terminals
In this research, the authors assume that
growth is constant, so the equation that can be
used is formula 7 or 11.
f. Calculating cash flows from FCFF and
Terminal Value
Metal and Mineral Mining Firm’s Equity Valuation in Indonesia Stock Exchange
669

The next step is to calculate the projection
of free cash flows until 2021, and the cash flow
of the terminal value assuming the company
has a constant growth in 2022. Cash flow
projections in this research used formulas 6.
g. Calculating the Enterprise Value
Furthermore, the enterprise value is
obtained from the sum between the number of
FCFF present values from 2018 to 2021 plus
the present value of the terminal value.
h. Calculating the company's Equity Value
The value of equity is obtained using the
value of the company or enterprise value
reduced by the amount of debt held, minus the
ownership of the minority company, and
summed by the amount of cash carried (Antwi
et al., 2012).
i. Calculating the intrinsic value of the stock
We need to divide the equity value with the
number of shares outstanding to get the
intrinsic value of the stocks. The intrinsic value
per share will be different depending on the
three scenarios of predetermined conditions
(optimistic, moderate, pessimistic) (Zemba and
Hendrawan, 2018).
j. Assessing and providing recommendations
After getting the intrinsic value, the value of
the stock needs to be compared with the stock
price in the evaluation period. The results of
this comparison will conclude that the value of
shares is in an undervalued, fair-valued, or
overvalued condition. From these conditions,
the researcher will advise investors to buy,
hold, or sell the evaluated shares.
4.2 PER Approach
This method uses the value of earnings to estimate
intrinsic value. The Price to Earnings Ratio (PER)
method is also called the multiplier method because
investors will count the multiplier value of earnings
reflected in the stock price. Thus, the PER method
describes the ratio or comparison between stock
prices and earnings per share of the company
(Damodaran, 2006).
The higher the PER value, the smaller the profit
for each share, because market prices are considered
to be increasingly expensive. Conversely, the lower
the PER value indicates the higher the benefit gained
for each share since the price is considered cheaper
(Damodaran, 2006).
Table 1: Stock Valuation Based on PER Value
PER> Average PER of Industry
Overvalued
PER<Average PER Industry
Undervalued
PER= Average PER Industry
Fair-valued
The PER value of a share of 5 means that the
return on investment is five years, or investors will
get a return of twenty percent each year. Meanwhile,
if the PER value is 10, then the return on invested
investment is ten years, equivalent to a gain of ten
percent per year. So, the higher the PER of a stock,
the worse it is because the profit per share is relatively
smaller (Damodaran, 2006).
The stages of estimating the PER value based on
the intrinsic value of shares obtained from the DCF
estimation are as follows (Zemba and Hendrawan,
2018):
a. Calculate Earnings per Share (EPS) using a
formula
EPS = EAT / Number of Shares
(15)
b. Calculating PER using a formula
PER = Share Intrinsic Value / EPS Price
(16)
Table 2: Investment Decisions based on Stock
Assessment Results
Stock price position
investment decision
Undervalued
Buying because it is possible
prices will rise
Overvalued
Selling because it is likely
prices will fall
Correctly valued
Hold (wait and see)
The next step is to compare the PER value
obtained with the industry average. Table 1 provides
an overview of stock positions if assessed based on
the estimated PER. Investment decisions based on
PER analysis is as shown in Table 2.
4.3 PBV Approach
The steps that must be taken to determine the position
of the stock are in an undervalued, fair valued or
overvalued position on the Price Book Value method
(PBV) is quite simple. Ideally, the stock market price
compared to the book value of its assets will approach
one. Stocks that have a low price/book value ratio
should be purchased to obtain a higher level of return
at a certain level of risk (Damodaran, 2006).
PBVs that have a value below or close to one is
considered good by investors, but PBV that has a
value above one means classified as expensive
(overvalued). However, PBVs that have high value
still can rise if the company has excellent
performance and business processes. Business
ICIB 2019 - The 2nd International Conference on Inclusive Business in the Changing World
670
prospects can be seen from how high the profits that
can be produced by the company. Investors can see
the amount of Return On Equity to know the
company's ability to generate profits based on owned
capital (Damodaran, 2006).
Further, since the native of relative valuation, we
need to also consider the average PBV of industry to
determine the position of evaluated shares in the
market. Therefore, below is the guideline for the
investors to determine the share position based on
PBV (Neaxie and Hendrawan, 2017).
a. If PBV> industrial PBV, then the stock is in an
overvalued position
b. If PBV= industrial PBV, then the stock is in a
fair-valued position
c. If PBV<industrial PBV, then the stock is
undervalued
5 ANALYSIS AND RESULT
The historical data were derived from the company's
financial reports from 2013 - 2017 and in further
taken as the reference for the free cash flow
calculation. The projection of free cash flow to the
firm is based on the cost behavior of the historical
data in 2013 - 2017 for the projections of 2018-2022.
In this research, we generated three scenarios of
projected corporate revenue growth based on industry
analysis namely the pessimistic, moderate, and
optimistic scenarios. A pessimistic scenario is a
scenario where the company's growth is the same as
industrial growth. The moderate scenario is a scenario
where the company's growth is industrial growth plus
the company's historical growth difference to
industrial growth. An optimistic scenario is a scenario
where the company's growth is industrial growth plus
the company's historical growth difference to
industrial growth, then added half of the difference
(Neaxie and Hendrawan, 2017).
The pessimistic scenario is built on the
assumption of consistent revenue growth of 2.16%
per year per the average industrial growth. The
moderate scenario was constructed with the
assumption of revenue growth of 5.15% for ANTM,
3.19% for INCO, and 3.52% for TINS. The three
companies are assumed to experience revenue growth
of 2.16% at the end of the year of analysis.
The optimistic scenario is built on the assumption
of revenue growth of 6.64% for ANTM, 3.71% for
INCO, 4.20% for TINS. The three companies are
assumed to experience revenue growth of 2.16% at
the end of the year of analysis.
5.1 DCF-FCFF Valuation Results
The stock valuation using DCF-FCFF method in this
research resulted in the share’s intrinsic value as
listed in Table 3.
Table 3: DCF-FCFF Valuation Results
5.2 PER Valuation Results
The stock valuation using relative valuation method
with Price Earnings Ratio (PER) approach resulted in
the PER values as listed in Table 4.This research used
the average PER of the industry from Q1 Statistic
Report of Indonesia Stock Exchange.
Table 4: PER Valuation Results
5.3 PBV Valuation Results
The stock valuation using relative valuation method
with Price Book Value (PBV) approach resulted in
the PBV values as listed in Table 5.This research also
used the average PBV of the industry from Q1
Statistic Report of Indonesia Stock.
Company Scenario Intrinsic Value
Opened Price
2 Jan 2018
Analysis
Pessimistic IDR 644 IDR 635 Undervalued
Moderate IDR 735 IDR 635 Undervalued
Optimistic IDR 784 IDR 635 Undervalued
Pessimistic IDR 2,376 IDR 2,920 Overvalued
Moderate IDR 2,455 IDR 2,920 Overvalued
Optimistic IDR 2,496 IDR 2,920 Overvalued
Pessimistic IDR 568 IDR 780 Overvalued
Moderate IDR 611 IDR 780 Overvalued
Optimistic IDR 633 IDR 780 Overvalued
ANTM
INCO
TINS
Company Scenario PER Result
PER Industry
Q1-2018
Analysis
Pessimistic 115.65 25.62 Overvalued
Moderate 122.52 25.62 Overvalued
Optimistic 126.25 25.62 Overvalued
Pessimistic 49.02 25.62 Overvalued
Moderate 50.06 25.62 Overvalued
Optimistic 50.61 25.62 Overvalued
Pessimistic 11.86 25.62 Undervalued
Moderate 12.46 25.62 Undervalued
Optimistic 12.77 25.62 Undervalued
TINS
ANTM
INCO
Metal and Mineral Mining Firm’s Equity Valuation in Indonesia Stock Exchange
671

Table 5: PBV Valuation Results
6 CONCLUSIONS
The conclusions of this research are as follows:
a. Based on the analysis carried out on the
optimistic scenario, it can be concluded that the
intrinsic value of ANTM shares is IDR 784 with
a PER value of 126.25 and a PBV value of 1.02.
The intrinsic value of INCO shares is IDR 2,496
with a PER value of 50.61 and PBV at a value
of 1.01. The intrinsic value of TINS shares is
IDR 633 with a PER value of 12.77 and PBV at
a value of 0.78.
b. Based on the analysis carried out in the
moderate scenario it can be concluded that the
intrinsic value of ANTM shares is IDR 735 with
a PER value of 122.52 and a PBV value of 0.96.
The intrinsic value of INCO shares is IDR 2,455
with a PER value of 50.06 and PBV at a value
of 0.99. The intrinsic value of TINS shares is
IDR 611 with a PER value of 12.46 and PBV at
a value of 0.75.
c. Based on the analysis that has been done on the
pessimistic scenario it can be concluded that the
intrinsic value of ANTM shares is IDR 644 with
a PER value of 115.65 and a PBV value of 0.84.
The intrinsic value of INCO shares is IDR 2,376
with a PER value of 49.02 and PBV at a value
of 0.96. The intrinsic value of TINS shares is
IDR 568 with a PER value of 11.86 and PBV at
a value of 0.70.
d. Recommendations from the results of this study
are as follows:
1. PT Aneka Tambang Tbk.
Based on the FCFF approach, the research
recommends buying ANTM shares on all
scenarios because the valuation results are
undervalued. Based on the Price Earnings Ratio
(PER) approach, the valuation produced an
overvalued position against the industry PER
(12.62x) in all scenarios, so the researcher’s
recommendation is to sell ANTM shares. Based
on the Price Book Value (PBV) approach, the
valuation resulted in undervalued values in all
scenarios, since they are below the industry
average of 3.55. Base on the result, the author
recommends buying ANTM shares.
2. PT Vale Indonesia Tbk.
Based on the results of the analysis using the
FCFF approach, it was concluded that INCO
shares were overvalued in all scenarios, so they
were recommended for sale. If using the Price
Earnings Ratio (PER) approach, the three
scenarios produce values above the industry
average of 25.62x, so the researcher also
recommends selling INCO shares. While the
analysis of INCO stock prices using the Price
Book Value (PBV) concluded that INCO shares
were in an undervalued position on all scenarios
because they are below the industry average of
3.55, so they are worth buying.
3. PT Timah Tbk.
The result of the analysis using the FCFF
approach recommends selling in all three
scenarios since the share value was overvalued.
If using the Price Earnings Ratio (PER)
approach, the three scenarios produce PER
values in the investment range below the
Industry average of 25.62, so the researcher
recommends buying PT Timah Tbk shares.
While the analysis of the stock price of PT
Timah Tbk. using Price Book Value (PBV)
produces a value below the industry average of
3.55 in all three scenarios, which means the
shares of PT Timah Tbk. worth to buy.
7 STUDY LIMITATIONS AND
FURTHER STUDY
Refer to the stock price trend, and the discussions in
this research, metal and mineral sub-sector could
probably have the relation with the battery and
smartphone industry trend. Researchers have yet
explored that interesting correlation. Further study in
that field is expected to strengthen the fluctuation
analysis of the stocks.
Another limitation of this research is the intrinsic
value valid time is only in 2018, and the sampled
companies were only 3 of 12 industry players. The
next valuator will have a possibility to revaluate the
intrinsic value of the company in 2019 and so on, or
include all industry players to have a complete figure
of the industry.
Company Scenario PBV Valuasi
PBV Industry
Q1-2018
Analysis
Pessimistic 0.84 3.55 Undervalued
Moderate 0.96 3.55 Undervalued
Optimistic 1.02 3.55 Undervalued
Pessimistic 0.96 3.55 Undervalued
Moderate 0.99 3.55 Undervalued
Optimistic 1.01 3.55 Undervalued
Pessimistic 0.70 3.55 Undervalued
Moderate 0.75 3.55 Undervalued
Optimistic 0.78 3.55 Undervalued
ANTM
INCO
TINS
ICIB 2019 - The 2nd International Conference on Inclusive Business in the Changing World
672

REFERENCES
Abdullah, A. I., Ali, M. M. and Haron, N. H., 2017.
Ownership Structure, Firm Value and Growth
Opportunities: Malaysian Evidence. Journal of
Computational and Theoretical Nanoscience. August
2017.
Aljifri, K., Ahmad, H.I., 2018. Preferred Valuation
Techniques in the UAE: A Comparative Study of
Financial and Non-financial Sectors. International
Journal of Economics and Financial Issues, 2019, 9(1),
51-59.
Antwi, S., Mills, E.F.E.A. and Zhao X., 2012. Capital
Structure and Firm Value: Empirical Evidence from
Ghana. International Journal of Business and Social
Science Vol. 3 No. 22.
Atwal, R. et al., 2018. Forecast : PCs, Ultramobile, and
Mobile Phones, Worldwide, 2016-2022, 1Q18 Update,
s.l.: Gartner
Baresa, S., Bogdan, S. and Ivanovic, Z., 2013. Strategy of
stock valuation by fundamental analysis. UTMS
Journal of Economics, University of Tourism and
Management, Skopje, Vol. 4, Issue 1, pp. 45-51.
Damodaran, A., 2006. Damodaran on Valuation. Second
ed. New Jersey: Wiley Finance.
Haffiyan, 2018. 3 Saham Emiten Tambang Mineral Ini
Paling Prospektif. [Online]
Available at: www.bisnis.com [Accessed 23 9 2018]
Pusat Data dan Informasi Kementrian Perdagangan. (2018).
Perkembangan Ekspor NonMigas (Komoditi) Periode :
2013-2018. Available at : www.
http://www.kemendag.go.id/id/economic-
profile/indonesia-export-import/growth-of-non-oil-
and-gas-export-commodity [15-Nopember-2018]
Massari, M., Difonzo, C., Gianfrate, G. and Zanetti, L.,
2018. Bank Valuation Using Multiples in US and
Europe: An Historical Perspective. Business Valuation
OIV Journal Fall 2018, Vol.0, Issue 0.
Mohammad, A.N.,2016. Valuation Tools for Determining
the Value of Assets: A Literature Review. International
Journal of Academic Research in Accounting, Finance
and Management Sciences Vol. 6 (4), pp. 63–72.
Neaxie, L. V. and Hendrawan, R., 2017. Stock Valuation in
Telecomunication Firms : Evidence from Indonesian
Stock Exchange. Journal of Economic & Management
Perspective (ISSN:2523-5338), Vol. 11(Issue 3).
Paramitha, A.L., Hartoyo, S. and Maulana, N.A., 2014. The
Valuation of Initial Share Price using Free Cash Flow
to Firm Method and The Real Option Method in
Indonesia Stock Exchange. JMK, Vol. 16, No. 1, March
2014, page 9–16.
Sekaran, U., 2003. Research Method for Business. Illinois,
USA: John Wiley & Sons, Inc.
Zemba, S. and Hendrawan, R., 2018. Does Rapidly
Growing Revenues Always Produces An Excellent
Company’s Values? DCF & PE Valuation Assessment
on Hospital Industry. ISCLO, Volume 6
th
Metal and Mineral Mining Firm’s Equity Valuation in Indonesia Stock Exchange
673
