
Segmentation Algorithm for Machine-Harvested Cotton based on S
and I Regional Features
Lei Li
1, a
, Chengliang Zhang
2
and Xinyu Zheng
1
1
School of Mechanical and Automotive Engineering, Qilu University of Technology (Shandong Academy of Sciences), 3501
Daxue Road, Jinan, China
2
School of Mechanical Engineering, University of Jinan, 336 Nanxinzhuang West Road ,Jinan, China
Keywords: Machine-harvested cotton, Impurities segmentation, Region merging, Color feature.
Abstract: A segmentation method based on regional color information is proposed for the complicated natural
impurities in machine-harvested cotton. The color gradient operation of the filtered machine cotton picking
image is carried out, and the marked image is obtained by extended minimum transformation operation. The
initial segmented image is obtained by using the watershed algorithm on the modified gradient image.
Spatial proximity and color information are considered comprehensively in the process of region merging.
Saturation S and brightness I as color information feature are mainly used in the paper. In order to make the
algorithm more accurately, the information features are updated in the process of merging. The
experimental results show that the average segmentation accuracy of the method for natural impurities is
92%.
1 INTRODUCTION
China is the largest cotton producer and consumer in
the world, as well as the largest textile producer and
exporter, but up to now, a considerable part of the
region still rely on manual picking by manpower.
Due to the increase of labor cost and the large-scale
planting of cotton, the traditional manual picking has
become unsuitable, and mechanical picking of
cotton has become the mainstream trend. The
impurity content of machine-harvested cotton is
much higher than that of manual picking. The
impurities mainly include cotton leaves, cotton
sticks, cotton shells, rigid leaves, dust and other
impurities. Therefore, it is especially important to
clean up the impurities in cotton (Qing, 2013). In the
cleaning of cotton impurities, the types of impurities
cleaned are by different equipment. Some cleaning
machines mainly clean up the leaf debris and other
light impurities, and others cleaning machines
mainly clean bell shell, rigid flap and other heavy
impurities (Anthony, 1995). The classification and
identification of impurities in cotton mining can
provide a reference for the adjustment of operation
parameters of cotton processing equipment, improve
the efficiency of impurity removal, and also provide
a guiding reference for the further improvement of
cotton picker equipment (Zhang, 2016).
At present, most of the researches are aimed at
the identification of the cotton heterosexual fiber
(Wang, 2015 and Jiang, 2015), and relatively few
researches on the machine-produced seed cotton
(Zhang, 2017). Imaging removal methods for cotton
impurities are generally used, such as X-ray
tomography (Pai, 2004), visible-light imaging
(Tantaswadi, 1999 and Yang, 2009), ultraviolet
fluorescence imaging (Mustafic, 2014), infrared
imaging (Jia, 2005), hyperspectral imaging (Zhang,
2016), and so on. The image segmentation is first
performed when the image is processed. Image
segmentation is the premise and foundation of the
image processing of the machine-harvested cotton.
The quality of the segmentation directly affects the
subsequent processing effect. The segmentation of
the image can lead to the difficulty of the
identification of the impurities in the cotton, and
even cause the error judgment. At present, the image
segmentation method is roughly divided into three
categories: the threshold segmentation method, the
edge segmentation method and the region
segmentation method. The region segmentation
method uses the consistency of regions as the
criterion to divide the regions of the image, and the
Li, L., Zhang, C. and Zheng, X.
Segmentation Algorithm for Machine-Harvested Cotton based on S and I Regional Features.
DOI: 10.5220/0008850503470353
In Proceedings of 5th International Conference on Vehicle, Mechanical and Electrical Engineering (ICVMEE 2019), pages 347-353
ISBN: 978-989-758-412-1
Copyright
c
2020 by SCITEPRESS – Science and Technology Publications, Lda. All rights reserved
347

regions of interest are extracted for further
processing. Compared with threshold segmentation
and edge segmentation, region segmentation has
strong anti-noise ability and good robustness. The
threshold method is generally used to segment
cotton impurities (Kan, 2010), while the regional
segmentation method is less used. In order to
quickly classify and identify the impurities of
machine picking cotton, a method based on S and I
characteristic region is proposed in this paper. In this
paper, the marked image of the image is obtained by
extending the minimum transformation operation,
and the watershed algorithm is used to segment the
image on the modified gradient image of the marked
image. Then, the region after the initial segmentation
is taken as the basic unit of processing, and on the
basis of considering the spatial proximity of the
image, On the basis of the above, the region merging
is mainly carried out with the saturation S and
luminance I feature information.
2 REGIONAL MERGER
Watershed algorithm is a morphological
segmentation method, which associates the object in
the gradient image with the minimum point markers,
which is proposed according to the process of
immersing terrain on the surface of the water. Holes
are drilled at each ponding basin (regional minimum
values) in the natural topography, allowing water to
submerge the whole terrain from low to high. By
constructing the dam to intercept the water in
different ponding basins, the resulting dam boundary
is the dividing line of the watershed. Each catchment
basin is numbered in the order of formation. The
watershed algorithm is simple to operate, but due to
the existence of noise and texture details of the
image itself, the image contains a lot of pseudo-
minimum values, which can easily submerge the
interested targets, resulting in serious watershed
over-segmentation (Li, 2014).
In order to reduce the phenomenon of over-
segmentation, the watershed algorithm is used to
segment the filtered gradient image, and the vector
of color image is used to calculate the gradient
directly. On this basis, the morphological marking
method of extended minimum transform H-minima
operation is introduced to mark the gradient image.
By comparing with the given threshold h, the local
minimum values whose depth is lower than the
threshold value are eliminated and the number of
local minimum points is limited, which is similar to
the process of filling shallow water basins with
irrigation (Soille P, 2008).
2.1 Color Image Gradient Algorithm
There are two general gradient algorithms for color
image gradient algorithm. One is to simply
decompose the color image into three gray images,
solve the gradients of the three gray images
respectively, and then add them together. However,
because the edge direction of the three components
of the image may not be the same, the gradient
synthesis results of the three independent
components are not accurate enough; the other is the
method of finding the gradient directly by the color
image vector used in this paper, which is as follows:
b
x
B
g
x
G
r
x
R
u
(1)
(2)
Assume that , and is the dot product
of u, v, which is:
222
x
B
x
G
x
R
uug
xx
(3)
222
y
B
y
G
y
R
vvg
yy
(4)
y
B
x
B
y
G
x
G
y
R
x
R
vug
xy
(5)
From this, we can get the vector gradient, which
is represented by the angle as follows:
]
)(
2
arctan[
2
1
),(
yyxx
xy
gg
g
yx
(6)
The value of the change rate in the direction θ is
obtained as follows:
1/ 2
1
F( , ) [ ( ) cos 2
2
()2sin2]
xx yy
xx yy xy
xy g g
gg g
(7)
b
y
B
g
y
G
r
y
R
v
xx
g
yy
g
xy
g
ICVMEE 2019 - 5th International Conference on Vehicle, Mechanical and Electrical Engineering
348

2.2 Extended Minimum
Transformation Operation
The gradient image is subjected to an extended
minimal transformation operation with a depth
threshold of h, that is:
min( )
mark
f
Hfh
(8)
Where
f
is the color gradient image;
mark
f
is
the marked image;
min( )H
represents the
morphological H-minima transform; h is the setting
depth threshold.
The larger the value of the depth threshold h, the
less the number of minimum points to be marked,
the less the number of divided regions, but the
boundary may be inaccurate. The depth threshold
can be set by the specific segmentation object and
the segmentation requirement, and the reasonable
segmentation result can be achieved.
After the marked image is obtained by the
extreme mark, the gradient image is corrected with
the minimum operation of morphology, so that the
local minimum region of the image only appears in
the marked position, and the other pixel values will
be "push-up" as needed in order to delete other local
minimum regions. The corrected gradient image
is:
(9)
Where represents the morphological
minimum calibration operation.
The watershed segmentation operation is carried
out on the modified gradient image, and the initial
segmentation image of machine-harvested cotton is
obtained.
(10)
Where
()WST
represents the watershed
segmentation operator.
3 REGIONAL MERGER
There are still many over-segmented regions in the
initial segmentation images obtained by marking
watershed method, which need to be merged. In this
paper, three aspect of the spatial proximity,
saturation S and luminance I characteristic
information between regions are considered. In order
to improve the segmentation accuracy, the region
spatial proximity, saturation S and luminance I
feature information are updated iteratively in the
merging process.
Spatial adjacency represents the adjacent
relationship between regions, and only the adjacent
regions can merge when the conditions are satisfied.
In the concrete operation, the image block after the
initial segmentation is marked in the region, and the
adjacent relationship between the regions is
represented in the form of adjacent relation table (Li,
2014). As shown in Fig. 1, assuming that there are 5
segmented regions in the image, such as A, B, C, D,
E, it is necessary to merge the region of the image
according to the spatial proximity.
Figure 1. Image segmentation region sketch map.
The table of adjacent relationships established
according to this is shown in Table 1. ``1'' in the
relational table indicates that two areas are
contiguous, and``0'' means not. In the calculation,
first judge whether the two regions are adjacent
areas according to the numbers``0'' or``1'' in the
adjacent relation table. If adjacent, further judge
whether the areas can be merged according to the
area color information. In the process of merging
two adjacent regions that meet the judgment
conditions, the unified marking numbers of two
regions and the elimination of watershed ridge line
are completed according to the statistics of the
number of marks in the eight neighborhood of pixels
on the watershed ridge line.
Table 1. Adjacency relation table.
Adjacency
relation
Area name
A B C D
Area
name
A 0 1 0 0
B 1 0 1 1
C 0 1 0 1
D 0 1 1 0
ws
f
min( )
ws mark
fIM ff
min( )IM
()
ws ws
f
WST f
Segmentation Algorithm for Machine-Harvested Cotton based on S and I Regional Features
349

The iterative operation of the merging process is
realized by programming. With the progress of the
iterative process, the algorithm updates the
segmented region graph and the adjacent relation
table, and updates the color feature information of
the merged new region at the same time.
Color information feature is a key factor to
determine the regional similarity of machine-
harvested cotton images. In the image of machine
picking cotton, the color information of cotton and
impurity is complex. The preliminary research
shows that the saturation of impurity is generally
higher than that of cotton, and the brightness of
cotton is higher than that of impurity. Therefore, the
characteristic information of saturation S and
brightness I is used to distinguish cotton from
impurity effectively. In the process of programming,
we first judge whether the two regions are adjacent,
then judge whether the region saturation S and
brightness I conform to the threshold setting, and
merge the regions that conform to the threshold.
4 PROCESS OF IMPURITY
DIVISION ALGORITHM
In this paper, the marked watershed algorithm and
the region merging algorithm based on color
information are combined to segment the cotton
impurities. The algorithm has strong anti-noise
ability and good stability. Firstly, the median filter is
carried out to obtain the filtered color gradient
image, the marked image is obtained by extended
minimum transform operation, the gradient image is
modified by morphological forced minimum
operation, the initial segmented image is obtained by
watershed algorithm on the modified gradient image,
and then the segmented region is merged. The
regional adjacent relationship table is established,
the adjacent regions are initially merged by the
brightness threshold, and the rigid lobe and other
regions in the image are merged by the saturation
threshold, so as to obtain the final merged picture. In
this process, the saturation of impurities is generally
higher, the brightness of dark impurities is low, and
the brightness of cotton is higher. The algorithm
flow is shown in Fig. 2.
Figure 2. Flow chart of machine-harvested cotton
impurities segmentation.
5 EXPERIMENTAL ANALYSIS
5.1 Test Materials and Devices
The image acquisition device, as shown in Fig. 3,
mainly includes cotton storage device, light source
bracket, industrial camera, quartz glass plate, light
source, camera support, shield, dark room and
computer. The experimental materials are machine-
harvested cotton, including leaf chips, rigid leaves,
branches, bell shell, dust and other natural
impurities. When collecting the picture, the machine
picking cotton is stored in the cotton storage device
and pressed on the quartz glass board to take
pictures at a certain pressure.
As shown in Fig. 4, the real object of the
shooting device is shown in Fig. 4. The camera is
selected from the dimension V-EM510C/ M color
area array industrial CCD camera, the resolution is
2456 pixels, 2058 pixels, the CCD size is 2/3 ", the
GigE Gigabit Ethernet output, the industrial lens is
M0824-MPW2, the focal length is 8 mm, and the
light source controller is AFT-ALP2430-02, The
Original image
Image preprocessing
(Median filtering)
Color gradient image
(Calculation of color image vector)
Marking image
(Extended minimum transformation operation)
Regional adjoining judgment
(Establishing an area adjacency matrix)
Initial regional merger
(Brightness I threshold)
Final regional merger
(Saturation S threshold)
Watershed segmentation image
(Watershed algorithm)
Modified gradient image
(Morphological forced minimum operation)
End
ICVMEE 2019 - 5th International Conference on Vehicle, Mechanical and Electrical Engineering
350

illumination light source is a four-section bar-shaped
LED diffuse light source AFT-WL21244-22W.
Figure 3. Image acquisition device.
1- Cotton storage device 2-Quartz glass plate 3-Light
source 4-Light source bracket 5-Industrial camera 6-
Camera bracket 7-Dark room 8-Shield 9-Computer
Figure 4. Shooting device photo.
5.2 Example Segmentation Analysis
The pictures were collected and taken by the
experimental device, and the examples of cotton
picking by machine were analyzed. Fig. 5 is the
original image of a typical example, and Fig. 6 (a) is
the image after filtering the median value of the
original image. Because the image contains small
impurities such as dust and miscellaneous, it needs
to be filtered by small window. Fig. 6 (b) is a
segmented image obtained directly by using
watershed algorithm based on color gradient image.
It can be seen that the phenomenon of over-
segmentation is very serious. In order to eliminate
the phenomenon of over-segmentation, the marked
image is obtained by using the minimum expansion
operation, and the modified gradient image is
obtained by the forced minimum operation. The
extended minimum region image and the modified
gradient image are shown in Fig. 6 (c), Fig. 6 (d).
The initial segmentation image is obtained by
watershed operation on the modified gradient image,
as shown in Fig. 6 (e). It can be seen that the
impurity boundary in the image is very clear.
Compared with the watershed method, the
phenomenon of excessive cutting in the marked
watershed image is reduced, but it is still very
serious. Based on this, the region merging is carried
out. Firstly, the image is initially merged by using
the brightness I threshold, and the image as shown in
Fig. 6 (f) is obtained. It can be seen that the shallow
cotton area and the deeper branches, cotton leaves
are completely merged, and there are still many
areas in the rigid flap and boll shell area that have
not been merged. Then the saturation S threshold is
used to merge the rigid lobe, bell shell and other
regions in the image. As can be seen from Fig. 6 (g),
the light color region of rigid lobe and boll shell is
merged, and the dark cotton area is still segmented.
In the natural state, the color information
characteristics of rigid valve are very complex
because of external factors such as wind frosting,
diseases and insect pests. In the process of
segmentation, as long as the outer edge of rigid lobe
is completely divided and complete, it is considered
that the rigid lobe is perfect. In addition, because of
the seed cotton ball and the gap between impurities
and cotton, the cotton in this part of the image is
darker, and the cotton with dark features is
segmented separately.
Fig. 6 (h) is a segmented image obtained by
canny operator. From the segmentation effect, canny
operator can segment the darker color impurities
clearly, but for rigid lobe, bell shell, dark cotton
segmentation effect is not good, and canny operator
cannot close the edge. The algorithm proposed in
this paper has stronger anti-noise ability and higher
accuracy for rigid lobe. In this paper it is assumed
that the complete continuous edge information of
impurities can be segmented, the segmentation is
considered to be correct. In this paper, 80 images are
processed, and the average accuracy of the
segmentation method can be 92%.
Figure 5. Machine-harvested cotton photo.
Segmentation Algorithm for Machine-Harvested Cotton based on S and I Regional Features
351
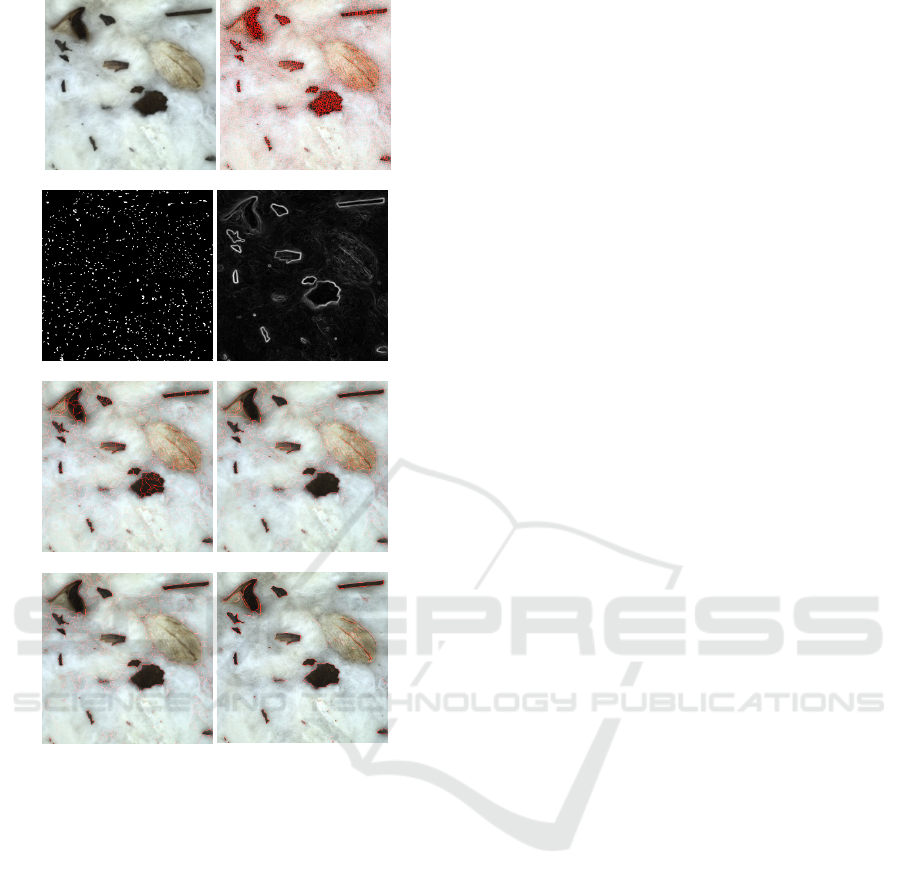
(a) (b)
(c) (d)
(e) (f)
(g) (h)
Figure 6. Image analysis process.
6 CONCLUSIONS
A natural impurity segmentation method based on S
and I region color information is proposed in this
paper for the impurities in machine-harvested cotton.
In order to reduce the phenomenon of over-
segmentation, the marked watershed algorithm is
used to obtain the initial segmentation image by
extending the minimum transform operation through
the watershed transformation algorithm of color
gradient image. The adjacent relationship among the
regions is established by the adjacent 8-pixel.
Saturation S and brightness I in HSI space are
selected as region color features for region merging,
and feature information is updated iteratively in the
process of merging, which makes the algorithm
faster and has strong robustness. The experimental
results show that the average accuracy of the
segmentation method can be 92% for the natural
impurities such as rigid flap, bell shell, branch, leaf
chip, dust and so on in machine-harvested cotton.
ACKNOWLEDGEMENTS
This work was supported in part by the Shandong
Province Natural Science Foundation of China under
Grant ZR2017LEE010, Grant ZR2019MEE113, in
part by the Shandong Provincial Key Research and
Development Plan of China under Grant
2017CXGC0215, Grant 2017CXGC0810, Grant
2018CXGC0908, and in part by the Shandong
Province Agricultural Machinery Equipment
Research and Development Innovation Plan Project
under Grant 2017YF047, Grant SD2019NJ012.
REFERENCES
Anthony W S, 1995. Impact of cotton gin machinery
sequences on fiber value and quality. Applied
Engineering in Agriculture, 12(3):351-363.
Jia D Y & Ding T H, 2005. Novel method of detecting
foreign fibers's infrared absorption characteristic.
J.Infrared Millim. Waves, 24(2):147-150.
Jiang Y & Li C Y, 2015. mRMR-based feature selection
for classification of cotton foreign matter using
hyperspectral imaging. Computers and Electronics in
Kan D H, Li D L, Yang W Z & Zhang X, 2010. Cotton
image segmentation method for online foreign fiber
inspection. Transactions of the Chinese Society for
Agricultural Machinery, 26(S2): 11-15.
Li J B, Peng Y K, Huang W Q, Zhang B H & Wu J
T,2014. Watershed segmentation method for
segmenting defects on peach fruit surface.
Transactions of the Chinese Society for Agricultural
Machinery, 45(8): 288-293.
Li Z B, Yang E W, Li J W, 2014. Color image
segmentation based on improved marked watershed
transform and region merging. Computer Engineering
and Design, 35(7): 2458-2461.
Mustafic A, Li C & Haidekker M, 2014. Blue and UV
LED-induced fluorescence in cotton foreign matter.
Journal of Biological Engineering, 1(1): 8-29.
Pai A,Sari-Sarraf H, Hequet E F, 2004. Recognition of
cotton contaminants via X-ray microtomographic
image analysis. IEEE Transactions on Industry
Applications, 40(1) : 77–85.
Qing H, Ma Y H, Zhang J X & Wang X N, 2013. Patent
analysis and discussion of cotton mechanized picking
technology in China. Agricultural mechanization in
Xinjiang, (1): 25-28.
ICVMEE 2019 - 5th International Conference on Vehicle, Mechanical and Electrical Engineering
352

Soille P, 2008. Morphological image analysis: Principles
and applications, Tsinghua University Press. Beijing,
2nd edition.
Tantaswadi P, Vilainatre J & Tamaree N, 1999. Machine
vision for automated visual inspection of cotton
quality in textile industries using color
isodiscrimination contour. Computers & Industrial
Engineering, 37(1-2): 347-350.
Wang X, Li D L,Yang W Z & Li A B, 2015. Lint cotton
pseudo-foreign fiber detection based on visible
spectrum computer vision. Transactions of the Chinese
Society for Agricultural Machinery, 46(8): 7-14.
Yang W Z, Li D L, Wei X H, Kang Y G & Li F T, 2009.
AVI system for classification of foreign fibers in
cotton. Transactions of the Chinese Society for
Agricultural Machinery, 40(12): 177-181.
Zhang C l, Li L, Dong Q C & Ge R Y, 2017. Detection
method for machine-harvested cotton impurities based
on region color segmentation. Journal of Textile
Research, 38(7):135-141.
Zhang C l, Li L, Dong Q C & Ge R Y, 2016. Recognition
method for machine-harvested cotton impurities based
on color and shape features. Transactions of the
Chinese Society of Agricultural Machinery, 47(7):28-
34.
Zhang H, Qiao X, Li Z B & Li D L, 2016. Hyperspectral
image segmentation method for plastic films in ginned
cotton.Transactions of the Chinese Society of
Agricultural Engineering, 32(13): 161-167.
Segmentation Algorithm for Machine-Harvested Cotton based on S and I Regional Features
353
