
Feasibility Study of CO2 Flooding under Gross-split Mechanism:
Simulation Approach
Muslim Abdurrahman
1
, Wisup Bae
2
, Adi Novriansyah
1
, Dadan Damayandri
3
and Bop Duana
Afrireksa
4
1
Department of Petroleum Engineering, Universitas Islam Riau,Pekanbaru, Indonesia
2
Sejong University, South Korea
3
LEMIGAS, Indonesia
4
Inha University, South Korea
Keywords:
CO
2
, Simulation Study, WAG, Gross Split, NPV
Abstract:
Importance of Carbon Dioxide (CO
2
) injection into the subsurface reservoir is essential since the concern of
global warming and climate change issues in Indonesia. Selecting the oil reservoir as a candidate for a storage
site is an attractive option due to CO
2
gas utilization is effective for Enhanced Oil Recovery (EOR) purpose.
Continuous and Water-Alternating-Gas (WAG) CO
2
flooding are the most commonly applied scenarios in the
oil and gas industries. Considering the EOR side, choosing an appropriate scenario is mandatory for cost
efficiency reason and influences the oil share amount between the Indonesian Government and operator under
the gross-split mechanism. Therefore, by using a simulation approach, the feasibility of continuous and WAG
CO
2
injection is observed to decide the most financially attractive choice. Simulation results reveal a WAG
scenario recovers slightly more oil compare to continuous injection scheme. Application of gross-split under
base-share makes both injection strategies unattractive for investors. An adjustment of government-contractor
share is required to improve the feasibility of the project.
1 INTRODUCTION
As a part of greenhouse gas (GHG) pollutant, Carbon
Dioxide (CO
2
) emission issue becomes a major
concern of major countries. Through The Kyoto
Protocol and Paris Agreement, most countries agreed
to reduce CO
2
emission level before 2050 due
to avoid the catastrophic effect of global warming
and climate change phenomena. Carbon Capture
and Storage (CCS) is the only effective scheme to
overcome this problem (Agency, 2016). However,
storing CO
2
in the aquifer is not financially satisfied
since CO
2
is injected into the storage site without
gaining any benefit during this activity. This story
may sound interesting if CO
2
storage is performed in
an oil reservoir.
Besides act as a storage site, injecting CO
2
in oil reservoir may bring another benefit in form
oil production enhancement, commonly known as
CO
2
-Enhanced Oil Recovery (CO
2
-EOR). CO
2
-EOR
has successfully implemented in North America for
more than a decade, either using the natural or
anthropogenic source (Whittaker et al., 2011; Jishun
et al., 2015). Mostly CO
2
Flooding Targets crude
oil contains high intermediate component because
the miscible condition of CO
2
and crude oil can
be achieved under reservoir condition (Abedini and
Torabi, 2014). Minimum Miscibility Pressure (MMP)
determination is mandatory in designing the injection
scenario. MMP can be determined through slim-tube,
swelling, vanishing interfacial tension, and rising
bubble experiments. Moreover, PVT and slimtube
simulation methods are capable to estimate MMP
with a reasonable gap with experimental work
(Abdurrahman et al., 2015).
Besides MMP, Deciding the injection scheme is
also important for CO
2
flooding because it relates
to the efficiency of CO
2
utilization in displacing
residual oil. In terms of CO
2
utilization factor.
Statistically, more than one barrel (bbl) Oil can be
produced by injecting 1 million standard cubic feet
of CO
2
(Azzolina et al., 2015). CO
2
utilization
factor implicitly has an effect to the feasibility of
the CO
2
flooding project because it correlates to how
Abdurrahman, M., Bae, W., Novriansyah, A., Damayandri, D. and Afrireksa, B.
Feasibility Study of CO2 Flooding under Gross-split Mechanism: Simulation Approach.
DOI: 10.5220/0009063200150019
In Proceedings of the Second International Conference on Science, Engineering and Technology (ICoSET 2019), pages 15-19
ISBN: 978-989-758-463-3
Copyright
c
2020 by SCITEPRESS – Science and Technology Publications, Lda. All rights reserved
15
much CO
2
gas should be provided, i.e., how much
fund is required for purchasing CO
2
or constructing
CO
2
anthropogenic capture facilities. Deciding to
use CO
2
from CCS activity potentially reduce the
CCS cost itself (Rubin et al., 2015). Therefore,
CO
2
-EOR, either from natural or anthropogenic,
i.e., from CCS, may bring a financial interest if
properly implemented, including the injection scheme
selection.
Deciding the most suitable scheme of CO
2
flooding is risky and relates to the oil share between
the Indonesian government and operator because
Indonesia adopts production share mechanism.
Indonesia adopted a relatively new oil share
mechanism, known as gross-split. This mechanism
is officially introduced and effectively valid since
2017. This new mechanism still has to be improved
because indicating an undesirable profit for the
operator, feasibility study of CO
2
by considering
injection scheme under gross-split mechanism is
another interesting topic for the researchers (Irham
and Julyus, 2018).
This Paper analyses under simulation method
the feasibility of CO
2
flooding scheme by using
gross-split mechanism. Two injection strategies, CO
2
Continuous injection and CO
2
Water Alternating Gas
(WAG) are compared their capability in recovering
residual oil after primary stage and also feasibility
during CO
2
flooding stage. Mathematical model
represents one of Indonesia oil field condition
was generated by using BUILDER generator and
simulated under GEM simulator. Both of these
modules are licensed under CMG Software. Results
from the GEM simulator will be analyzed its
feasibility for each injection scenario. Injection
scenario is decided by considering the economic
parameter such as NPV and IRR.
2 METHODOLOGY
The reservoir grid model from Indonesia oil field is
used for demonstrating the field-scale CO
2
flooding
in this study. This grid model consists of more
than 7,800 cells with 56, 46, and 3 cells along x,
y, and z directions (represented as i, j, and k in the
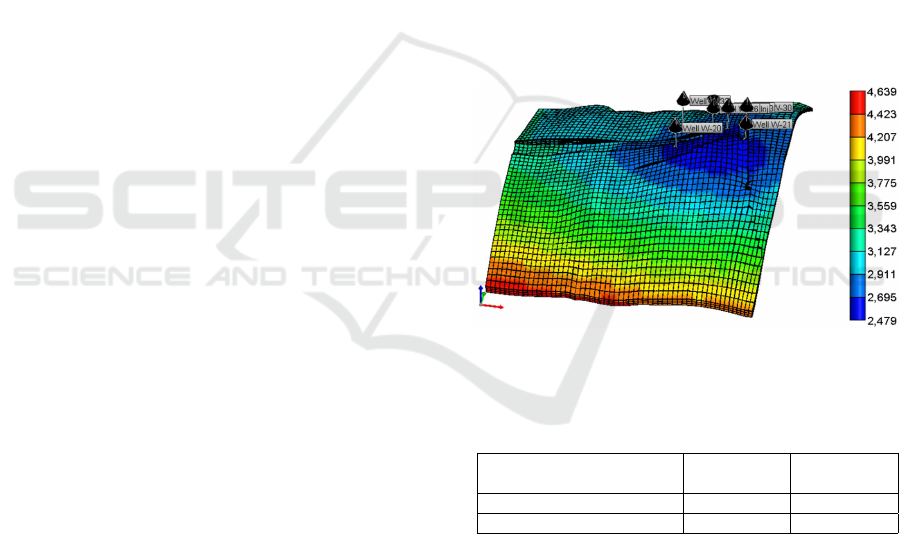
software). Figure 1 shows the grid model with its
grid-top parameter. The average permeability is quite
low, ranged from 30 to 100 millidarcy (md). The
range of porosity of 0.13 to 0.19. The pore-volume of
this model is 0.83 billion reservoir cubic feet (cuft).
Figure 2 and 3 depict the relative permeability (k
r
)
plot for water-oil and gas-oil systems, respectively.
The relative permeability model in this study is
obtained directly simulation study (Millah, 2014).
In the oil-water system, k
r
is plotted over water
saturation (s
w
) and gas saturation (s
g
) for gas- oil
system. Subscript o, w, and g in figure 2 and 3 are
oil, water, and gas. Twelve injectors are planned to
inject CO2 under continuous and WAG scenarios and
the performance will be analyzed based on production
data on 5 production wells (location of the wells
are shown in Figure. 4). Total injection volume is
limited on 0.6 PV due to economic reason and the 1:1
WAG ratio is selected because this ratio is common in
field-scale operation (Christensen et al., 1998). 2%
Half Cycle Slug Size (HCSS) is designed for this
study. Configuration of CO2 and water injection rate
are tabulated in Table 1.
The model is simulated from 1996 until the end of
2013 for primary recovery stage and continued to 10
years CO
2
flooding under scenario in Table 1 until the
injection period is finished (2024). The oil production
during this CO
2
flooding simulation is recorded for
feasibility calculation.
Figure 1: The grid model that is used in this study, the color
legend represents the grid top of the cell in feet unit.
Table 1: Gas and water injection rate in CO2 flooding
scenarios. “Mscf” means thousand standard cubic feet.
Injection Scenario
Gas Rate Water rate
(Mscf/day) (bbl/day)
Continuous CO
2
injection 1463 -
WAG 1463 1873
Figure 5 draws Schematic share diagram of Gross
Split between government and operator (mentioned
as ”contractor” in this diagram). The difference of
this new mechanism with previously cost-recovery
mechanisms is the contractor must bear every
operating cost, risk, and all taxes. The government
and contractor shares are divided from the gross oil
production while in the cost recovery mechanism, the
oil should be shared to both parties after deducted
from cost recovery post. Three variable influences
the share of government and contractor, e.g., Base
split, variable component, and progressive component
ICoSET 2019 - The Second International Conference on Science, Engineering and Technology
16
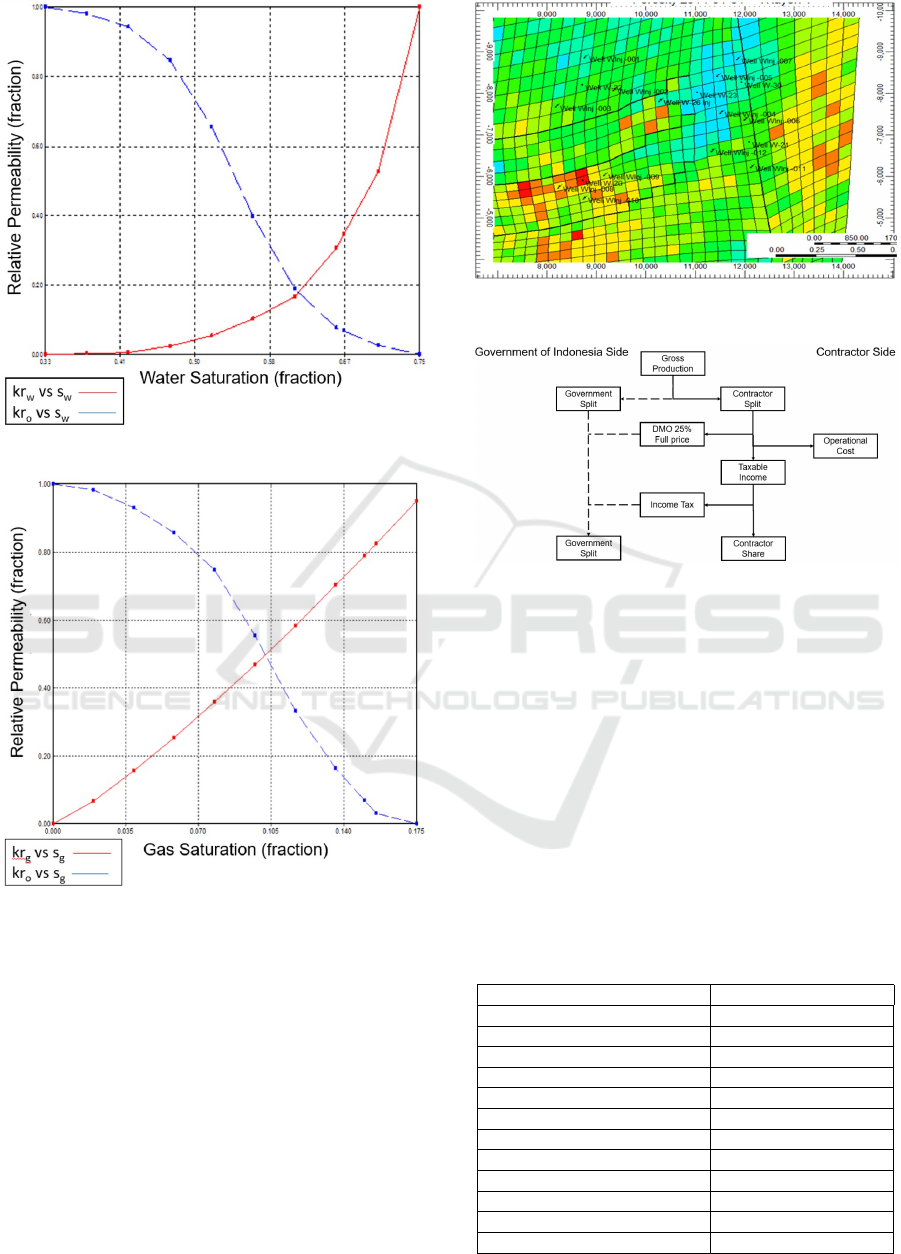
Figure 2: Relative permeability curve for water-oil system.
Figure 3: Relative permeability curve for gas-oil system.
(Giranza and Bergman, 2018). These variables are
affected by field condition, development status, and
oil price (Roach and Dunstan, 2018).
Several assumption will be made for studying the
feasibility of CO
2
flooding project in this field. The
oil price for this study is assumed 90 US$/bbl and
the share for government and contractor is under base
split (57% - 43%). Moreover, the Indonesian tax is
assumed 45% (Roach and Dunstan, 2018). All cost
and revenue components in this study are tabulated
in Table 2, based on study of Jarrel et al. (2002).
This study also utilized recycled CO
2
and water from
the recycling facilities whereby the annual handling
Figure 4: Distribution of injection and production wells in
the grid model.
Figure 5: Schematic diagram of Indonesia gross-split
mechanism.
capacity of which are 18 MMSCF CO
2
and 730
thousand barrels of water. The Weighing average cost
of capital (WACC) for this study is 12%. Net Present
Value (NPV) of each scenario is will be compared.
3 RESULT AND DISCUSSION
Figure 6 compares the annual production during 10
years continuous CO
2
Flooding and WAG, while the
cumulative production on each scenario are plotted
Table 2: Cost and revenue components assumptions in this
study.
Cost or revenue components Value
Injection well cost 0.600 MMUS$/well
Production well cost 0.450 MMUS$/well
Well completion 0.200 MMUS$
Water injection capital cost 0.011 MMUS$/well
CO2 facility capital cost 0.012 MMUS$/well
Production facility capital cost 0.027 MMUS$/well
Water Injection Cost 1.000 US$/bbl
CO2 Price 2.500 US$/Mscf
Chemical Cost 0.020 MMUS$/well/yr.
CO2 recycle OPEX 0.750 US$/mscf
Water Recycle OPEX 0.300 US$/bbl
Oil Price 90 US$/bbl
Feasibility Study of CO2 Flooding under Gross-split Mechanism: Simulation Approach
17
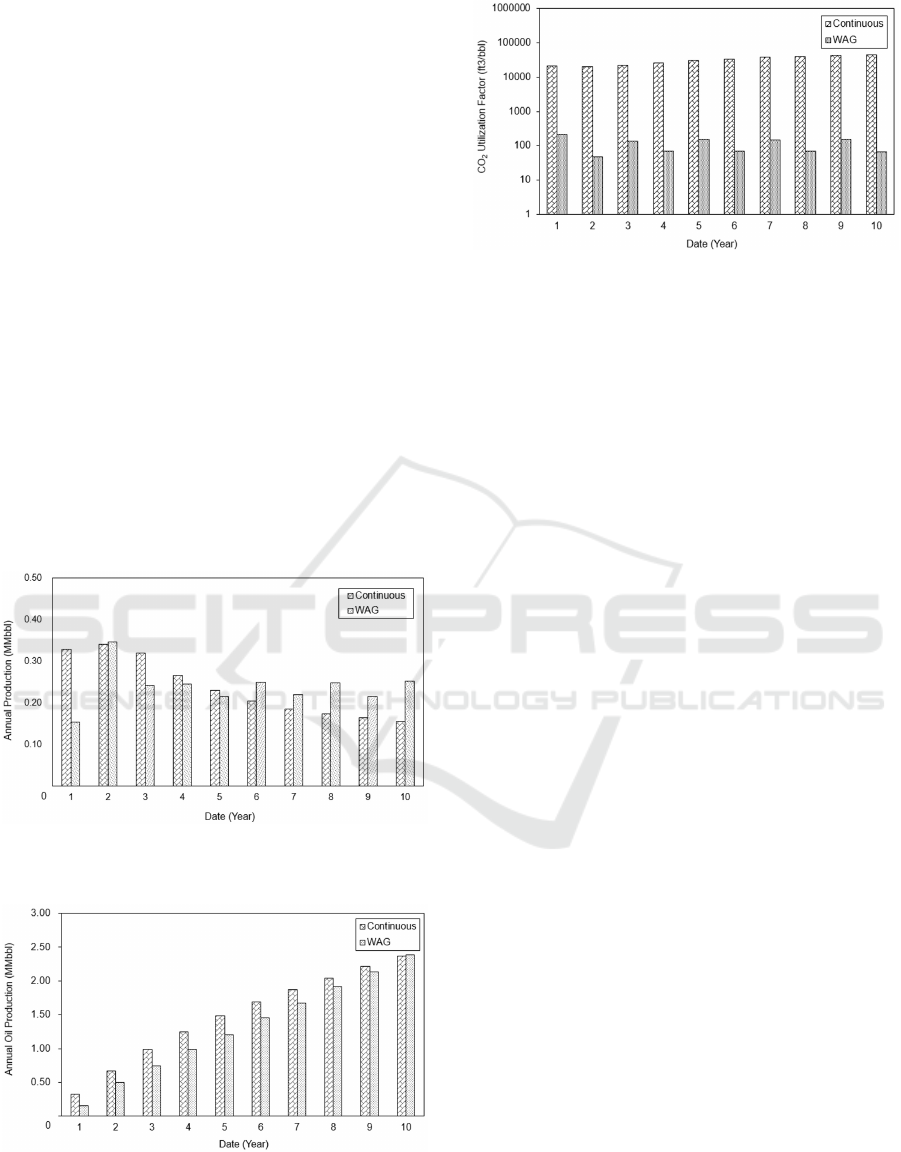
in Figure 7. Continuous CO
2
injection shows higher
productivity over WAG during two years injection
and gradually decrease for the rest period. It
is contrast with performance under WAG scenario
where the oil recovery is still low in the first year but
significantly increase more than 120% in the second
year. Productivity on WAG tend to show a stable trend
for the next seven years. Results from the figure 7
indicates the WAG application can recover oil slightly
more than continuous flooding scenario with 1%
recovery gap, i.e. the 10-years oil recovery is same. In
terms of CO
2
utilization factor, a ratio of Injected CO
2
to the amount of oil production, simulation results
shows low CO
2
utilization factor is revealed for WAG
scenario, means requires less CO
2
to produce one
barrel of oil. Comparing the data trends on both
scenarios clearly indicates a continuous growth of
CO
2
utilization factor, indicates the requirement to
produce crude oil becomes higher over the time, while
WAG shows a decreasing trend. WAG is effective to
overcome the gravity segregation issue, compare to
continuous CO
2
flooding. Due to lower density. CO
2
tend to move upwards in the reservoir, resulting a poor
displacement efficiency (Jaafar et al., 2014),
Figure 6: Annual oil production during CO
2
flooding phase
for each scenario.
Figure 7: Annual Cumulative oil production during CO2
flooding phase for each scenario.
Despite both injection strategies shows same
achievement in term of oil recovery, WAG option
Figure 8: Annual CO2 utilization factor for continuous and
WAG CO2 flooding.
is more attractive because consume less CO
2
inducing low CO
2
Purchase cost. Comparing
these scenarios under gross-split mechanism reveal
unprofitable conclusion, as indicates in negative
value of NPV (Figure 9). Therefore, base-share
between government and contractor is not feasible
from the contractor side, means share adjustment
between these shareholders are required. The
government-contractor share is then adjusted to
35%-65% because these share is suitable for high
operating cost, i.e., both CO
2
flooding scenarios are
categorized into high operating cost projects (Roach
and Dunstan, 2018). Recalculation of NPV under
this new share results negative NPV for continuous
injection project (-30.5 MM$) and 6.9 MM$ for
WAG, means WAG scenario is more profitable.
Moreover, the Internal Rate of Return (IRR) of this
project indicate a significant profit can be made
during this injection period, i.e., the IRR is higher
than Indonesia WACC (32.7% compare to 8%). In
short, CO
2
WAG scenario is effective in displacing
residual oil and also more profitable than another
option. Share adjustment in this study may be an
evidence on the urgency CO
2
issue in Indonesia
gross-split mechanism. Therefore, it is recommended
to include CO
2
issue into the variable and progressive
share components.
The information shared to the all of communities.
A monitor with all the information related to the water
quality installed at the community center or at the
point of common assembly of community for easy to
delivery of information. Furthermore, all the people
and community can have an access to information
shows including the status of river water levels. Based
on monitoring system then all the information is
update for public service and knows the status of the
river.
ICoSET 2019 - The Second International Conference on Science, Engineering and Technology
18
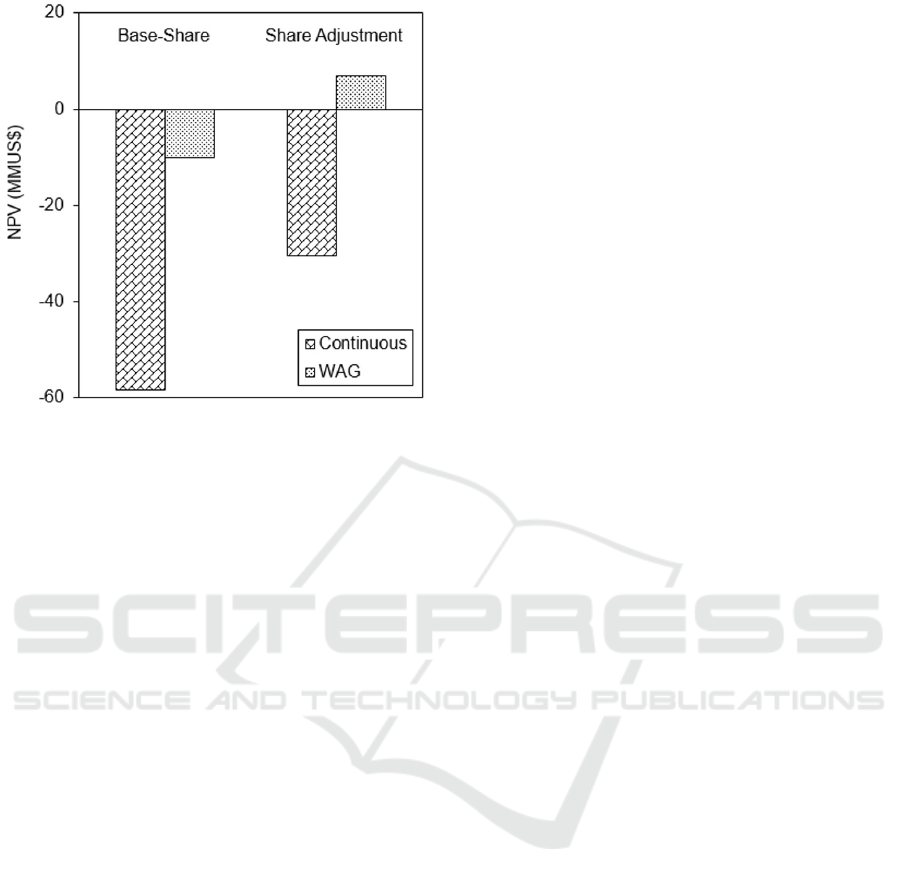
Figure 9: Effect of share adjustment to NPV for continuous
and WAG CO
2
flooding.
4 CONCLUSIONS
This paper analyze the feasibility of CO
2
project
under Indonesia gross split mechanism by using
reservoir simulation method. One of Indonesia oil
field reservoir is modelled for this study, where the
CO
2
injection schemes is limited to continuous and
WAG scenarios. Simulation results reveals a better
performance of WAG in recovering remaining oil in
the reservoir. Moreover, feasible indication is shown
on WAG scheme after adjusting the base share of
government and contractor. Including the CO
2
issues
into the variable and progressive share, points may
increase the tendency of CO
2
flooding application in
Indonesia
REFERENCES
Abdurrahman, M., Permadi, A., and Bae, W. (2015). An
improved method for estimating minimum miscibility
pressure through condensation–extraction process
under swelling tests. Journal of Petroleum Science
and Engineering, 131:165–171.
Abedini, A. and Torabi, F. (2014). Oil recovery
performance of immiscible and miscible co2
huff-and-puff processes. Energy & Fuels,
28(2):774–784.
Agency, I. E. (2016). 20 Years of Carbon Capture
and Storage: Accelerating Future Deployment.
International Energy Agency.
Azzolina, N. A., Nakles, D. V., Gorecki, C. D., Peck,
W. D., Ayash, S. C., Melzer, L. S., and Chatterjee,
S. (2015). Co2 storage associated with co2 enhanced
oil recovery: A statistical analysis of historical
operations. International Journal of Greenhouse Gas
Control, 37:384–397.
Christensen, J. R., Stenby, E. H., Skauge, A., et al.
(1998). Review of wag field experience. In
International petroleum conference and exhibition of
Mexico. Society of Petroleum Engineers.
Giranza, M. and Bergman, A. (2018). Indonesia’s new
gross split psc: Is it more superior than the previous
standard psc. Journal of Economics, Business and
Management, 6.
Irham, S. and Julyus, P. (2018). The new energy
management policy: Indonesian psc-gross-split
applied on steam flooding project. In IOP Conference
Series: Earth and Environmental Science, volume
106, page 012109. IOP Publishing.
Jaafar, M., Omar, S., Anuar, S., and Suradi, S.
(2014). Reservoir monitoring of eor processes (wag,
foam and polymer) using streaming potential. In
Scientific Cooperations International Workshops on
Engineering Branches, pages 8–9.
Jarrell, P. M., Fox, C. E., Stein, M. H., and Webb, S. L.
(2002). Practical aspects of CO2 flooding, volume 22.
Society of Petroleum Engineers Richardson, TX.
Jishun, Q., Haishui, H., and Xiaolei, L. (2015). Application
and enlightenment of carbon dioxide flooding in the
united states of america. Petroleum Exploration and
Development, 42(2):232–240.
Roach, B. and Dunstan, A. (2018). The indonesian psc: the
end of an era. The Journal of World Energy Law &
Business, 11(2):116–135.
Rubin, E. S., Davison, J. E., and Herzog, H. J. (2015). The
cost of co2 capture and storage. International Journal
of Greenhouse Gas Control, 40:378–400.
Whittaker, S., Rostron, B., Hawkes, C., Gardner, C., White,
D., Johnson, J., Chalaturnyk, R., and Seeburger, D.
(2011). A decade of co2 injection into depleting
oil fields: Monitoring and research activities of the
iea ghg weyburn-midale co2 monitoring and storage
project. Energy Procedia, 4:6069–6076.
Feasibility Study of CO2 Flooding under Gross-split Mechanism: Simulation Approach
19
