
Groundwater Exploration using 2D Electrical Resistivity Imaging (ERI)
at Kulim, Kedah, Malaysia
Adi Suryadi
1
, Muhammad Habibi
2
, Batara
3
, Dewandra Bagus Eka Putra
1
, Husnul Kausarian
1
1
Department of Geological Engineering, Universitas Islam Riau, Pekanbaru, Indonesia
2
GWS Drilling Engineeering Sdn. Bhd., No. 6 Jalan Metro Perdana Timur 11, Kuala Lumpur, Malaysia
3
School of Ocean and Earth Science, Tongji University, Guokang Rd, Yangpu Qu, Shanghai Shi, China
Keywords:
2D Electrical Resistivity Imaging (ERI), Dipole-Dipole, Groundwater, Resistivity, Kulim, Malaysia
Abstract:
Water demand in the study area has been increasing by time but surface water is not sufficient to fulfil the
demands. 2D Electrical Resistivity Imaging (ERI) survey was conducted in order to looking for groundwater
potential as freshwater alternative resources at Kulim, Kedah, Malaysia. The data acquisition was carried
out using 5 meters multi-electrodes spacing with pole-dipole configuration array. The geophysical survey
involved both resistivity and chargeability at the same time. The result of 2D Electrical Resistivity Imaging
indicated that the groundwater potential area has low resistivity value with range 10 – 100 Ωm. Groundwater
potential zone divided into 2 characteristics which is shallow groundwater zone (>75m in depth) and deep
groundwater zone (>100m in depth). The groundwater potential zone covered by high to very high resistivity
value. Those high resistivity value 200 – 1000 Ωm interpreted as dry top soil at near surface while at deep
zone is interpreted as fresh bedrock. Chargeability value of groundwater potential area ranging from 0 up to 8
msec. All interpretation later confirmed by drilling data.
1 INTRODUCTION
Geo-electrical survey is a survey that looking
the physical parameters which is resistivity value
to differentiate subsurface material. Recently,
the interest of underground sources of water is
increasing rapidly to fulfilled the water demand(A
Suryadi et al., 2019). Electrical Resistivity
Imaging (ERI) is the most common and successfully
used especially in groundwater exploration and
environmental problems(Azhar et al., 2016; Hamzah
et al., 2008; Hamzah et al., 2007; Jumary et al.,
2002; Saad et al., 2012). By using ERI, resistivity
distribution of subsurface will be modelled into
two-dimensional image(A Suryadi et al., 2019). The
model that resulted is showing the apparent resistivity
value which can be interpret depend on the value.
The study area is located at Silterra Malaysia
SdnBhd at Lot 8 and 9 in Kulim, Kedah, Malaysia
with coordinate N 5024’18.24” and E100035’33.09”.
The shortage of piped water supply at headquarters
Silterra has caused considerable problems to several
activities of the central area. The supply of water to
the central area is insufficient due to high demand
of water. Long period of dry season also affected
to hydrogeology cycle. This water problem is
not only caused problem to the factory but it also
affected the nearby residential area(Adi Suryadi et
al., 2019). So, aim of this study is to locate and
delineate groundwater potential zone as alternative
water resources at study area.
The area is located about 10 km from Pekan Kulim
and about 3 km from Sungai Jarak. Secondary forest
and palm oil plantation are covered the study area
with almost flat topography (Figure 1). It easily to
reach the location by using a car. Nine (9) lines of
2D Electrical Resistivity Imaging (ERI) survey were
conducted with length of survey line up to 400 m
(Figure 2).
2 GEOLOGICAL SETTING OF
STUDY AREA
Geology of Study area is consist of granite and
surround by metamorphic rock (slate, phyllite and
schist) and sedimentary rock (sandstone, siltstone and
shale) (Figure 3). Granite of study area known as
Kulim granite that consist of two main types, namely
Suryadi, A., Habibi, M., Batara, ., Eka Putra, D. and Kausarian, H.
Groundwater Exploration using 2D Electrical Resistivity Imaging (ERI) at Kulim, Kedah, Malaysia.
DOI: 10.5220/0009065600350040
In Proceedings of the Second International Conference on Science, Engineering and Technology (ICoSET 2019), pages 35-40
ISBN: 978-989-758-463-3
Copyright
c
2020 by SCITEPRESS – Science and Technology Publications, Lda. All rights reserved
35

medium to coarse grained biotite granite and the
sparsely porphyritic micro-granite. Both of them are
almost similar in mineral contain except the former
also contain traces of galena, pyrite and garnet. The
essential of mineral in the granite are K-feldspar,
plagioclase, quartz, biotite and muscovite. K-Ar
mineral ages for biotite sparates from pink porphyritic
Penanti granites (north of Bukit Mertajam) defined
an age 196±8 Ma. K-Ar mineral ages for biotite
and muscovite sparates from the Karangan biotite
granite (northeast Kulim) gave an age of 190±10 and
180±10 Ma respectively(Hutchison, 1989).
Figure 1: Topography map that show location of study area
is almost flat.
Figure 2: Satelite image of study area that shown line survey
location.
3 METHODOLOGY
ABEM SAS1000 resistivity meter and ABEM Lund
ES464 selector system is the equipment that used
Figure 3: Geological Map of study area that consist
of granite and surrounded by sedimentary rock and
metamorphic rock(Hutchison, 1989).
to collect the resistivity data. The survey employed
61 multi-electrodes with 5 m minimum electrode
spacing. The line survey length is reach 400 m
that arranged in a straight line. The selector system
was connected with all electrodes through multi-core
cable (Figure 4)(Loke and Barker, 1995)(Azhar et
al., 2016; Hamzah et al., 2008; Loke and Barker,
1995; A Suryadi et al., 2019). In each measurement
the resistivity meter only select four electrodes to
activate. Beside of that, coordinate of line survey
must be recorded to correlate all the lines taken
(Kausarian et al., 2018, 2016; Lubis et al., n.d.;
LUBIS et al., 2018; Suryadi, 2016)
Apparent resistivity (ρa) calculated by multiple of
geometry factor (k) with Voltage (V) and divided by
Current (I) injected.
ρa = kV /I (1)
Geometry factor (k) is depend on configuration
electrode that utilized. In this study configuration
used id pole-dipole (Figure 5) that k calculated with
formula:
k = 2π(b(a + b))/a (2)
a is the distance from P1 to P2; b is the distance from
C1 to P1
ICoSET 2019 - The Second International Conference on Science, Engineering and Technology
36

Figure 4: Equipment set up to acquisition resistivity
data(Loke and Barker, 1995)
Figure 5: Equipment set up to acquisition resistivity
data(Loke and Barker, 1995)
The data collected processed by using inverse
modelling software which is RES2DINV. The result
of inverse modelling will interpreted based on
apparent resistivity and proven by drilling data.
4 RESULT AND DISCUSSION
Nine (9) ERI lines survey data has been processed in
order to produce 2D inversion model of resistivity.
The resistivity value representing the subsurface
condition of study area. There are two typical of
groundwater potential zone in this study which are
deep groundwater potential and shallow groundwater
potential.
Figure 6 is the result of line 6 show the typical
2D ERI result of study area with deep groundwater
potential. Generally, resistivity value can be grouped
into 3 layers or zones. First zone with moderate
to high resistivity value (100 – 1000 Ωm) that
represented by colour orange to purple near surface
is interpreted as top soil. Usually soil always showing
moderate to low resistivity value because it has high
moisturized due to subtropical area(N. Nwankwo and
O. Emujakporue, 2012; A Suryadi et al., 2019).
But in this study top soil showing high resistivity
value, this value indicating the condition of soil is
dry. Below top soil, resistivity value is extremely
high represented by red to dark purple in colour
with resistivity range 300 to 2000 Ωm. this layer is
interpreted as fresh bedrock layer. Based on geology
regional of study area, bedrock of the site is consist
of granite. The third layer is located about 100 m
in depth from surface with low resistivity profile (10
– 100 Ωm). This layer showed by bright green to
yellow in colour. From those resistivity value, the
third layer is interpreted as groundwater potential area
because water saturated zone are conductive zone that
easily to transfer electrical current. From the result
of chargeability also support the interpretation with
showing low chargeability (2 – 20 msec).
Another typical of groundwater potential zones is
representing by result of line survey 7 (Figure 7). This
result also divide into 3 layer. The first layer is dry
top soil layer with resistivity value range (100 – 1000
Ωm), followed by very high resistivity value (300 –
2000 Ωm) that interpreted as granite fresh bedrock.
In granite zone there is an anomaly resistivity value
with coning shape at depth 25 to 75 m. This zone has
low resistivity profile which is 3 – 100 Ωm interpreted
as shallow groundwater potential. It also linear with
chargeability result that showing low chargeability
value 2 – 8 msec. Table 1 showing all the groundwater
potential zone from 9 survey lines.
From the result of 2D Electrical Resistivity
Imaging (ERI), some location that has groundwater
potential has been drilled to prove either it actually
water saturated zone or not. Besides that, drilling data
also proven for all geological interpretation based
on resistivity value. Table 2 is drilling location
coordinate according to groundwater potential zones
that has been interpreted.
Table 1: Groundwater potential zone characteristic and
location based on 2D ERI
Survey line
Groundwater potential zone
Resistivity
(Ωm)
Chargeability
(msec)
Depth (m) Location
from 1
st
electrode
(m)
Line 1 8 - 110 0 – 2 75 – 125 80 – 180
Line 2 10 – 100 8 – 12 ¿ 125 225 – 255
Line 3 2 – 100 2 – 5 75 – 150 80 – 210
Line 4 3 – 100 1 – 5 75 – 125 140 – 265
Line 5 20 – 100 0 – 1 125 – 150 150 – 230
Line 6 10 – 100 2 – 12 100 – 125 140 – 240
Line 7 1 – 100 0.5 – 5 25 – 75 185 – 280
Line 8 20 – 100 2 – 12 50 – 100 215 – 290
Line 9 1 – 100 1 – 2 25 – 50 185 – 220
PDL 6 and PDL 7 are located at survey line 6 and
survey line 7. Based on drilling data PDL 6 (Figure
8) from the surface to 6 is consist of top soil with
characteristic light yellowish brown in color,soft and
slightly silty clay. From 6 m to 12 m the material
is firm fine sandy silty clay with color light reddish
brown. Hard layer of clay found at depth 12 m up to
30 m. starting from 30 of depth till the end of drilling
(300 m) represented by weathered granite. At 100 m
and 280 m of depth was identified as fractured zone.
In conjunction between 2D ERI result of line 6 and
drilling data of PDL 6 can be correlated. The low
Groundwater Exploration using 2D Electrical Resistivity Imaging (ERI) at Kulim, Kedah, Malaysia
37
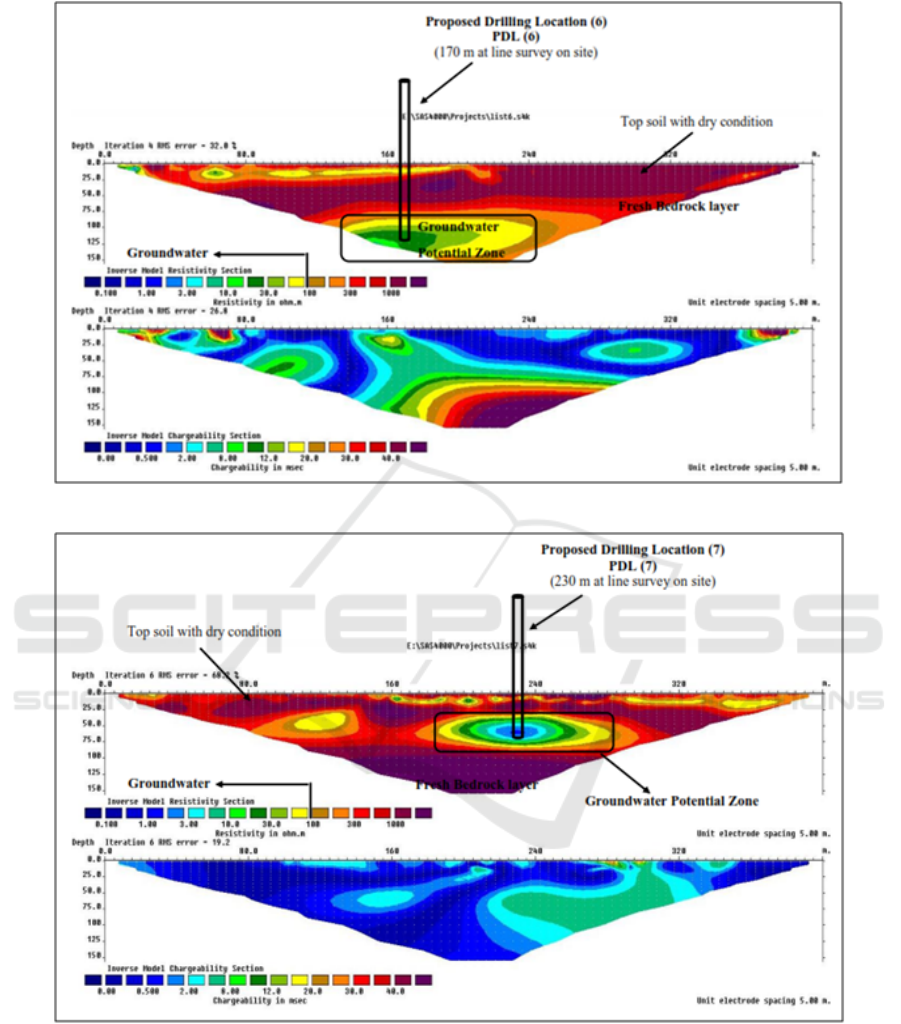
Figure 6: 2D Electrical Resistivity Imaging result of line survey 6
Figure 7: 2D Electrical Resistivity Imaging (ERI) result of line survey 7
resistivity value (10 – 100 Ωm) from 2D ERI result at
depth 125 interpreted as groundwater potential zone
and it supported by drilling data. According the
drilling data, at 100 m of depth found fractured zone
of granite that has very high possibility as secondary
porosity to preserve groundwater resources.
PDL 6 and PDL 7 are located at survey line 6 and
survey line 7. Based on drilling data PDL 6 (Figure
8) from the surface to 6 is consist of top soil with
characteristic light yellowish brown in color,soft and
slightly silty clay. From 6 m to 12 m the material
is firm fine sandy silty clay with color light reddish
brown. Hard layer of clay found at depth 12 m up to
30 m. starting from 30 of depth till the end of drilling
ICoSET 2019 - The Second International Conference on Science, Engineering and Technology
38

Table 2: Coordinate of drilling location
Name
Coordinate
Latitude Longitude
PDL 1 5
◦
24’ 18.37” N 100
◦
35’ 30.99” E
PDL 2 5
◦
24’ 14.66” N 100
◦
35’ 32.62” E
PDL 3 5
◦
24’ 17.38” N 100
◦
35’ 32.08” E
PDL 4 5
◦
24’ 17.02” N 100
◦
35’ 29.32” E
PDL 5 5
◦
24’ 9.63” N 100
◦
35’ 31.84” E
PDL 6 5
◦
24’ 8.63” N 100
◦
35’ 30.23” E
PDL 7 5
◦
24’ 11.07” N 100
◦
35’ 30.10” E
PDL 8 5
◦
24’ 15.95” N 100
◦
35’ 32.20” E
PDL 9 5
◦
24’ 15.48” N 100
◦
35’ 30.02” E
(300 m) represented by weathered granite. At 100 m
and 280 m of depth was identified as fractured zone.
In conjunction between 2D ERI result of line 6 and
drilling data of PDL 6 can be correlated. The low
resistivity value (10 – 100 Ωm) from 2D ERI result at
depth 125 interpreted as groundwater potential zone
and it supported by drilling data. According the
drilling data, at 100 m of depth found fractured zone
of granite that has very high possibility as secondary
porosity to preserve groundwater resources.
5 CONCLUSION
2D Electrical Resistivity Imaging (ERI) Survey has
been successfully used in this study to locate and
delineate groundwater possibility potential at Kulim,
Kedah, Malaysia in conjunction with chargeability
data and drilling data. The drilling location was
determined by groundwater potential zone that shown
from 2D ERI result. The resistivity result show that
there are 3 layers or zone within study area. First
layer is top soil (clay) in dry condition represented
by moderate to high resistivity value ranging from
100 – 100 Ωm at near surface. Another layer
is extremely high resistivity value 300 Ωm up to
2000 Ωm thatindicate granite as bedrock of study
area. Groundwater potential zone shown by low
resistivity value ranging from 1 – 100 Ωm. Potential
zone of groundwater divided into 2 based on its
depth, shallow groundwater potential with depth 25
m to 75 m from the surface and deep groundwater
potential with depth more than 75 m. drilling data
was proven all the interpretation of 2D ERI where
the groundwater potential zone is fractured zone of
granite. Fractured zone become secondary porosity
that can be store groundwater.
Figure 8: Drilling data of PDL 6
ACKNOWLEDGMENTS
The authors would like to give an acknowledgment to
GWS Drilling Engineering Sdn. Bhd. members for
their cooperation in data collection that help authors
very much in field. The authors also thanks to Silterra
Malaysia SdnBhd for the great hospitality at field.
Groundwater Exploration using 2D Electrical Resistivity Imaging (ERI) at Kulim, Kedah, Malaysia
39

REFERENCES
Azhar, M., Suryadi, A., Samsudin, A. R., Yaacob, W.
Z. W., and Saidin, A. N. (2016). 2d geo-electrical
resistivity imaging (eri) of hydrocarbon contaminated
soil. EJGE (Electron. J. Geotech. Eng, 21:299–304.
Hamzah, U., Ismail, M. A., and Samsudin, A. R.
(2008). Geophysical techniques in the study of
hydrocarbon-contaminated soil.
Hamzah, U., Samsudin, A. R., and Malim, E. P.
(2007). Groundwater investigation in kuala selangor
using vertical electrical sounding (ves) surveys.
Environmental geology, 51(8):1349–1359.
Hutchison, C. S. (1989). Geological Evolution of South-east
Asia. Clarendon Press, Oxford.
Jumary, S. Z., Hamzah, U., and Samsudin, A. R. (2002).
Teknik-teknik geoelektrik dalam Pemetaan air masin
di Kuala ( Mapping of groundwater salinity at Kuala
Selangor by geoelectrical techniques ).
Kausarian, H., Batara, B., Putra, D. B. E., Suryadi,
A., and Lubis, M. Z. (2018). Geological
mapping and assessment for measurement the electric
grid transmission lines in west sumatera area,
indonesia. International Journal on Advanced
Science, Engineering and Information Technology,
8(3):856–862.
Kausarian, H., Sri Sumantyo, J., Karya, D., Bagus, D., and
Abdul Kadir, E. (2016). Geological mapping for the
land deformation using small uav, dinsar analysis and
field observation at the siak bridge i and ii, pekanbaru
city, indonesia.
Loke, M. H. and Barker, R. D. (1995). Least-square
deconvolution of apparent resistivity psuedosection.
Geophysics 60, 1682–1690.
Lubis, M., Anurogo, W., Kausarian, H., Choanji, T., Antoni,
S., and Pujiyati, S. (2018a). Discrete equispaced
unshaded line array method for target identification
using side scan sonar imagery. In IOP Conference
Series: Earth and Environmental Science, volume
176, page 012025. IOP Publishing.
Lubis, M. Z., Pujiyati, S. R., Pamungkas, D. S., Tauhid,
M., Anurogo, W., and Kausarian, H. (2018b).
Coral reefs recruitment in stone substrate on Gosong
Pramuka, Seribu Islands, Indonesia. Biodiversitas,
19(4):1451–1458.
N. Nwankwo, C. and O. Emujakporue, G. (2012).
Geophysical Method of Investigating Groundwater
and Sub-Soil Contamination – A Case Study.
American Journal of Environmental Engineering,
2(3):49–53.
Saad, R., Nawawi, M. N. M., and Mohamad, E. T.
(2012). Groundwater detection in alluvium using 2-D
electrical resistivity tomography (ERT). Electron. J.
Geotech. Eng, 17.
Suryadi, A. (2016). Fault analysis to Determine
Deformation History of Kubang Pasu Formation at
South of UniMAP Stadium Hill. Ulu Pauh,. JGEET
(Journal Geosci. Eng. Environ. Technol, 1.
Suryadi, A., Batara, A., and N., S. (2019). Electrical
resistivity imaging (ERI) and induced polarization
(IP) survey to solve water drought problem at alor
gajah. Melaka, Malaysia. IOP Conf. Ser. Mater. Sci.
Eng. 532, 532:012025.
Suryadi, A., Putra, D. B. E., Kausarian, H., Prayitno, B.,
and Fahlepi, R. (2018). Groundwater exploration
using Vertical Electrical Sounding (VES) Method at
Toro Jaya. Langgam, Riau. J. Geosci. Eng. Environ.
Technol. 3, 3(226.).
ICoSET 2019 - The Second International Conference on Science, Engineering and Technology
40
