
Testing the Role of Fish Consumption Intention as Mediator
Junaidi
1
, Desi Ilona
2
, Zaitul
3
, and Harfiandri Damanhuri
1
1
Faculty of Fisheries and Marine, Universitas Bung Hatta, Indonesia
2
Faculty of Economic, Universitas Putra Indonesia YPTK, Padang, Indonesia
3
Faculty of Economic, Universitas Bung Hatta, Indonesia
Keywords:
Theory Of Plan Behaviour, Consumption Behaviour.
Abstract:
This research investigate the role of an intention to consume fish as mediating variables between six variables
(three variables from theory of plan behaviour and others from (Tomic, Matulic, and Jelic 2016). Theory of
plan behaviour is applied to understand the phenomena’s. The data is analysed using the structural equation
model (SEM). The finding show that an intention to consume fish is succeeding in mediating relationship
between attitude toward fish consumption and consumption behaviour. However, the effect of other variables
(subjective norm, perceived behavioural control, healthy, availability and responsibility) on consumption
behaviour is not successfully mediated by an intention to consume fish. This study has theoretical and practical
implication and they are discussed in this paper.
1 BACKGROUND OF STUDY
Consumption of sea food has been varying
substantialyacross countries, family and individually
(Olsen 2004).In country level, European country
consume fish 20 kg per capita and 39 kg in
Indonesia (Tran et al. 2017). In addition, Olsen
(2003) identified the stream of research regarding
to the individual fish consumption behaviour:
socio-economics and demographic perspectives,
and psychologicalperspective. From psychological
perspective, food consumption behaviour and choice
is explained by psychological constructs, such as
social norm, belief, attitude, motivation, knowledge
and other psychological variables (Shepherd and
Raats 1996). Fish consumption has several reasons,
such as diet, nutrition, and etc.(Carlucci et al., 2015).
In fact, fresh fish consumption at least twice a week
have a positively effect on health (Sioen et al.,
2008). The research question regarding to the fish
consumption behaviour is why the fish consumption
behaviour varies.
There are several previous researches
investigating the fish consumption behaviour among
individual (Tomi
´
c et al., 2016; Badr et al., 2015;
Thorsdottir et al., 2012; Murray et al., 2017; Khan
et al., 2018; Birch and Lawley, 2012; Milo
ˇ
sevi
´
c et al.,
2012; Cardoso et al., 2013; Grieger et al., 2012).
From the previous studies, there is a lack of studies
investigating the fish consumption behaviour using
the Indonesia’s data. further, there is limited studies
determining the role of an intention to consume fish
as mediating variable between attitude, subjective
norm, perceived behavioural control (Ajzen, 1991)
and other variables are being tested by (Tomic,
Matulic, and Jelic 2016): healthy, availability and
responsibility. Therefore, this study investigates
the mediating role of an intention to consume fish
between six variables and consumption behaviour.
Therefore, we test six hypotheses:
H1: Intention to consume fish mediate the
relationship between attitude and fish
consumption behaviour
H2: Intention to consume fish mediate the
relationship between subjective norm and
fish consumption behaviour
H3: Intention to consume fish mediate the
relationship between perceived behaviour
control and fish consumption behaviour
H4: Intention to consume fish mediate the
relationship between healthy and fish
consumption behaviour
H5: Intention to consume fish mediate the
relationship between availability and fish
consumption behaviour
H6: Intention to consume fish mediate the
90
Junaidi, ., Ilona, D., Zaitul, . and Damanhuri, H.
Testing the Role of Fish Consumption Intention as Mediator.
DOI: 10.5220/0009120600900097
In Proceedings of the Second International Conference on Science, Engineering and Technology (ICoSET 2019), pages 90-97
ISBN: 978-989-758-463-3
Copyright
c
2020 by SCITEPRESS – Science and Technology Publications, Lda. All rights reserved

relationship between responsibility and fish
consumption behaviour
This paper is organised into four sessions. First
session is discussed about the research background.
Method and material is in second session. It is
followed finding and discussion as third session.
Finally, this paper is closed by conclusion and
recommendations.
2 METHOD AND MATERIAL
Academics staffs working in private university in
Padang is research object. There are 301 questioners
distributed to respondent, 18.27% of respondents
returned the questioner. Primary data is applied
by using survey method (on-line). There are
three type of latent variables used here: latent
dependent variable (fish consumption behaviour),
latent independent variables (attitude toward
fish consumption, availability, fish consumption
behaviour, healthy, perceived behavioural control,
responsibility, and subjective norm), and latent
mediating variable (intention to consume fish).
Fish consumption behaviour refers to how often
respondent consume fish the last few month (Tomic,
Matulic, and Jelic 2016). In addition, intention to
consume fish has two items adopted from (Ajzen
1991). Further, attitude toward fish consumption is
measured by five items where two items adopted
from (Tomic, Matulic, and Jelic 2016) and other three
items was taken from (Verbeke and Vackier 2005).
Thus, subjective norm has four items suggested by
(Verbeke and Vackier 2005). Moreover, perceived
behaviour control is measured by three items taken
from (Verbeke and Vackier 2005).
Healthy (involvement in health) has three items
taken from (Altintzoglou et al., 2011). Fish
availability is measured by three items from (Myrland
et al., 2000). Finally, three item is used to measure the
responsibility (moral obligation) taken from (Verbeke
and Vackier, 2005). All constructs are assessed
using the 5-point Likert scale (1=strongly disagree,
5=strongly agree). SEM-PLS is applied to analyse the
research data (Chin 1998; Vinzi et al. 2010). In this
case, smart-pls is used (Hair et al., ). Two assessment
is conducted to gain the confirmed measurement
model and rigorous structural model (J. Hair et al.
2014). In measurement model, we have to assess two
types of validity: convergent validity and discriminant
validity (J. F. Hair et al. 2013). Structural model is
aimed for test the relationship (Joseph F Hair et al.
2017). Mediation role is tested using (Zhao et al.,
2010)’s mechanism.
3 RESULT AND DISCUSSION
3.1 Demographic Data
Data demography is classified into four types:
gender, age, position and income. figure 1 show
respondentgender and age. Regarding to respondent
age, 49% of respondent is female and the rest is
male (51%). In addition, respondent with age of
26-30-year-old is about 5%. Thus, 20% of respondent
is with age of 36-40 years old. Further, respondent
with age of 36-40 years old is 5% and followed
by 35% of respondent with age of 41-50 years
old. Moreover, respondent with age more than 50
years old is 35%. On other two demographic data
Figure 1: Demographic data: gender and Age
is respondent career position and income. Figure
2 provide us with the percentage of position and
income of respondents. There are four type of lecture
position: lecturer (24%), senior lecturer (38%),
associate professor (31%) and professor(7%). In
addition, respondent with income of less than Rp. 3
million is 16% and followed by 33% respondent with
income of Rp. 3.1- Rp. 6 million. Thus, respondent
with Rp. 6.1 –Rp. 9 million of income is 35% and
finally 16% respondent is with income of more than
Rp. 6 million.
Testing the Role of Fish Consumption Intention as Mediator
91
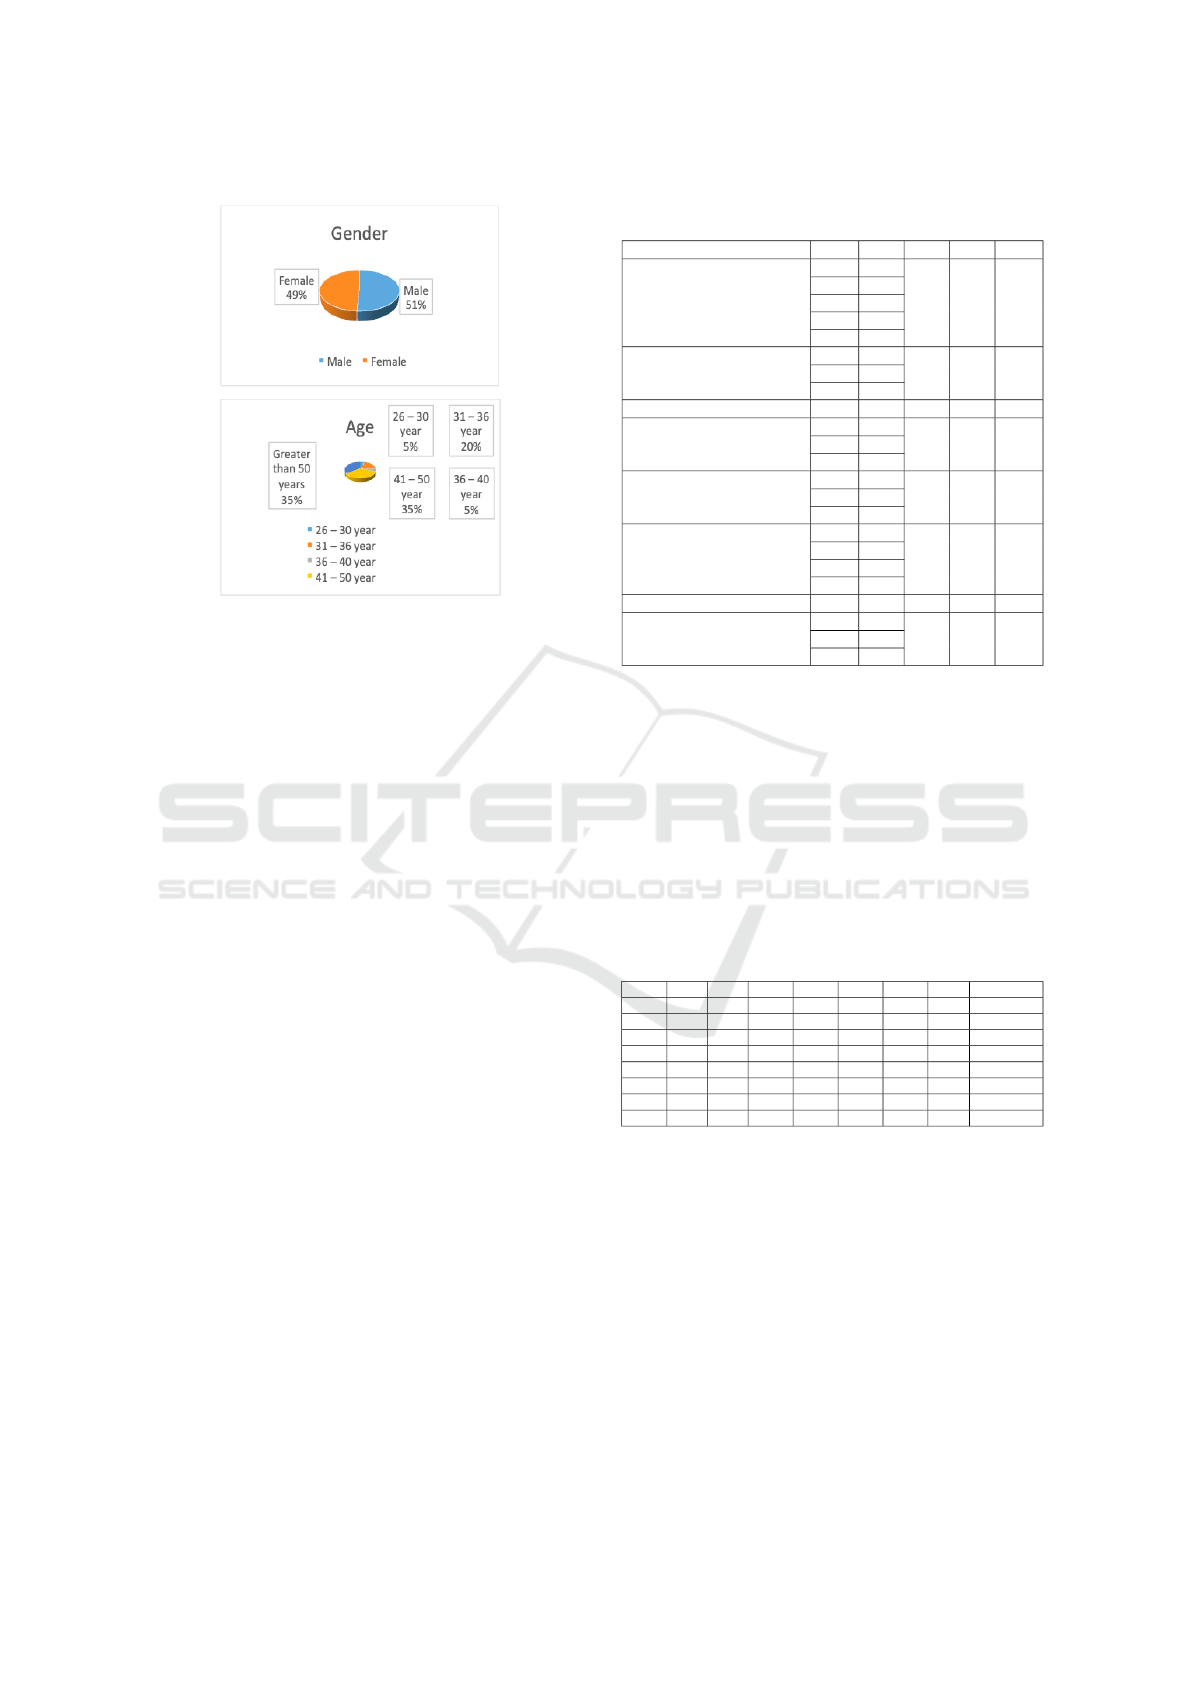
Figure 2: Demographic Data: Position And Income
3.2 Measurement Model Assessment
as mention in the previous session, there
are two assessments while using smart-pls:
measurement model assessment and structural
model assessment(Joseph F Hair et al. 2017).
Table 1 demonstrate the result of measurement
model assessment for convergent validity. There are
four smart-pls properties used here: outer loading,
Cronbach’s alpha, composite reliability and average
variance extracted (AVE). All items have an outer
loading greater than 0.700 for first algorism, except
for item of perceived behavioural control (pbc2, and
pbc3). Having deleted these two items, the second
algorism has been run and thereafter, all items have
an outer loading greater than 0.700. therefore, it
reached the convergentvalidity requirement (Hulland
1999). Second convergent validity assessment is
Cronbach’s Alpha (CA) and Composite reliability
(CR) and their value must exceed 0.700 (Bagozzi and
Yi, 1988). As indicated by value of CA and CR (5th
and 6th Colum), their values are above the smart-pls
requirement: above 0.70. Finally, average variance
extracted (AVE)’s value should be greater than 0.500.
the result show that all constructs have AVE’s value
above 0.500 and therefore, it can be concluded that it
achieves the cut off value.
Discriminant validity is the second assessment
for measurement model. There are three type of
assessment for discriminant validity: Fornell-Lacker
criterion (Fornell and Larcker, 1981), cross loading
(Jorg Henseler, Ringle, and Sinkovics 2009) and
Heterotrait-Monotrait ratio (J
¨
org Henseler, Ringle,
and Sarstedt 2015). Table 2 demonstrate the result of
Table 1: Measurement Model Assessment Convergent
validity
construct Item OL CA CR AVE
attitude toward fish
atf1 0.94
0.94 0.96 0.81
atf2 0.91
atf3 0.83
atf4 0.93
atf5 0.9
availability
ava1 0.87
0.89 0.91 0.79
ava2 0.81
ava3 0.96
fish con beh fcb 1 1 1 1
healthy
h1 0.88
0.79 0.87 0.7
h2 0.76
h3 0.87
intention to consume fish
icf1 0.99
0.98 0.99 0.97
icf2 0.98
icf3 0.98
subjective norm
nor1 0.9
0.86 0.9 0.71
nor2 0.73
nor3 0.9
nor4 0.81
perceived behaviour control pbc1 1 1 1 1
responsibility
res1 0.95
0.94 0.96 0.9
res2 0.97
res3 0.92
discriminant validity using Fornell-Lacker criterion.
Square root AVE of a construct should be higher
than the correlation between that construct with other
construct. For example, square root AVE of ICF
(0.984) is greater than its correlation with other
construct (0.517 with ATF, 0.032 with AVA and
etc). Therefore, it can be concluded that discriminant
validity requirement using Fornell-Lacker criterion is
achieved (Fornell and Larcker, 1981).
Table 2: Measurement Model Assessment Discriminant
validity-Fornel-Lacker Criterion
cons ICF ATF AVA FCB H PBC RES NOR
ICF 0.98
ATF 0.52 0.9
AVA 0.03 0.12 0.88
FCB 0.43 0.72 -0.07 1
H 0.25 0.63 0.09 0.38 0.84
PBC 0.17 0 0.31 -0.05 -0.17 1
RES 0.28 0.63 0.09 0.5 0.52 -0.05 0.95
NOR 0.23 0.57 0.21 0.41 0.54 -0.13 0.76 0.84
Note: ICF (intention to consume fish), ATF (attitude toward fish
consumption), AVA (avalaibality), (FCB) fish consumption behaviour, H
(healthy), PBC (perceived behavioural control), RES (responsibility), and
NOR (subejctive norm).
Second assesment for discriminant validity is
cross loading (Wong 2013). The result of
cross-loading can be seen in Table 3 below.The
cross-loading refers to loading an indicator should
be higher to its assigned construct (Jorg Henseler,
Ringle, and Sinkovics 2009). For example, items
for ICF construct is higher loading to ICF (bold)
compared to other construct (non-bold). It also
happens to other items. Therefore, the discriminant
validity using cross-loading is reached.
ICoSET 2019 - The Second International Conference on Science, Engineering and Technology
92

Table 3: Measurement Model Assessment Discriminant
validity-Cross Loading
Items ICF AVA FCB H ICF PBC RES NOR
atf1 0.94 0.08 0.72 0.61 0.54 -0.03 0.54 0.5
atf2 0.91 0.02 0.7 0.52 0.49 0 0.51 0.41
atf3 0.83 0.2 0.56 0.6 0.36 0.1 0.57 0.48
atf4 0.93 0.17 0.62 0.58 0.45 0.01 0.65 0.61
atf5 0.9 0.19 0.63 0.53 0.43 -0.05 0.59 0.57
ava1 0.1 0.87 0.01 0.16 0.02 0.2 0.11 0.21
ava2 0.17 0.82 -0.02 0.21 0.01 0.32 0.17 0.23
ava3 0.11 0.96 -0.1 0.03 0.04 0.33 0.06 0.19
fcb 0.72 -0.07 1 0.38 0.43 -0.05 0.5 0.41
h1 0.56 0.1 0.3 0.88 0.23 0.02 0.52 0.45
h2 0.41 -0.07 0.29 0.76 0.18 -0.3 0.24 0.4
h3 0.58 0.16 0.38 0.87 0.23 -0.17 0.51 0.5
icf1 0.52 0.03 0.41 0.29 0.99 0.14 0.29 0.24
icf2 0.49 0.02 0.42 0.22 0.98 0.19 0.27 0.21
icf3 0.51 0.04 0.44 0.24 0.98 0.17 0.27 0.23
nor1 0.53 0.21 0.34 0.48 0.21 -0.18 0.71 0.9
nor2 0.45 0.29 0.38 0.47 0.17 -0.04 0.55 0.73
nor3 0.51 0.13 0.4 0.38 0.18 -0.16 0.72 0.9
nor4 0.41 0.1 0.28 0.51 0.2 -0.04 0.56 0.81
pbc1 0 0.31 -0.05 -0.16 0.17 1 -0.05 -0.13
res1 0.59 0.03 0.46 0.5 0.27 -0.03 0.95 0.71
res2 0.62 0.08 0.51 0.53 0.32 -0.11 0.97 0.74
res3 0.58 0.16 0.45 0.45 0.19 0.04 0.92 0.71
Note: ICF (intention to consume fish), ATF (attitude toward fish
consumption), AVA (availability), (FCB) fish consumption behaviour, H
(healthy), PBC (perceived behavioural control), RES (responsibility), and
NOR (subjective norm).
Third assessment for discriminant
validity is Heterotrait-Monotrait ratio
(HTMT). The ratio is resulted from average
heterotrait-heteromethod correlations relative to the
average monotrait-heteromethod correlation (J
¨
org
Henseler, Ringle, and Sarstedt 2015; Joseph F Hair
et al. 2017). (Kline 2011) argue that HTMT ratio
below 0.85 indicate that discriminant validity is
achieved. Table 4 provide us with the result of
Heterotrait-Monotrait ratio and all values are below
0.85 and it can be concluded that discriminant
validity is achieved.
Table 4: Measurement Model Assessment Discriminant
validity- Heterotrait-Monotrait ratio (HTMT)
cons ICF ATF AVA FCB H PBC RES NOR
ATF
AVA 0.16
FCB 0.74 0.05
H 0.72 0.21 0.43
ICF 0.53 0.03 0.44 0.29
PBC 0.04 0.33 0.05 0.22 0.17
RES 0.67 0.14 0.52 0.58 0.28 0.06
NOR 0.64 0.27 0.45 0.65 0.25 0.13 0.84
Note: ICF (intention to consume fish), ATF (attitude toward fish
consumption), AVA (availability), (FCB) fish consumption behaviour, H
(healthy), PBC (perceived behavioural control), RES (responsibility), and
NOR (subjective norm).
3.3 Structural Model Assessment
Having assessed the measurement model, assessment
for structural model is conducted. Structural model
assessment is for hypothesis testing and deals with
relationship between latent variables(Joseph F Hair et
al. 2017). before testing for hypothesis, it first looks
for predictive relevant and predictive power of model.
Q square is used to see the predictive relevance of
model and its value should be higher than 0.000.
both endogenous constructs have Q square above
0.000. in fact, FCB and ICF have Q square 0.113 and
0.254 respectively. Therefore, they are classified as
medium predictive relevance (Jorg Henseler, Ringle,
and Sinkovics 2009). Second, R square is used to see
the predictive power of structural model. The value
of R square is 0.174 and 0.222 for FCB and ICF
respectively. Thus, predictive power is below 0.33
and it is categorised as weak predicative power (Chin
1998).
Table 5: Assessment of Structural Model
endogenous construct Q square decision R square decision
FCB 0.11 Medium 0.17 Weak
ICF 0.25 Medium 0.22 Weak
relationship Coef. t stat p value decision
ATF − > ICF 0.59 3.3 0.00*** supported
AVA − > ICF -0.09 0.52 0.6 not supported
H − > ICF -0.05 0.36 0.722 not supported
ICF − > FCB 0.43 3.44 0.00*** supported
PBC − > ICF 0.19 1.38 0.17 not supported
RES − > ICF -0.04 0.26 0.8 not supported
NOR − > ICF 0 0.01 0.99 not supported
Note: ICF (intention to consume fish), ATF (attitude toward fish
consumption), AVA (availability), (FCB) fish consumption behaviour, H
(healthy), PBC (perceived behavioural control), RES (responsibility), and
NOR (subjective norm).
the significant determinants of fish consumption
intention are attitude toward fish consumption
(β=0.587, p-value=0.001). other variables (AVA, H,
PBC, RES, and NOR) do not have a significant effect
on fish consumption intention due to their p value
above 0.05. In addition, fish consumption intention
has a significant relationship with fish consumption
behaviour (β=0.434, p-value=0.001). therefore, the
higher the fish consumption intention, the greater fish
consumption behaviour. Figure 4 show the structural
model.
To answer whether fish consumption intention
mediating relationship between determinants and fish
consumption behaviour, the assessment of direct
effect and indirect effect are conducted. Table 6
demonstrate the result of direct effect and out of six
determinants, only attitude toward fish consumption
has a significant relationship with fish consumption
behaviour (β=0.702, p-value=0.000). thus, it means
that the higher the attitude toward fish consumption,
the higher fish consumption behaviour. Other
variables do not have a significant effect due to their
p value above 0.05.
Next analysis is indirect effect assessment. There
are six indirect effect are assessed and only indirect
effect (ATF− >ICF− >FCB) has a positive effect
Testing the Role of Fish Consumption Intention as Mediator
93
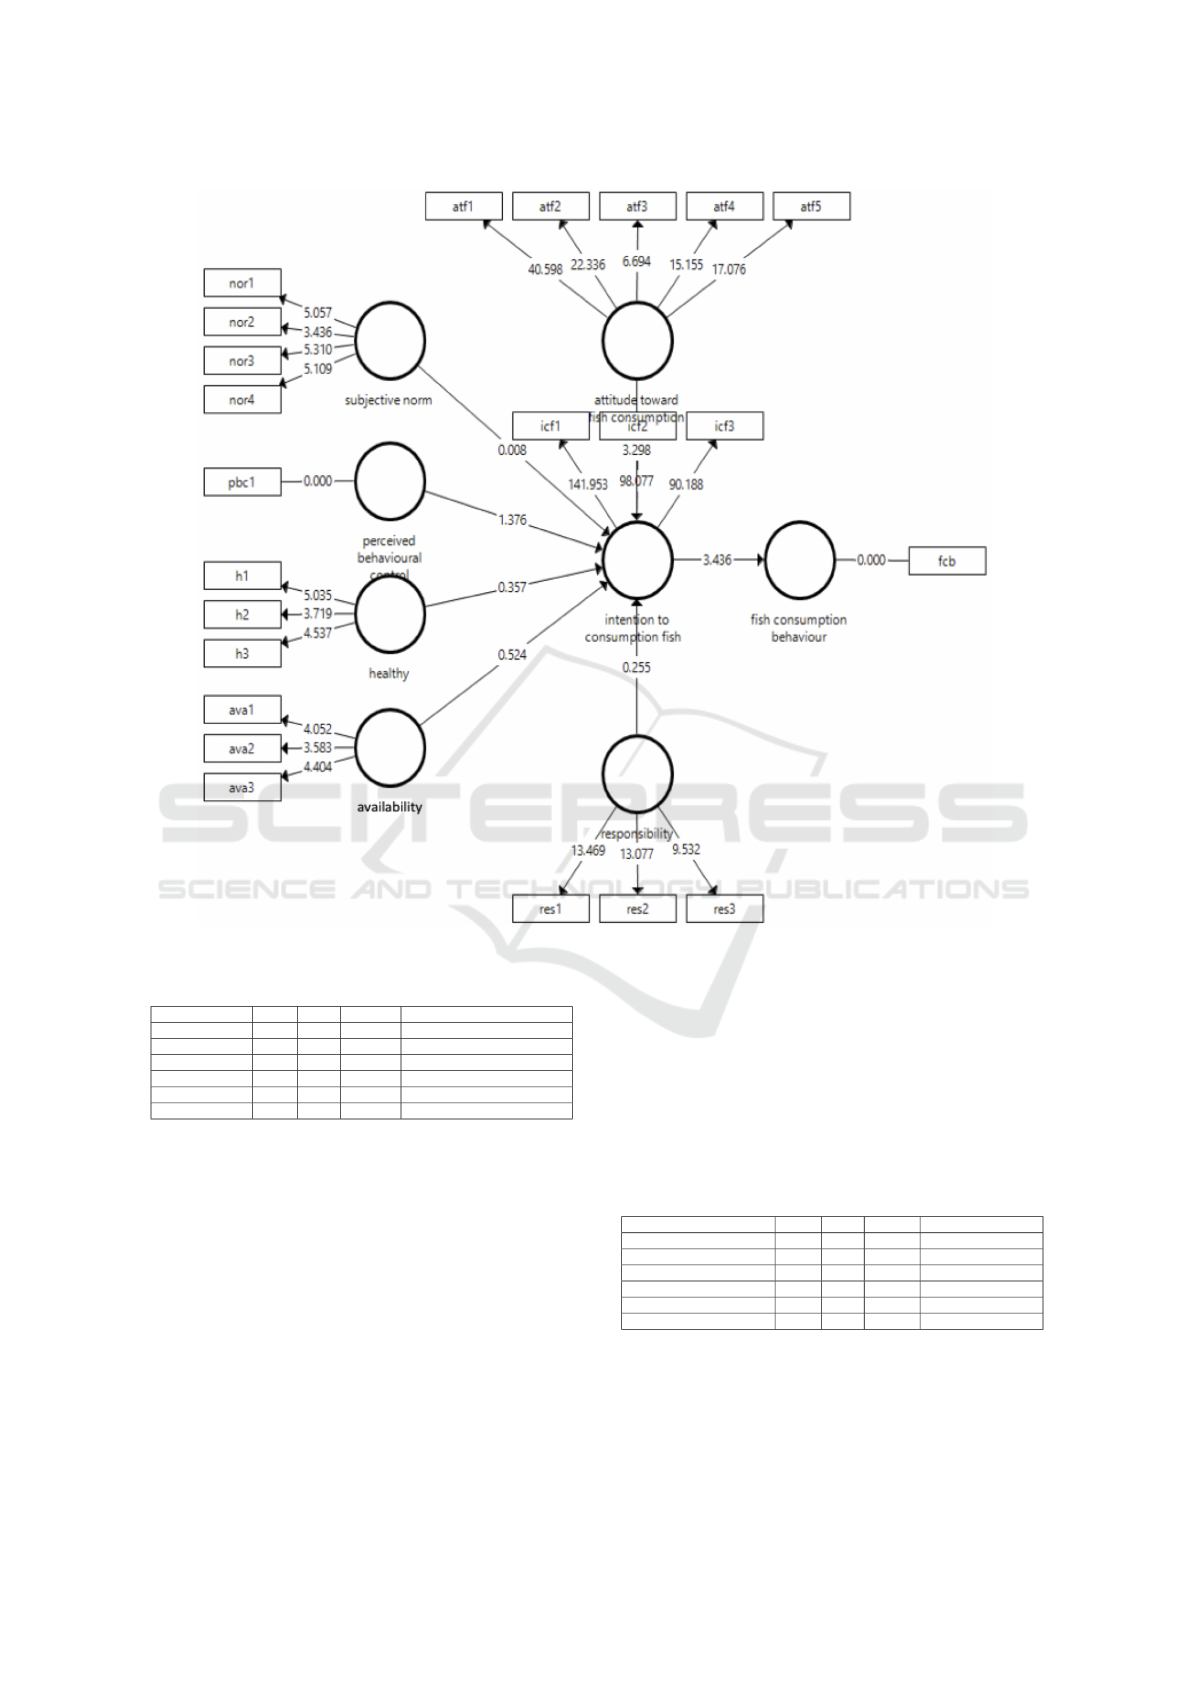
Figure 3: Structure Model
Table 6: Assessment of direct effect
direct effect coef. t stat p value decision
ATF − > FCB 0.7 3.63 0.00*** supported
AVA − > FCB -0.19 1.55 0.12 not supported
H − > FCB -0.13 0.93 0.36 not supported
PBC − > FCB -0.02 0.15 0.88 not supported
RES − > FCB 0.09 0.5 0.62 not supported
NOR − > FCB 0.04 0.26 0.8 not supported
Note: ICF (intention to consume fish), ATF (attitude toward fish
consumption), AVA (availability), (FCB) fish consumption behaviour, H
(healthy), PBC (perceived behavioural control), RES (responsibility), and
NOR (subjective norm).
(β=0.255, p-value=0.058) at α=10% (see table 7).
Other variables have p value above 0.05. (Zhao,
Lynch, and Chen 2010) argue that there should be
only one requirement to establish (i.e. indirect effect
(axb) is significant) and it does not need for significant
effect to be mediated (path c). However, if its
indirect effect and direct effect are significant and
they have same direction, the mediation is fallen into
complementary mediation(Zhao, Lynch, and Chen
2010). In this case, direct and indirect effect are
significant and they have the same direction (positive)
and we can conclude that there is a complementary
mediation role of fish consumption intention (ICF)
between attitude toward fish consumption (ATF) and
fish consumption behaviour (FCB). Figure 4 provide
us with complex structural model of research.
Table 7: Assessment of indirect effect
indirect effect Coef. t stat p value decision
ATF − > ICF − > FCB 0.26 1.9 0.06* supported
AVA − > ICF − > FCB -0.04 0.52 0.6 not supported
H − > ICF − > FCB -0.02 0.34 0.73 not supported
PBC − > ICF − > FCB 0.08 1.49 0.3 not supported
RES − > ICF − > FCB -0.02 0.24 0.81 not supported
NOR − > ICF − > FCB 0 0.01 0.99 not supported
Note: ICF (intention to consume fish), ATF (attitude toward fish
consumption), AVA (availability), (FCB) fish consumption behaviour, H
(healthy), PBC (perceived behavioural control), RES (responsibility), and
NOR (subjective norm).
ICoSET 2019 - The Second International Conference on Science, Engineering and Technology
94
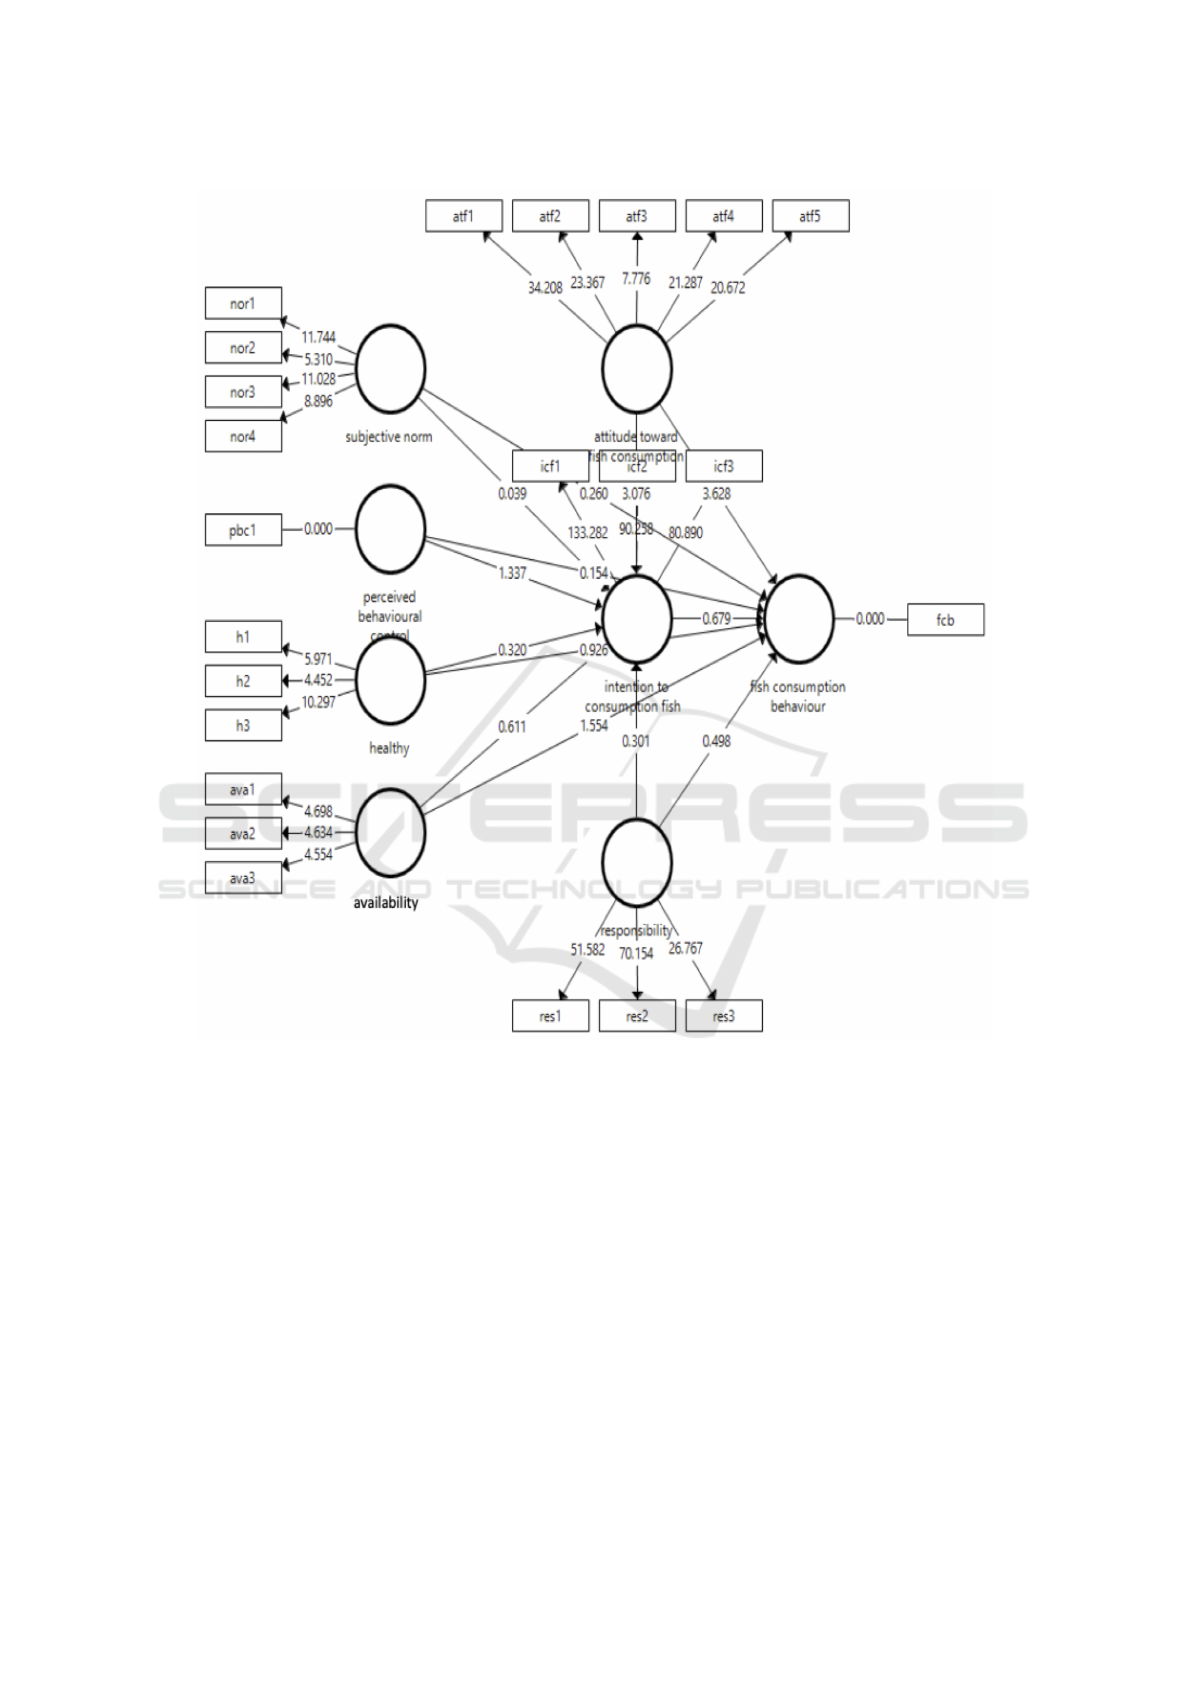
Figure 4: Structure Model
4 CONCLUSION AND
RECOMENDATION
The important of fish has been documented by several
experts. Due to benefit of fish, studies investigating
factor effected fish consumption behaviour has
been largely done. However, there is a limited
study investigating using Indonesia’s data. In
fact, there is also lack of studies determine the
role of an intention to consume as mediating
variables between antecendents of intention to
consume fish (attitude, norm, perceived behavioural
control, healthy, availability, and responsibility)
and consuming behaviour. The finding show
that intention to consume fish is succesfully
mediated the relationship between attitude toward fish
consumption and fish consumption behaviour.
5 CONCLUSIONS
Process integration has a fairly high risk and
can have an impact on objectives. Therefore, it
is necessary to mature planning and identify the
risks that may occur either during management
system process integration.The identified risks must
be managed by defining their causes and impacts.
Once known cause and impact, it can be proposed
Testing the Role of Fish Consumption Intention as Mediator
95

preventive measures to prevent occurrence and
corrective action in response if the impact occurs.
Based on this study, there are 10 highest risks in
management system process integration and 5 risks
occuring in scope component/clause.
ACKNOWLEDGMENTS
The authors would like to thank the financial support
provided by University of Indonesia University
through the PITTA 2019 funding scheme managed
by Directorate for Research and Public Services
(DRPM) University of Indonesia.
REFERENCES
Ajzen, I. (1991). The theory of planned behavior.
Organizational behavior and human decision
processes, 50(2):179–211.
Altintzoglou, T., Vanhonacker, F., Verbeke, W., and Luten,
J. (2011). Association of health involvement and
attitudes towards eating fish on farmed and wild
fish consumption in belgium, norway and spain.
Aquaculture International, 19(3):475–488.
Badr, L. M., Salwa, O., and Ahmed, Y. (2015). Perceived
barriers to consumption of freshwater fish in morocco.
British Food Journal, 117(1):274–285.
Bagozzi, R. P. and Yi, Y. (1988). On the evaluation of
structural equation models. Journal of the academy
of marketing science, 16(1):74–94.
Birch, D. and Lawley, M. (2012). Buying seafood:
Understanding barriers to purchase across
consumption segments. Food quality and preference,
26(1):12–21.
Cardoso, C., Lourenc¸o, H., Costa, S., Gonc¸alves, S.,
and Nunes, M. L. (2013). Survey into the
seafood consumption preferences and patterns in
the portuguese population. gender and regional
variability. Appetite, 64:20–31.
Carlucci, D., Nocella, G., De Devitiis, B., Viscecchia,
R., Bimbo, F., and Nardone, G. (2015). Consumer
purchasing behaviour towards fish and seafood
products. patterns and insights from a sample of
international studies. Appetite, 84:212–227.
Chin, W. W. et al. (1998). The partial least squares approach
to structural equation modeling. Modern methods for
business research, 295(2):295–336.
Esposito Vinzi, V., Chin, W. W., Henseler, J., and Wang, H.
(2010). Handbook of partial least squares: Concepts,
methods and applications. Heidelberg, Dordrecht,
London, New York: Springer.
Fornell, C. and Larcker, D. F. (1981). Structural equation
models with unobservable variables and measurement
error: Algebra and statistics.
Grieger, J. A., Miller, M., and Cobiac, L. (2012).
Knowledge and barriers relating to fish consumption
in older australians. Appetite, 59(2):456–463.
Hair, J. F., Hult, G. T. M., and Christian, M. Ringle. &
marko sarstedt. 2017. a primer on partial least squares
structural equation modeling (pls-sem).
Hair, J. F., Hult, G. T. M., Ringle, C. M., and Sarstedt, M.
(2013). A Primer on Partial Least Squares Structural
Equation Modeling (PLS-SEM). Thousand Oaks
Sage.
Hair, J. F., J., S., M., H., L., and Kuppelwieser, G.
(2014). V. Partial least squares structural equation
modeling (PLS-SEM) , European Business Review,
26(2):106–121.
Henseler, J., Ringle, C. M., and Sarstedt, M. (2015). A
new criterion for assessing discriminant validity in
variance-based structural equation modeling. Journal
of the academy of marketing science, 43(1):115–135.
Henseler, J., Ringle, C. M., and Sinkovics, R. R. (2009).
The use of partial least squares path modeling in
international marketing. In New challenges to
international marketing, pages 277–319. Emerald
Group Publishing Limited.
Hulland, J. (1999). Use of partial least squares (pls)
in strategic management research: A review of
four recent studies. Strategic management journal,
20(2):195–204.
Khan, A. Q., Aldosari, F., and Hussain, S. M. (2018).
Fish consumption behavior and fish farming attitude
in kingdom of saudi arabia (ksa). Journal of the Saudi
Society of Agricultural Sciences, 17(2):195–199.
Kline, R. B. (2005). Principles and practice of structural
equation modeling 2nd ed. New York: Guilford.
Meiselman, H. L. (1996). The contextual basis for
food acceptance, food choice and food intake: the
food, the situation and the individual. In Food
choice, acceptance and consumption, pages 239–263.
Springer.
Milo
ˇ
sevi
´
c, J.,
ˇ
Ze
ˇ
zelj, I., Gorton, M., and Barjolle, D.
(2012). Understanding the motives for food choice
in western balkan countries. Appetite, 58(1):205–214.
Moore, R. and Lopes, J. (1999). Paper templates.
In TEMPLATE’06, 1st International Conference on
Template Production. SCITEPRESS.
Murray, G., Wolff, K., and Patterson, M. (2017). Why eat
fish? factors influencing seafood consumer choices
in british columbia, canada. Ocean & Coastal
Management, 144:16–22.
Myrland, Ø., Trondsen, T., Johnston, R. S., and Lund,
E. (2000). Determinants of seafood consumption in
norway: lifestyle, revealed preferences, and barriers
to consumption. Food quality and Preference,
11(3):169–188.
Olsen, S. O. (2003). Understanding the relationship
between age and seafood consumption: the mediating
role of attitude, health involvement and convenience.
Food quality and Preference, 14(3):199–209.
ICoSET 2019 - The Second International Conference on Science, Engineering and Technology
96

Olsen, S. O. (2004). Antecedents of seafood consumption
behavior: An overview. Journal of aquatic food
product technology, 13(3):79–91.
Sioen, I., Van Camp, J., Verdonck, F., Verbeke, W.,
Vanhonacker, F., Willems, J., and De Henauw,
S. (2008). Probabilistic intake assessment of
multiple compounds as a tool to quantify the
nutritional-toxicological conflict related to seafood
consumption. Chemosphere, 71(6):1056–1066.
Smith, J. (1998). The Book. The publishing company,
London, 2nd edition.
Thorsdottir, F., Sveinsdottir, K., Jonsson, F. H., Einarsdottir,
G., Thorsdottir, I., and Martinsdottir, E. (2012). A
model of fish consumption among young consumers.
Journal of Consumer Marketing, 29(1):4–12.
Tomi
´
c, M., Matuli
´
c, D., and Jeli
´
c, M. (2016). What
determines fresh fish consumption in croatia?
Appetite, 106:13–22.
Tran, N., Rodriguez, U.-P., Chan, C. Y., Phillips, M. J.,
Mohan, C. V., Henriksson, P. J. G., Koeshendrajana,
S., Suri, S., and Hall, S. (2017). Indonesian
aquaculture futures: an analysis of fish supply and
demand in indonesia to 2030 and role of aquaculture
using the asiafish model. Marine Policy, 79:25–32.
Verbeke, W. and Vackier, I. (2005). Individual determinants
of fish consumption: application of the theory of
planned behaviour. Appetite, 44(1):67–82.
Wong, K. K.-K. (2013). Partial least squares structural
equation modeling (pls-sem) techniques using
smartpls. Marketing Bulletin, 24(1):1–32.
Zhao, X., Lynch Jr, J. G., and Chen, Q. (2010).
Reconsidering baron and kenny: Myths and truths
about mediation analysis. Journal of consumer
research, 37(2):197–206.
Testing the Role of Fish Consumption Intention as Mediator
97
