
Creative Comprehension on Literacy: Technology and Visual
Miranti Eka Putri
Faculty of Education, Universitas Islam Riau, Pekanbaru, Indonesia
Keywords:
Creative Comprehension, Technology Literacy, Visual Literacy
Abstract:
This study aims to examine the influence of literacy technology and visual literacy on students’ creative un-
derstanding in receiving extensive reading material. Mix method (sequential explanatory design) was used in
this study. Quantitative data is the result of a one-shot case study in the form of a reading test with treatment
mind mapping towards students’ creative comprehension. While qualitative data, case studies, use observation
instruments. Data processing is done by the Mann Whitney test and observation with the initial description
category, process, and end of learning. The Mann Whitney test results concluded that there were mean or
mean differences between the experimental group and the control group. Sig. 0.002 ¡0.05, then according to
the basis of decision making it was concluded that H
0
was rejected. Rejection of H
0
implies that there are sig-
nificant differences in student creative understanding in receiving extensive reading material using technology
literacy and visual literacy.
1 INTRODUCTION
Literacy is an important part of language learning.
Reading and writing skills are preferred aspects of
literacy, but literacy is not just two skills. Abilities
are related to cognitive, experience, cultural values,
and others. Lowe (1998) stated that literacy can be
media, networks, computers, traditional alphabet, li-
brary, culture, and vision. Beers (2009) concluded
that literacy is divided into five basic, libraries, visual,
media, and technology. So it can be concluded liter-
acy a combination of various aspects lead to activities
of thinking someone.
Critical understanding is an indispensable skill.
Ruland (2003) states that process readers measured
a universal intellectual standard including clarity, ac-
curacy, precision, accuracy, precision, relevance, rel-
evance, depth. Critical thinking activities can be im-
plemented various by critically examining aspects of
the text, context, and integrity of readers. Creative is
also very important. According to Taxonomy Barrett
divided into literal, reorganization, inferential, evalu-
ation, and appreciation. It explains the highest level of
creative thinking. Creative thinking activity requires
a critical thinking process. So it can be concluded that
creative thinking comes from success in thinking with
critical understanding. But critical thinking may not
necessarily reach understanding at the creative level
(Akın et al., 2015; Yousefi and Mohammadi, 2016;
Kamalova and Koletvinova, 2016).
Currently, the gap occurs a silting thought about
something against the younger generation. This hap-
pens because of a lack of interest. Facts show aca-
demically the majority have a high cumulative index.
It is contrary to the results of previous research that
the level of student understanding will illustrate his
academic achievement. Besides, a reader must have
the ability to understand lexical, literal, interpretative,
applied, effective, critical, and creative.
A reliable ability academic-non-academic matters
so that it can be beneficial for itself, family, and the
nation-state. Habit and ability are very important be-
cause reading is a bridge to know all knowledge. But
there still who not accustomed reading and do not
have an ability that should have been at a critical and
creative level. Where critical in question is that stu-
dents can formulate critically, critically understand,
apply critically, critically analyze, critically synthe-
size, and critically evaluate. While creative in ques-
tion is the student can understand the literal reading
and then interpret and give reactions in the form of
an assessment of what the author said, followed by
developing his thoughts to form ideas, insights, ap-
proaches, and new patterns of thought.
This research is very important to be implemented
because the young generation must have a reliable
reading ability to know all the science in academic
and non-academic. Especially change the mindset
324
Putri, M.
Creative Comprehension on Literacy: Technology and Visual.
DOI: 10.5220/0009144003240328
In Proceedings of the Second International Conference on Social, Economy, Education and Humanity (ICoSEEH 2019) - Sustainable Development in Developing Country for Facing Industrial
Revolution 4.0, pages 324-328
ISBN: 978-989-758-464-0
Copyright
c
2020 by SCITEPRESS – Science and Technology Publications, Lda. All rights reserved

of students so motivated to read and generate criti-
cal thoughts, and students’ creative thoughts. Based
on this research is very necessary to analyze aspects
of the problem in critical and creative students’ un-
derstanding. So the young generation though pattern
will lead to critical thinking. The study will analyze
(a) is there a statistical difference in students’ scores
for creative comprehension levels between groups?
(b) How are the students’ creative comprehensions on
technology literacy? (c) How are the students’ cre-
ative comprehensions on visual literacy?
2 LITERATURE REVIEW
2.1 Creative Comprehension
Creative reading is the level of reading comprehen-
sion at the highest level. Readers at this level should
think critically and should use their imagination. In
reading creatively, readers use the results of reading to
develop their intellectual and emotional abilities. That
ability will be able to enrich the knowledge, experi-
ence, and increase the sharpness of the power of rea-
soning so that the reader can generate new ideas. The
process of reading this creative according to (Syafi’ie,
1999) starts from the literal reading and then inter-
pret and give reactions in the form of an assessment
of what the author said, followed by developing his
own thoughts to form ideas, insights, approaches, and
patterns - new thought patterns.
2.2 Technology Literacy
Technology Literacy is the ability to use technology
to get information that needed. Variation in using
technology literacies are reading the website, using a
search engine, use map, access video, researching on
the internet, email, chatting, SMS, microblogging use
social sites, visiting cyberspace, blogging and using
a wiki, use message boards, newsgroups, and VOIP
(Skype).
2.3 Visual Literacy
Visual Literacy is a combination of development from
various perspectives and abilities. In perspective, vi-
sual literacy consists of theoretical, visual language,
and presentation. While on the principle of ability,
visual literacy is the basis of the development of oral
language; student interaction with objects, pictures,
body language; the basis of student interaction with
diversity of objects, images, body language; and the
involvement of students in learning by creating ob-
jects, images and gestures (Biemiller, 2003; Pardo,
2004). In grouping visual literacy is divided into vi-
sual thinking, visual learning, and visual communica-
tion (Pressley, 2001; Scharer et al., 2005). Further-
more, visual literacy has a component in the form of
visual perception, visual language, visual learning, vi-
sual thinking, and visual communication (Snow et al.,
2002; Williams, 2005).
2.3.1 Visual Mapping
Visual mapping is one of the objects and images
that meet visual literacy criteria. There are six types
of visual mapping, namely mind mapping, concept
mapping, arguments maps (development of places or
counter arguments and conclusions surrounding dis-
putes), thinking maps (the process of thinking of stu-
dents), general thinking system (looking for relation-
ships between variables), system dynamic (develop-
ing simulation models).
3 RESEARCH METHOD
This research used a mixed method Concurrent Tri-
angulation Design. One shot case study is used in
quantitative data to show the measurement strength
and scientific value of research design and qualitative
used case design. The participants were 80 students
of the second semester in English Language Educa-
tion, Faculty of Education, Universitas Islam Riau in
an extensive reading course T.A 2017/2018. Variable
X, technology literacy and visual literacy through ob-
servation to find out the teaching and learning process
in the class. Variable Y used the reading test to mea-
sure students’ creative comprehension.
4 FINDINGS
4.1 Quantitative Data
Table 1 shows the results of the Shapiro-Wilk and
Lilliefors Tests. The value of p-value (Sig) lilliefors
0.002 in the control group where ¡0.05 then based on
the lilliefors test, the data for each group were not nor-
mally distributed. The P value of the Shapiro-Wilk
test in the experimental group was 0,000 <0,05 and
in the control group 0,000 ¡0,05, both groups were not
normally distributed based on the Shapiro-Wilk test,
so the non-parametric test (Mann Whitney Test) was
used.
Creative Comprehension on Literacy: Technology and Visual
325
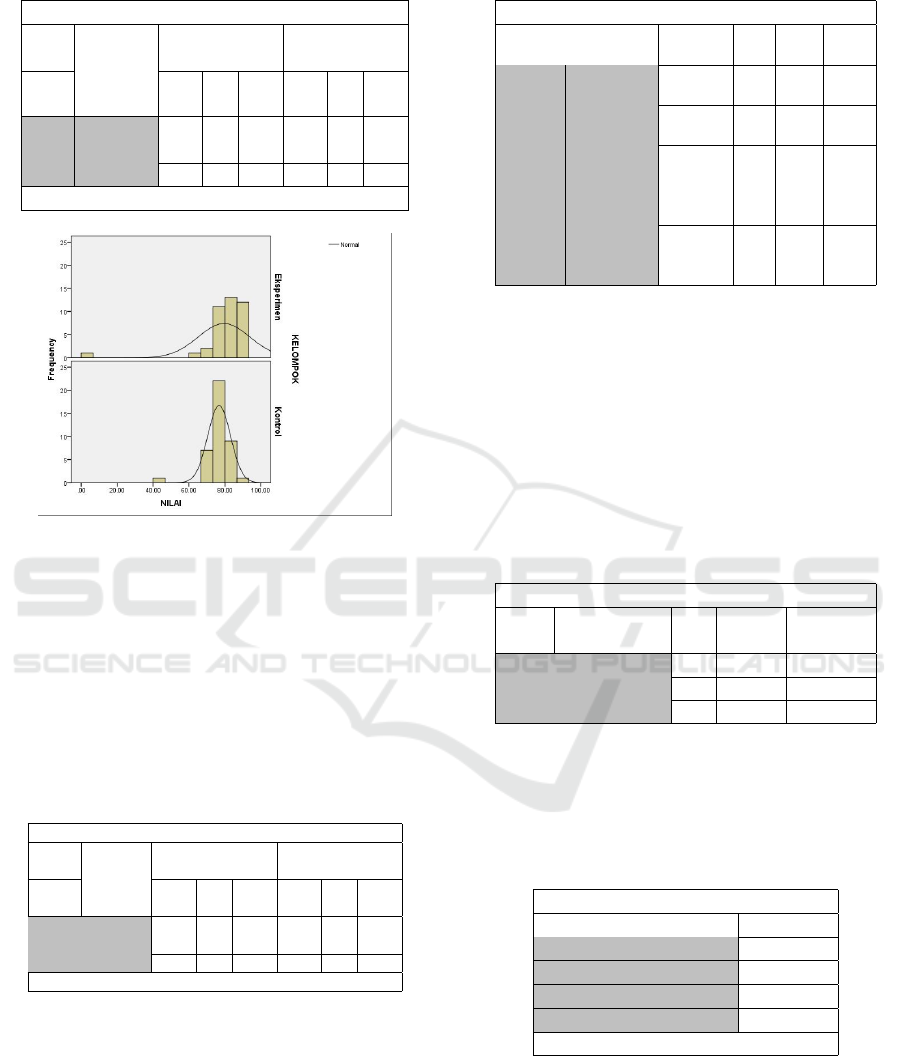
Table 1: Normality Test of Shapiro-Wilk and Lilliefors
Test of Normality
Kolmogorov-
Smirnov
Shapiro-Wilk
Groups
Stati-
stic
df Sig.
Stati-
stic
df Sig.
Experi-
ment
.248 40 .000 .538 40 .000
Value
Control .180 40 .002 .730 40 .000
a. Lilliefors Significance Correction
Figure 1: Data Dissemination.
Figure 1 shows that the slope and width are not
the same. This shows that the form and distribution of
data are not the same. Then look at the second highest
peak of the histogram, it turns out it’s not the same
as the two, which means there are media differences.
Then the first assumption of the Mann Whitney test is
not fulfilled, ie there is no similarity in the form and
distribution of data. The next assumption that will be
tested is the homogeneity of variance.
Table 2: Mann Whitney Normality Test
Test of Normality
Kolmogorov-
Smirnov
Shapiro-Wilk
Groups
Stati-
stic
df Sig.
Stati-
stic
df Sig.
Experi-
ment
.248 40 .000 .538 40 .000
Value
Control .180 40 .002 .730 40 .000
a. Lilliefors Significance Correction
Table 2 is the result of the normality test using
Liliefors and Shapiro Wilk. The second Sig (p-value)
value is above ¡0.05, which means that the data is not
normally distributed. This is true because if the data
are normally distributed, it will use an independent
t-test from the Mann Whitney U Test.
Table 3 shows the results of the homogeneity test
using Leven’s test method. Levene test is more rec-
ommended because the test can be used to test the
Table 3: Mann Whitney Homogeneity Test
Test of Homogeneity of Variance
Lavene
Statistic
df1 df2 Sig.
Based
on Mean
2.996 1 78 .087
Based
on Median
2.365 1 78 .128
Based
on Median
and with
adjusted df
2.365 1
51.3
74
.130
Value
Based on
trimmed
mean
2.410 1 78 .125
homogeneity of variance in data that is not normally
distributed. While other tests, namely the Fisher F test
are preferred if the data are normally distributed. The
Levene’s Test test value is shown in the Value-based
On Mean, i.e. with Sig (p-value) 0.087, 0.05 which
means the variance of the two groups is the same or
is called homogeneous. Then the second assumption
that is homogeneity has been fulfilled. Then testing
the Mann Whitney U Test hypothesis.
Table 4: Mann Whitney Test
Ranks
Groups N
Mean
Rank
Sum of
Ranks
40 48.55 1942.00
Experiment 40 32.45 1298.00Value
Control 80
Table 4 shows the Mean Rank or average ranking
of each group, that is, in the experimental group the
average rating is 48.55 higher than the mean of the
control group, which is 32.45.
Table 5: P-Value of the Mann Whitney Test
Test Statistics
Value
Mann-Whitney U 478.000
Wilcoxon W 1298.000
Z -3.099
Asymp. Sig. (2-tailed) .002
a. Grouping Variable: Groups
Table 5 shows a U value of 478 and a W value
of 1298. If converted to k, the value of Z is -3.099.
Sig or P-Value is 0.002 <0.05. If the value of the p-
value ¡ critical limit is 0.05 then there are significant
differences between the two groups or which means
H1 is accepted.
ICoSEEH 2019 - The Second International Conference on Social, Economy, Education, and Humanity
326

4.2 Qualitative Data
Initial Learning Conditions
The first meeting of the Researcher described
the extensive reading course in accordance with the
learning contract and RPS that had been prepared
by the study program team. In the second meeting,
researchers asked students to look for narrative
textbooks using literacy technology in the form of
Fables, Legend, Fairytales, Myth, Folktale, Romance,
Personal Experience, Horror, Science Fiction, Ad-
ventures, Historical, Slice of Live, Mysteries. The
characteristics of the student’s reading book must
have more than 300 pages per book. The atmosphere
of learning in the classroom is noisy and panic
because they have to look for the book and deposit
the title of the book along with the total number of
pages to be read. Every student is not allowed to have
the same list of titles. If students choose more than
one textbook, then the student will get more values
on the reading log record that has been provided.
The intended reading log is a format that students use
to record reading activities faithfully the day which
includes the day, date, time, title of the book, page,
and content. Students must be able to complete the
reading with the speed of each page of the book in
less than 1 minute. So if a student chooses a book
with 500 pages and reads at a speed of 1 minute/page,
then they have to finish it in 500 minutes meaning
8.33 hours. If the initial stage of the student can only
read comprehensively with 3 minutes per page for
500 pages/book, it will take 1500 minutes with an
estimated time of 25 hours to read. This must be
overcome to achieve the target and expected results,
which is 1 page ≤ 1 minute (60 seconds). Students’
self-confidence in the reading process will become a
problem when practicing. So that researchers must
motivate students by proving the practice of speed
reading in the classroom together.
Condition of the Learning Process
In the second meeting of the learning process,
each student showed the reading material agreed
upon at the first meeting. The researcher called
one by one the names of the students and checked
the material they had been looking for before. The
reading material may be more than one book in
the form of the e-book (technology literacy). After
checking the reading material, the researcher taught
the students how to reach the target of reading 1 page
≤ 1 minute (60 seconds). The researcher carried out
the verification step according to the procedure. In 3x
repetitions, students can master 1 page reading ≤ 1
minute (60 seconds). To measure their understanding,
the researcher asked directly in accordance with the
reading text that has been practiced with a limited
time to be answered one by one. The situation in the
classroom was suddenly quiet when the researcher
and students practiced speed reading until asking
questions. Until finally the Researchers proved that
they could read 1 page ≤ 1 minute (60 seconds)
by calculating the questions they had answered one
by one. After it was proven that they could read 1
page ≤ 1 minute (60 seconds), the class suddenly
became sad because new students realized that they
had reliable competence. The practice of reading
speed continues to be applied to 30 seconds per
page. The classroom atmosphere was more melting
than before. Next, they wrote down the reading
schedule in the reading log and prepare themselves
to recall orally and non-oral about the reading they
have read and answered all the questions asked
by the Researcher and other students for the third,
fourth and fifth meetings. At the third, fourth and
fifth meeting, one by one the students presented the
results of their reading comprehension in the form
of visual literacy and mind mapping. The researcher
called the names of students one by one at random
for presentations in front of the class. Before starting
the presentation, the class selects the timekeeper to
remind the presentation time limit. Each session, the
researchers called seven presenters with a mechanism
for the presentation time of around 5-7 minutes
per student. There were several provisions when
presenting, including presenters must pay attention to
visual literacy, mind mapping, presentation time, and
content.
The Final Condition of Learning
At the end of the learning process, the fifth meet-
ing, the researchers found that the students’ pre-
sentation of the reading was very satisfying. This
was evidenced by the readiness of students to an-
swer questions from researchers and audiences di-
rectly and spontaneously (without reading the text-
book/summary). In this case, the selection and use of
words and sentences when the presentation was still
lacking. So that from the results of the observation it
could be concluded that the understanding of the stu-
dents has met creative comprehension. The researcher
also found that the successes of these students were
based on the motivation of the situation which seemed
to force students to read. So that it affects the habits
of students to read every day with the speed of reading
that was once practiced in class.
Creative Comprehension on Literacy: Technology and Visual
327

5 CONCLUSIONS
The basis of decision making in the Mann Whitney
Test in this study is if the value of Asymp. Sig.
(2-tailed) <0.05, there is a significant difference. If
the value of Asymp Sig. (2-tailed)> 0.05, there is
no significant difference. With the hypothesis pro-
posed (H0) in the form of no differences in creative
understanding of students in receiving extensive read-
ing material T.A 2017/2018 by using literacy technol-
ogy, visual literacy, and mind mapping. So it can be
concluded that based on data from and distribution,
the two groups are not the same, then the results of
the Mann Whitney test concluded that there were dif-
ferences in a mean or mean between the two exper-
imental groups and the control group. Furthermore,
from Table 4.6 it is known Asymp. Sig. amounting
to 0.002, because of the value of Asymp Sig. 0.002
¡0.05, then according to the basis of decision making
in the Mann Whitney Test it can be concluded that
H0 is rejected. Rejection of H0 implies that there are
significant differences in student creative comprehen-
sion in receiving extensive reading material for T.A
2017/2018 using literacy technology, visual literacy,
and mind mapping. So, literacy technology and vi-
sual literacy are important to build the students” cre-
ative comprehension in reading.
REFERENCES
Akın, F., Koray,
¨
O., and Tavukc¸u, K. (2015). How effec-
tive is critical reading in the understanding of scien-
tific texts? Procedia-social and behavioral sciences,
174:2444–2451.
Biemiller, A. (2003). Vocabulary: Needed if more children
are to read well. Reading psychology, 24(3-4):323–
335.
Kamalova, L. A. and Koletvinova, N. D. (2016). The prob-
lem of reading and reading culture improvement of
students-bachelors of elementary education in modern
high institution. International Journal of Environmen-
tal and Science Education, 11(4):473–484.
Pardo, L. S. (2004). What every teacher needs to
know about comprehension. The reading teacher,
58(3):272–280.
Pressley, M. (2001). Comprehension instruction: What
makes sense now, what might make sense soon. Read-
ing online, 5(2):1–14.
Scharer, P. L., Pinnell, G. S., Lyons, C., and Fountas, I.
(2005). Becoming an engaged reader. Educational
Leadership, 63(2).
Snow, C., Sweet, A., Alvermann, D., Kamil, M., and Stri-
cland, D. (2002). Formulating a research agenda about
reading for understanding. In Comprehensive Reading
Instruction Across the Grade Levels. A collection of
papers from the Reading Research 2001 Conference,
pages 88–110.
Syafi’ie, I. (1999). Pembelajaran membaca di kelas-kelas
awal sd, pidato pengukuhan guru besar dalam bidang
ilmu pengajaran bahasa dan seni. Disampaikan pada
Sidang Terbuka Senat Universitas Negeri Malang
pada, 7.
Williams, J. N. (2005). Learning without awareness. Stud-
ies in Second Language Acquisition, 27(2):269–304.
Yousefi, S. and Mohammadi, M. (2016). Critical thinking
and reading comprehension among postgraduate stu-
dents: The case of gender and language proficiency
level. Journal of Language Teaching and Research,
7(4):802–807.
ICoSEEH 2019 - The Second International Conference on Social, Economy, Education, and Humanity
328
