
A Novel Correlation on MMP Prediction in CO2-LPG Injection System:
A Case Study of Field X in Indonesia
Prasandi Abdul Aziz, Hendra Dwimax, Tutuka Ariadji, Steven Chandra, Wijoyo Niti Daton, Ressi
Bonti
Petroleum Engineering Program, Institut Teknologi Bandung, Bandung, Indonesia
Keywords:
Minimum Miscibility Pressure, Slimtube Experiment.
Abstract:
In order to increase Indonesia’s petroleum production, which mostly comes from the marginal field, an En-
hanced Oil Recovery (EOR) method is needed. One EOR method that is proven to be able to increase large oil
yield is mixed CO2 injection. In implementing EOR CO2 injection mixed, the Minimum Reliability Pressure
(MMP) value is the key to success. One of the problems faced by oil fields in Indonesia in carrying out EOR of
mixed CO2 injection is that the reservoir pressure has dropped due to old age making it difficult to inject with
MMP pressure above the reservoir pressure. The solution that can be done to overcome this is by reducing the
MMP value using Liquified Petroleum Gas (LPG).This study will determine the optimal method of LPG use
to reduce CO2 injection MMP values from Field X fluid in South Sumatra. Then, the MMP value in various
conditions will be determined using a slimtube simulation which will be used to make a correlation to deter-
mine the MMP value. From the results of the study, in principle mixing LPG with CO2 will reduce the MMP
value optimally. In addition, the average MMP value dropped by 29.5% with an increase in the composition
of LPG in the gas mixture of CO2 - LPG injection by 30%, the MMP value increased by 23% with a change
in hexane plus molecular weight of 27.5% higher than before, and the MMP value increased by an average of
13.4% with an increase in temperature of 20%.The resulting correlation is formed using parameters that have
a significant influence on the determination of the MMP value. The resulting correlation has R-Squared of
98.65%. The correlation is then tested with MMP values previously determined through a slimtube simulation
and produces an Average Absolute Relative Error (AARE) value of 4.52%. Correlation was then re-tested
against the correlations of other MMP determinations using 9 fluid MMP data from other literature. The result
is the proposed correlation produces an AARE value of 10.82%.
1 INTRODUCTION
Production of crude oil and condensate in Indonesia
is 803,000 barrels per day in 2017 (Statistics of the
Ministry of Energy and Mineral Resources). Mean-
while, Indonesia’s national oil consumption currently
reaches 1.6 million barrels per day and continues to
increase (Statistical Review of World Energy 2017
BP). This means that crude oil production in Indone-
sia is smaller than consumption of petroleum as an en-
ergy source. In addition, Indonesia’s petroleum pro-
duction has experienced a downward trend of 1.35%
every year since 2012 (Statistics of the Ministry of
Energy and Mineral Resources). Indonesia needs to
make breakthroughs in order to increase its petroleum
production.
One such breakthrough is Enhanced Oil Recov-
ery (EOR). The breakthrough is a step to increase oil
acquisition if a field has gone through the primary re-
covery stage, which is the stage where the reservoir
fluid can flow by itself; and the secondary recovery
stage, which is the stage where the field is injected
with gas or water to maintain pressure in the reservoir
so that it does not drop dramatically (Lake, 1989).
EOR is the third step or tertiary recovery.
One type of EOR method that is quite well known
is CO2 injection. CO2 injection is still rarely used in
fields in Indonesia. There are 2 mechanisms for CO2
injection, namely: miscible injection (mixed injec-
tion) and immiscible injection (injection not mixed).
From the literature study conducted, it is known that
miscible injection produces oil that is greater than im-
miscible injection. This also underlies the research
focus on the miscible CO2 injection mechanism.
In performing miscible CO2 injection, the Mini-
mum Miscibility Pressure (MMP) value is very im-
Aziz, P., Dwimax, H., Ariadji, T., Chandra, S., Daton, W. and Bonti, R.
A Novel Correlation on MMP Prediction in CO2-LPG Injection System: A Case Study of Field X in Indonesia.
DOI: 10.5220/0009359802850290
In Proceedings of the Second International Conference on Science, Engineering and Technology (ICoSET 2019), pages 285-290
ISBN: 978-989-758-463-3
Copyright
c
2020 by SCITEPRESS – Science and Technology Publications, Lda. All rights reserved
285

portant to know. MMP is the minimum pressure so
that the reservoir fluid and injection fluid can mix.
Unfortunately, the value for miscible CO2 injection is
quite high considering the reservoir pressure has dras-
tically reduced because of the primary and secondary
production stages. As a result, the injected CO2 can-
not mix with the oil in the reservoir and the miscible
CO2 injection mechanism can be considered a failure.
There are two methods for this problem, namely:
• Injecting another gas into the reservoir so that the
intermediate component (C2-C6) of hydrocarbons
in the reservoir increases before injecting CO2, or
• Mixing the other gases with CO2 gas on the sur-
face then inject the mixed gas into the reservoir.
Both of these methods are carried out so that the
MMP value of the reservoir fluid against CO2 can
decrease and the fluid can mix at the current reser-
voir pressure.
The mixed gas is generally a hydrocarbon intermedi-
ate component such as propane and butane. It was
also known that the biggest decrease in MMP was in
mixing between CO2 and butane with a ratio of 40:60
(Muslim dan Permadi, 2016; Permadi, 2014; Rom-
merskirchen and Nijssen, 2016). In this study, the gas
used as a mixture of CO2 to be injected is LPG, as-
suming the main constituent is propane.
Field X in South Sumatra is one field that has been
operating since 1987. The field includes the old field
category (brownfield). The Feasibility Study (FS)
conducted by the Bandung Institute of Technology
(ITB) team on Field X showed that the EOR method
that was right for the field was CO2-EC miscible so
that the value of MMP was needed. Fluid data from
Field X was obtained from reservoir and fluid descrip-
tion data in the Final Report of Feasibility of Field X
in 2009. This study will try to determine CO2 in-
jection MMP from Field X fluid in various conditions
using a mixture of LPG on gas injection. The ultimate
goal of this study is to form a correlation that can be
used to determine the value of MMP injection of pure
CO2 or CO2 - LPG on Field X and compare it with
other correlations that have been formed.
2 ANALYSIS ON MINIMUM
MISCIBILITY PRESSURE
Minimum Miscibility Pressure (MMP) is the low-
est pressure for a gas to be mixed through a multi-
contact process with reservoir oil at reservoir tem-
perature (Elsharkawy, ). MMP can actually be di-
vided into two, namely multiple contact miscibility
pressure (MCMP) and first-contact miscibility pres-
sure (FCMP). The MCMP value must be below the
FCMP value (Holm, 1987; Martin and Taber, 1992).
However, as explained earlier, MMP in this study uses
MCMP as the definition of MMP. This is because mis-
cibility for EOR can be achieved at pressures below
FCMP and above MCMP (Zhang et al., 2004). There
are several definitions of MMP CO2 injection mathe-
matically, namely:
• Pressure when oil is equal to or very close to the
maximum final gain when 1.2 pore volume (PV)
is injected (Yellig et al., 1980).
• Pressure which causes oil acquisition as much as
80% in CO2 breakthrough and oil yield of 94%
at gas to oil ratio of 40000 SCF / stb (Holm and
Josendal, 1974).
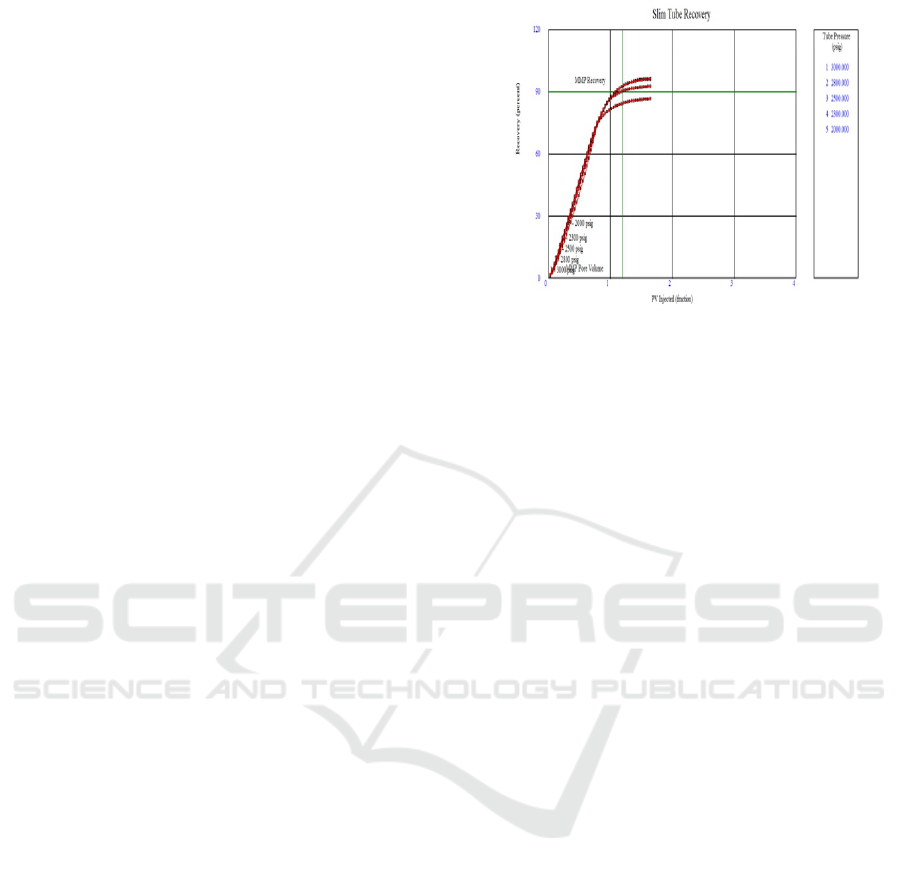
• Pressure that causes oil recovery of 90% or more
at CO2 injection of 1.2 PV (Glaso, 1985).
In this study, Glaso’s definition was used to determine
MMP using a slimtube simulation. Some parameters
that affect the MMP value are as follows.
• Reservoir temperature. An increase in reservoir
temperature will increase the MMP value.
• Oil composition. The higher the composition of
the intermediate component C2 - C6 and the lower
the composition of the heavy component of oil,
the lower the MMP value.
• Gas injection composition. The higher the com-
position of the intermediate component C2 - C6
gas injection, the lower the MMP value. (Zhang
et al., 2015).
These parameters will be used as the main param-
eter to perform sensitivity and correlation formation.
MMP Correlation and LPG Injection. There are
several determinants of the MMP value of injection
of pure CO2 that has been previously formed. The
correlation used as a comparison in this study is the
correlation of Cronquist, Lee, Yelling-Metcalfe, Orr-
Jensen, Alston, Emera-Sarma, Yuan, Shokir, Chen,
Ju, and Hao Zhang (Ju et al., 2012; Al-Hinai et al.,
2014; Bayagub, 2017; Bon and Sarma, 2005).
Gas injection of Liquified Petroleum Gas (LPG)
has a lower MMP value than the MMP value for CO2.
The use of LPG in EOR is relatively more benefi-
cial than the use of other light hydrocarbons (Ortega,
2017). According to a study conducted by Holm,
CO2 injection can have oil yield of up to 75% while
by using LPG, oil yield can reach 95%.
LPG injection will help develop oil volume, re-
duce oil density, and reduce oil viscosity. In addition,
LPG moves residual oil that is spread in the reservoir
ICoSET 2019 - The Second International Conference on Science, Engineering and Technology
286
(Bayat, 2015). Even so, LPG costs have an expen-
sive price. With these conditions, it is necessary to
mix CO2 with LPG so that the obtained oil is higher
and the price is economical (Kumar and Von Gonten,
1973). The LPG used in this study was propane
(C3H8).
Slim Tube Injection Process. Slimtube simulation
in IPM - PVTP vers software. 9.5 is used to determine
the MMP value in various field conditions of X. The
simulation of the slimtube is used because the use of
the slimtube in the laboratory will take a very long
time and the costs are not cheap. Slimtube modeled
in this simulation has 10 cells, where each cell has a
size of 2.3727 ft in the x-direction, 0.0113686 ft in the
y-direction, and 0.0113686 ft in the z-direction. The
porosity used for the slimtube model is taken from the
average porosity of Field X, which is 0.16275. The
permeability of the slimtube model is also taken from
the average permeability of Field X, which is equal
to 63.5 mD. The Field X reservoir depth becomes the
slimtube depth input data, which is 6490 ft. To de-
termine the MMP value, the Slimtube simulation re-
quires a definition for the MMP value. As mentioned
in the previous chapter, the MMP value is the pressure
at which 90% or more oil has been obtained when in-
jecting a gas of 1.2 pore volume into the slimtube.
The results of the slimtube simulation to determine
MMP under certain conditions will be displayed in
the graph of recovery vs pore volume. An example
of the MMP determination can be seen in Figure 1.
Before determining the MMP value in various con-
ditions, it is necessary to validate whether the fluid
model to be simulated on the Slimtube in the PVTP
software has the same MMP value as the fluid MMP
when tested with a slimtube in the laboratory. The
field X MMP oil value on the slimtube test from the
laboratory test was 2820 psi. In the slimtube simula-
tion for this validation, the CO2 injection MMP value
was 2870 psi. An error of 50 psi or 1.77% is con-
sidered to be tolerable and the determination of MMP
using a slimtube simulation and the fluid model in this
PVTP can be started.
To do a slimtube simulation, gas injection is
needed. In this study, there are 2 methods to be tested,
namely injection of LPG first into the reservoir fluid
and then injecting CO2 and injection of a mixture of
CO2 and LPG into the reservoir fluid.
For the first method, the reservoir fluid will be in-
jected with LPG by comparison as follows.
• 95% reservoir fluid and 5% LPG
• 90% reservoir fluid and 10% LPG
• 80% reservoir fluid and 20% LPG
Figure 1: Example of Slimtube Simulation.
• 70% reservoir fluid and 30% LPG
Next, the value of MMP is determined by the second
method. The injection gas used is as follows.
• 100% CO2
• 70% CO2 and 30% LPG
• 60% CO2 and 40% LPG
• 50% CO2 and 50% LPG
Both methods were tested with the same weight
temperature and molecular weight components,
namely 263,525 oF and 196,073 gr / mol. Further-
more, one method will be selected for further study
by conducting sensitivity to temperature, weight of
molecular weight components, and LPG composi-
tion. These parameters are selected based on literature
studies that have been done before. The sensitivity for
each parameter is as follows.
• Temperature (250, 263,525 and 300 oF)
• MW C6 + (196,073, 225 and 250 gr / mol)
• LPG composition (0%, 30%, 40%, and 50%)
3 RESULTS AND DISCUSSION
The next step is to form a correlation that can deter-
mine the MMP value for Field X with the constituent
variables in the form of parameters that are significant
to the MMP value. The formation of this correlation
uses the Design of Experiment (DOE) method as de-
scribed previously. The DOE feature in MINITAB 17
software with the Two-Level Factorial Design model
requires 8 input data in the form of MMP values be-
cause there are 3 parameters to be tested. Each param-
eter requires input data in the form of maximum and
minimum sensitivity values. Then, the MMP value
A Novel Correlation on MMP Prediction in CO2-LPG Injection System: A Case Study of Field X in Indonesia
287
for each pair of sensitivity values between parameters
was included in MINITAB 17. The input data for this
DOE can be seen in Table 7.
Table 1: DOE Input Data.
MW
C6+
Co2 Temperature
(
◦
f)
MMP(psi)
196.073 100 250 2795.00
196.073 50 250 1336.33
196.073 100 300 3025.00
196.073 50 300 1788.75
250 100 250 3455.00
250 50 250 1920.00
250 100 300 3900.00
250 50 300 2122.82
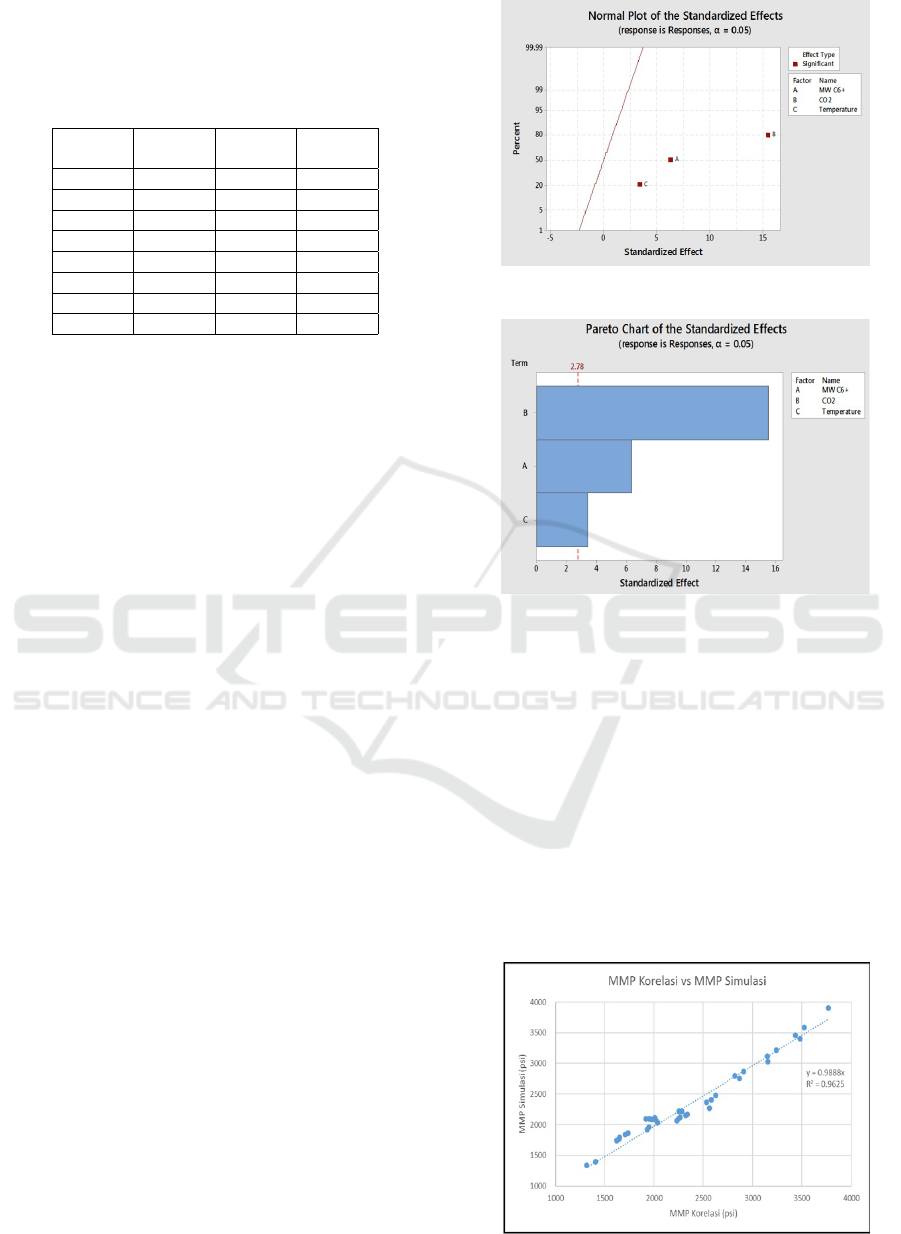
The results obtained for the DOE in this study can
be seen in the Pareto Chart and Normal Plots shown
in Figure 2 and Figure 3. In the Pareto Chart, it can
be seen that the three parameters have a significant ef-
fect on the determination of the MMP Field X value.
This can be seen from 3 the parameter bar has crossed
the minimum line which indicates the boundary of a
parameter has a significant effect or not. From the
Pareto Chart, it can be seen that the parameter with
the most significant effect is the composition of CO2 -
LPG, then followed by the molecular weight of C6 +,
and finally the temperature. This shows that the effect
of the composition of CO2 - LPG is the most impor-
tant parameter in reducing MMP on case of Field X.
In addition, Normal Plot also shows that all three pa-
rameters have a significant effect on MMP values and
CO2 - LPG composition parameters having the far-
thest point from the normal line. This again confirms
how the composition of CO2 - LPG has the most sig-
nificant effect. The three parameters are to the right
of the normal line which indicates that the higher the
value of the parameter, the MMP value will also in-
crease (positive effect). This is because in this DOE
test the composition parameters of CO2 - LPG only
use CO2 input as a parameter so that the increase
in CO2 composition will certainly increase the MMP
value.
Furthermore, MINITAB 17 software forms a cor-
relation consisting of these parameters. The correla-
tion formed is a linear correlation. The correlation is
as follows.
MMP = - 4075 + 11.37 x (MW C6) + 30.04 x (CO2)
+ 6.65 x (T)
From the correlation, the R-Squared value is
98.65%, with the Standard Error of Regression (S) of
136,754. The correlation summary model is shown in
Table 2. This shows that the resulting correlation is
very good and has a high match with the input data.
Furthermore, a feasibility test for the correlation
Figure 2: Normal Plot of Parameter Effects.
Figure 3: Pareto Chart of The Correlation.
that has been formed is carried out by calculating the
previous MMP value. From the results, it can be seen
that the Average Absolute Relative Error (AARE)
value is 4.52% with Maximum Absolute Relative Er-
ror (MARE) of 13.22%. In addition, a graph plot was
carried out between the slimtube MMP value and the
MMP value calculated using correlation. The results
can be seen in Figure 4. The R-Squared generated
in this graph is 96.47% which means that this corre-
lation is considered to determine the MMP value for
Field X.
Figure 4: Accuracy of the New MMP Correlation.
ICoSET 2019 - The Second International Conference on Science, Engineering and Technology
288
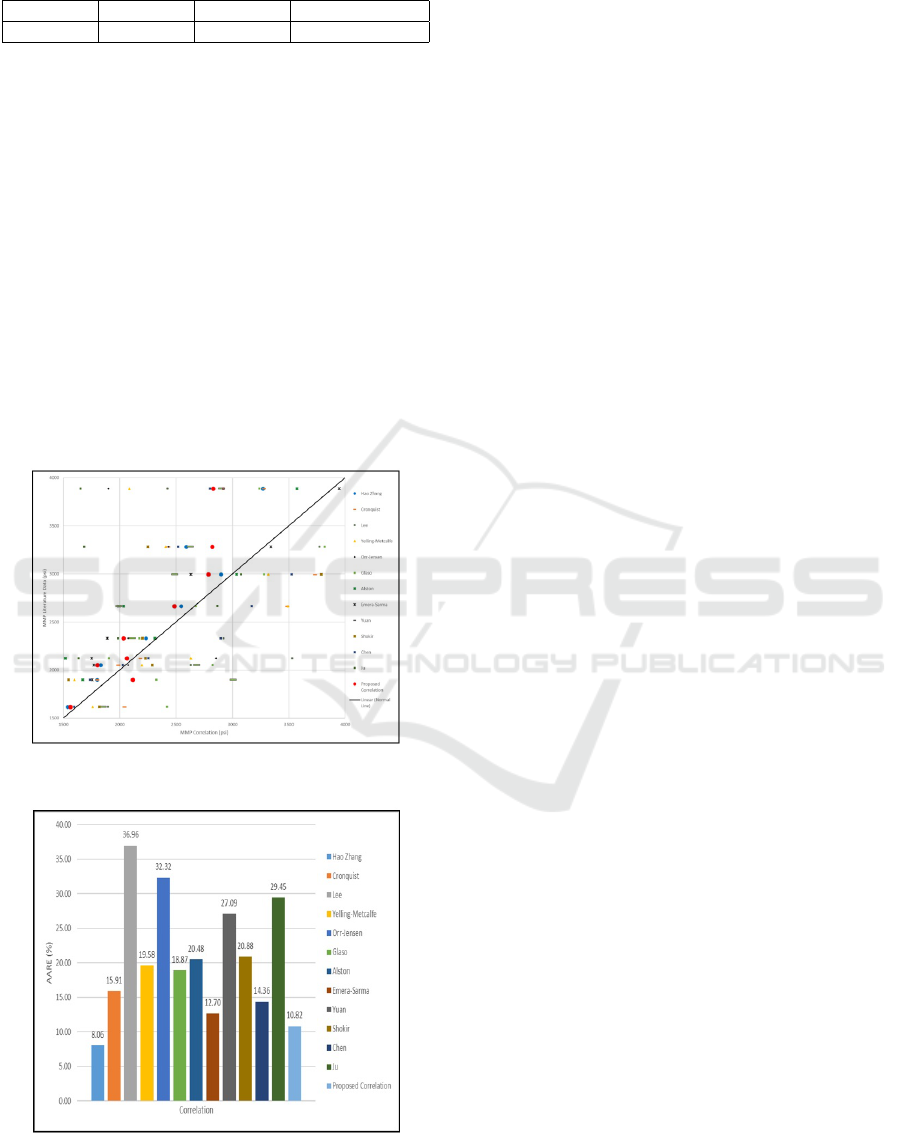
Table 2: Correlation Summary.
S R-sq R-sq(adj) R-sq(pred)
136.754 98.65% 97.64% 94.62%
Correlations that have been formed will then be
compared with various other correlations. There are
12 correlations that will be used to test the feasibil-
ity of the correlations that have been formed. The 12
correlations were the correlations of Cronquist, Lee,
Yelling-Metcalfe, Orr-Jensen, Alston, Emera-Sarma,
Yuan, Shokir, Chen, Ju, and Hao Zhang. This correla-
tion will be used to calculate MMP values in various
oil conditions. There are 9 oil data with various com-
positions and temperatures obtained from various lit-
erature. The oil data will be used as input data for cal-
culating MMP values with the correlations mentioned
above. Comparison between MMP correlation values
and literature MMP is shown in Figure 5. In addi-
tion, the AARE value of each correlation is shown in
Figure 6.
Figure 5: Comparison of MMP Calculation Correlation.
Figure 6: AARE Comparison of MMP Correlations.
From the results of calculations that have been
made, it can be seen that the correlation proposed in
this study has AARE and MARE values of 10.82%
and 27.18%. Meanwhile, the correlations of Cron-
quist, Lee, Yelling-Metcalfe, Orr-Jensen, Alston,
Emera-Sarma, Yuan, Shokir, Chen, Ju, and Hao
Zhang produced an AARE score of 15.91%, 36.96%,
19.58%, 32.32% respectively. , 18.87%, 20.48%,
12.70%, 27.09%, 20.88%, 14.36%, 29.45%, and
8.06%. This means that the correlation formed has
quite good results because other correlations have a
greater AARE value, except for the correlation of Hao
Zhang who has AARE of 8.06%. This can occur be-
cause the correlation formed in this study uses C6 +
heavy components while the input data is C7 +. In ad-
dition, the parameters for the formation of correlation
in this study have not been checked with a broader
value. Even so, the results of calculating the MMP
value using the correlation formed from this study can
be said to be better than some of the existing correla-
tions.
4 CONCLUSIONS
Based on the studies that have been done, the obtained
conclusion as follows.
• The method of reducing CO2 injection MMP by
mixing LPG and CO2 first successfully reduces
MMP significantly more than the CO2 injection
MMP reduction method by mixing LPG into Field
X oil. Thus, the mixing method of LPG and CO2
is the most optimal method to reduce CO2 injec-
tion MMP in Field X.
• In Field X, the composition of CO2 - LPG, C6
+ molecular weight, and temperature are parame-
ters that significantly influence the CO2 injection
MMP value. The average MMP value decreased
by 29.5% with an increase in the composition of
LPG in the gas mixture of CO2 - LPG injection by
30%, the MMP value increased by an average of
23% with a change in molecular weight of hexane
plus of 27.5% higher than before, and the MMP
value increased by an average of 13.4% with an
increase in temperature of 20%.
• The resulting correlation to determine the value
of MMP of CO2 injection in Field X is as fol-
lows. MMP = - 4075 + 11.37 x (MW C6) +
30.04 x (CO2) + 6.65 x (T). The correlation has R-
Squared of 98.65% and AARE between the MMT
results of the slimtube simulation and the correla-
tion is 4.52%.
• The resulting correlation has AARE of 10.82%
and MARE of 27.18% when tested using data
A Novel Correlation on MMP Prediction in CO2-LPG Injection System: A Case Study of Field X in Indonesia
289

from other literature. Correlations of Cron-
quist, Lee, Yelling-Metcalfe, Orr-Jensen, Alston,
Emera-Sarma, Yuan, Shokir, Chen, Ju, and Hao
Zhang produced AARE values in a sequence
of 15.91%, 36.96%, 19.58%, 32.32%, 18.87%
, 20.48%, 12.70%, 27.09%, 20.88%, 14.36%,
29.45%, and 8.06%. Compared to other corre-
lations, the correlation formed in this study re-
sulted in a fairly good MMP value because it has
a smaller AARE value, except the Hao Zhang cor-
relation which has an AARE value of 8.06%.
REFERENCES
Al-Hinai, K., Al-Bemani, A., and Vakili-Nezhaad, G.
(2014). Experimental and theoretical investigation of
the co2 minimum miscibility pressure for the omani
oils for co2 injection eor method. International Jour-
nal of Environmental Science and Development.
Bayagub, F. (2017). Study of Miscible Flooding Design Us-
ing LPG Mixture to Increase Oil Recovery. Institut
Teknologi Bandung, Bandung.
Bayat, A. (2015). Application of co2-based vapor extrac-
tion process for high pressure and temperature heavy
oil reservoirs. Journal of Petroleum Science and En-
gineering.
Bon, J. and Sarma, H. (2005). An investigation of mini-
mum miscibility pressure for co2 - rich injection gases
with pentane-plus fraction. Kuala Lumpur: Society of
Petroleum Engineers.
Elsharkawy, A. Measuring co2 mmp: Slimtube or rising
bubble method? Energy and Fuel, 10:2.
Glaso (1985). ”generalized minimum miscibility pressure
correlation”. paper spe 12893 pa. In SPE Annual Tech-
nical Conference and Exhibition. San Antonio, Texas.
Holm, L. (1987). Miscible displacement. Petroleum Engi-
neering Hand Book, Society of Petroleum Engineers,
page 1–45.
Holm, L. and Josendal, V. (1974). Mechanisms of oil dis-
placement by carbon dioxide. Society of Petroleum
Engineers, 4736.
Ju, B., Qin, J., Li, Z., and Chen, X. (2012). A pre-
diction model for the minimum miscibility pressure
of the co2-crude oil system,. Acta Petrolei Sinica,
33(2):274–277.
Kumar, N. and Von Gonten, W. (1973). An investigation of
oil recovery by injecting co2 and lpg mixtures. 48th
annual fall meeting. of the Society of Petoleum Engi-
neers of AIME. Las Vegas: American Institute of Min-
ing, Metallurgical, and Petroleum.
Lake, L. (1989). Enhanced Oil Recovery. Prentice-Hall,
Inc, USA.
Martin, D. and Taber, J. (1992). Carbon dioxide flooding.
Society of Petroleum Engineers.
Muslim dan Permadi, A. (2016). Pencampuran gas co2 un-
tuk menurunkan tekanan tercampur minimum: Studi
kasus pada lapisan ab-4 dan ab-5 formasi air benakat,
cekungan sumatera selatan jurnal teknologi minyak
dan gas. Bumi, 10(1).
Ortega, A. (2017). Effect of liquified petroleum gas (lpg) on
heavy oil recovery process. The Italian Association of
Chemical Engineering.
Permadi, A. (2014). Introduction To Petroleum Reservoir
Engineering. ITB, Bandung.
Rommerskirchen, R. and Nijssen, P. (2016). Reducing the
miscibility pressure in gas injection oil recovery pro-
cesses. abu dhabi. In International Petroleum Exhibi-
tion & Conference in Abu Dhabi, UAE, page 7–16.
Yellig, W., , and Metcalfe, R. (1980). Determination and
prediction of co2 minimum miscibility pressure. Jour-
nal of Petroleum Technology, 32:1.
Zhang, H., Hou, D., and Li, K. (2015). An improved co2-
crude oil minimum miscibility pressure correlation.
Technical report, School of Energy, Chengdu Univer-
sity of Technology, Chengdu, Sichuan.
Zhang, P., Sayegh, S., , and Zhou, X. (2004). Effect
of co2 impurities on gas-injection eor processes. In
SPE/DOE Fourteenth Symposium on Improved Oil
Recovery held in Tulsa. Oklahoma, U.S.A.
ICoSET 2019 - The Second International Conference on Science, Engineering and Technology
290
