
Productivity Analysis of Frac-pack Completion in M Well with Sand
Problem Indication and High Permeability Formation
Herianto, Prasandi Abdul Aziz, Wijoyo Niti Daton, Steven Chandra
Petroleum Engineering Program, Institut Teknologi Bandung, Jalan Ganesha No 10, Bandung, Indonesia
Keywords:
Frac-pack, Completion, Sand Control, Skin, Productivity Index.
Abstract:
Sand problem is one of the obstacles happening in oil and gas wells, especially in poorly consolidated for-
mation. flowing fluid will generate friction force during flow in porous media and in a longer timeframe, it
can erode the wall of formation and sand will be produced along with the hydrocarbon and become problem
in the whole production system. The negative impacts of this sand start from eroding the tubing wall until
entering the surface facilities, such as separator. Due to this problem, the damaged equipment needs to be
fixed or maintained, which means additional cost. Frac-pack is one of completion methods which is quite
popular nowadays in oil and gas industry due to its proven effectiveness of utilization in the field. Frac-pack is
a combination between hydraulic fracturing and sand control. Utilization of gravel pack only will cause addi-
tional skin for wellbore, leading to decrement of well productivity index. In frac-pack, the hydraulic fracturing
process will cover the losses and reduce the skin generated. Therefore, sand problem can be mitigated, and
production also can be compensated. This study will observe frac-pack, starting from its history, mechanism
and effectiveness to be applied in M Well. The gravel pack size will be calculated first and is used as fun-
damental of proppant size selection. Then, fracturing process simulation is done using commercial software
generating fracture width and fracture half-length. The result will be used to calculate final well productivity
by considering skin generated. This research has proven that productivity can be enhanced by using frac-pack
until 5.23%. Therefore, frac-pack can be an effective choice of sand control completion method in M Well.
1 INTRODUCTION
Well completion is a process of preparing drilled
well to become a ready-to-produce well. In other
words, it is a bridge between drilling and produc-
tion phase. Well completion itself consists of many
sub-processes, i.e. perforation and surface facility in-
stallation. In designing a good well completion plan,
there are many things that should be put into consid-
eration. One of them is concern if the well produces
sand or not.
Sand production has been an obstacle in oil and
gas industry. Sand production is usually caused by
poorly consolidated formation. The problem becomes
a challenge for companies since it can bring harm to
hydrocarbon production and the durability of equip-
ment. These damages are finally leading to cost in-
crement, which is avoided by company. Negative im-
pacts of sand production can be: produced sand be-
comes waste at surface; eroded tubing or casing wall;
maintenance cost of surface facilities to remove the
produced sand.
Sand problem itself is not a new thing anymore in
Indonesia. Many wells in Kalimantan Island has ex-
perienced severe sand problem (Angtony et al., 2018;
Abass and Nasr-El-Din, ; Bellarby, ). There have
been some completion methods, which have been
usually used to mitigate sand problem in unconsol-
idated reservoir, such as critical rate control, gravel
pack, chemical consolidation and frac-pack. These
proposed methods cause dilemma for companies due
to the impacts they give. Critical rate control is a
method of maintaining the producing rate below the
limit of erosion rate. This can be useful but still it sets
a limit to hydrocarbon production.
Second, gravel pack is quite popular, but it takes
expensive cost for the installation and maintenance.
Furthermore, the gravel pack can give additional skin
to the reservoir. The third method is chemical con-
solidation, which can also cause permeability reduc-
tion, leads to decrement of hydrocarbon production
(Chaudhri, 2003; Cinco-Ley and Samaniego, ).
Nowadays, in oil and gas industry, frac-pack
becomes a thing for becoming chosen completion
Herianto, ., Aziz, P., Daton, W. and Chandra, S.
Productivity Analysis of Frac-pack Completion in M Well with Sand Problem Indication and High Permeability Formation.
DOI: 10.5220/0009359902910298
In Proceedings of the Second International Conference on Science, Engineering and Technology (ICoSET 2019), pages 291-298
ISBN: 978-989-758-463-3
Copyright
c
2020 by SCITEPRESS – Science and Technology Publications, Lda. All rights reserved
291

method to mitigate sand control. This is not surpris-
ing since frac-pack combines two processes, fractur-
ing and packing. Fracturing will create more paths
for hydrocarbon to flow and gravel packing will resist
sand to be produced. Thus, well productivity logically
will increase but still sand problem can be mitigated.
This thesis will mostly talk about frac-pack and its
modelling in M Well in Indonesia.
2 BASIC THEORY
History of Frac-pack
Frac-pack term is first popularized in the late of 1950
by Shell in Germany to define a completion method
which conducts fracturing before installing gravel
pack (Ellis, 1998). Another application of frac-pack
is conducted by Amoco in Hackberry, Louisiana, in
1964, which involves fracturing method in the current
sand control completion. At that time, the process is
called “hack fracs” (Ellis, 1998; Economides et al., ).
Not until the successful result of Tip-Screenout
(TSO) in North Sea Chalk formations. Prudhoe
Bay and Kuparuk Field (Alaska) in 1987, frac-pack
method is focusly developed. Over the years, frac-
pack is now utilized by combining TSO hydraulic
fracture, which creates short and high conductive
fracture, and gravel pack, which resist the proppant
from flowing back. The fracture created is meant to
bypass near-wellbore damages, which can give nega-
tive impact to hydrocarbon production.
However, before frac-pack is highly recom-
mended for sand problem mitigation nowadays, this
method apparently is used to be highly debatable.
This conflict is caused by concerns that frac-pack is
prone to problems, such as adding the completion cost
and contaminating the nearby water bearing sands.
This concerns can be tackled by the effectiveness of
frac-pack utilization in many fields in the world, starts
from Gulf of Mexico, America, Africa, Europe un-
til Asia Pacific, as stated by R.C. Ellis (Ellis, 1998;
Febriani, 2003; Hashemi and Gringarten, ). Until
now, the number of frac-pack utilization keeps in-
creasing all over the world and this shows a good
prospect of frac-pack in the future.
Frac-pack Mechanism
Frac-pack is originally a combination between frac-
turing and gravel-pack. The standard to measure a
successful frac-pack is the ability of this method to
mitigate sand problem and at the same time create
fracture to cover the skin made by the sand screens.
This fracture created is held open by utilizing prop-
pant pumped along with the fracturing fluid.
Tip-screen out fracturing is a method used to do
fracturing in weak and high permeability reservoir.
The goal is creating short and wide fracture with
length of 25 to 50 ft and width of 1 to 2 in by forcing
an early screen-out. Screen-out is a condition when
treatment area cannot accept proppant anymore, caus-
ing the pump pressure increase to its limit and prop-
pant cannot flow farther to the tip (Houchin and Dun-
lap, ; Odeh, 1980; Ott, 2003). This is occurred when
the fluid leaks off to the formation faster than pre-
dicted, caused by the high permeability of the forma-
tion. Screen-out is usually undesirable because a frac-
turing process with early screen-out cannot achieve its
designed fracture length and width. However, in frac-
pack, the fracture geometry is not the main goal. Frac-
turing process is conducted by following these stages:
• Spearhead stage
Also known as acid stage, this stage is meant to clear
debris which may still exist in the wellbore by using
a mixture of water and diluted acid, i.e. hydrochloric
acid. The result of this stage is a clear pathway for
fracturing fluid to flow into the formation.
• Pad stage
In this stage, the fracturing fluid will be pumped into
the well to frac the formation and initiate fracturing
of target formation. Due to its purpose to make frac-
tures only, proppant has not been mixed in the fractur-
ing fluid. Proppant/slurry stage In this stage, proppant
(sand) will be mixed with the fracturing fluid before
being pumped into wellbore. Proppant is used to keep
the fracture opened. Thus, it is meant to maintain the
enhanced permeability created by the fracturing in the
pad stage.
• Flush stage
In this stage, fresh water will be pumped into well-
bore. It is meant to flush out any excess proppant,
which may still exist in the wellbore. Tip Screen-out
fracturing process in each stage can be seen in Figure
1.
Frac-pack Benefits
Frac-pack offers many benefits, which impacts
to its popularity as sand control completion method,
which are:
• Lower average skin value: skin generated from
fracturing process can reduce the skin create by
the gravel pack only, leading to a better produc-
tivity.
• Support high production rate of production
• Longer life span. As proppant is filling the frac-
ture to the tip, the sand will be filtered from pack
at the tip first. This can improve the life span of
frac-pack because the sand pack around perfora-
tion is not affected too much.
ICoSET 2019 - The Second International Conference on Science, Engineering and Technology
292

Figure 1: Tip Screen-out Process (Well Completion Design
(Bellarby,2009))
• Has small failure percentage, shown in Figure 2
than other sand control completion method.
Figure 2: Comparison on Failures of Sand Control Method
(Ellis, 1998)
Frac-pack Limitation
Despite of its effectiveness, frac-pack also has some
limitations, namely
• Inappropriate for wells with gas cap
• Inappropriate for wells with poor cement quality
• Inappropriate if there is no effective barrier be-
tween aquifer and reservoir zone. However, thin
shale barrier (about 1 m) is enough to ensure safe
operation
3 METHODOLOGY
Sand Pack Sizing
In frac-pack method, this sand sizing is used later to
determine the size of proppant used in fracturing pro-
cess. Proppant will take role to keep the fracture open
and become screen for sand. In determining which
size of proppant to use, sieve analysis is one com-
mon method to use. In this thesis, sizing will be
based on Schwartz correlation (1969)(Pucknell and
Clifford, ; Renpu, ; Saucier, 1974), which considers
the uniformity of formation and velocity to pass the
screen. The sieve analysis result will be used to calcu-
late the gravel size. For non-uniform sand condition,
Schwartz suggested a correlation to determine the ef-
fective gravel size.
D
(
40(gravel)) = 6 ∗ D
(
40( f ormation)) (1)
D40(gravel) is the recommended gravel size and
D40(formation) is formation grain size where 40% of
the grain is grain from the biggest diameter. In addi-
tion, uniformity coefficient term is introduced to ana-
lyze the distribution of gravel size, formulated as fol-
lows.
UC = D
g
40/D
g
90 (2)
Then, a minimum and maximum size of gravel diam-
eter is calculated using these formulas.
D
(
40(gravel)) = 0.615 ∗ D
g
40 (3)
D
(
40(gravel)) = 1.383 ∗ D
g
40 (4)
The minimum and maximum values of gravel di-
ameter will be suited to the availability of sand pack
size, shown in Figure 3.
Hydraulic Fracturing Simulation
After determining the suitable proppant size, the
next step is making simulation of fracturing. This
simulation is held in a commercial fracturing soft-
ware. In this software, fracture analysis is conducted.
The procedures, as shown in Figure 4, are: enter-
ing the well parameters, selecting proppant, select-
ing fracturing fluid, designing treatment schedule and
Productivity Analysis of Frac-pack Completion in M Well with Sand Problem Indication and High Permeability Formation
293
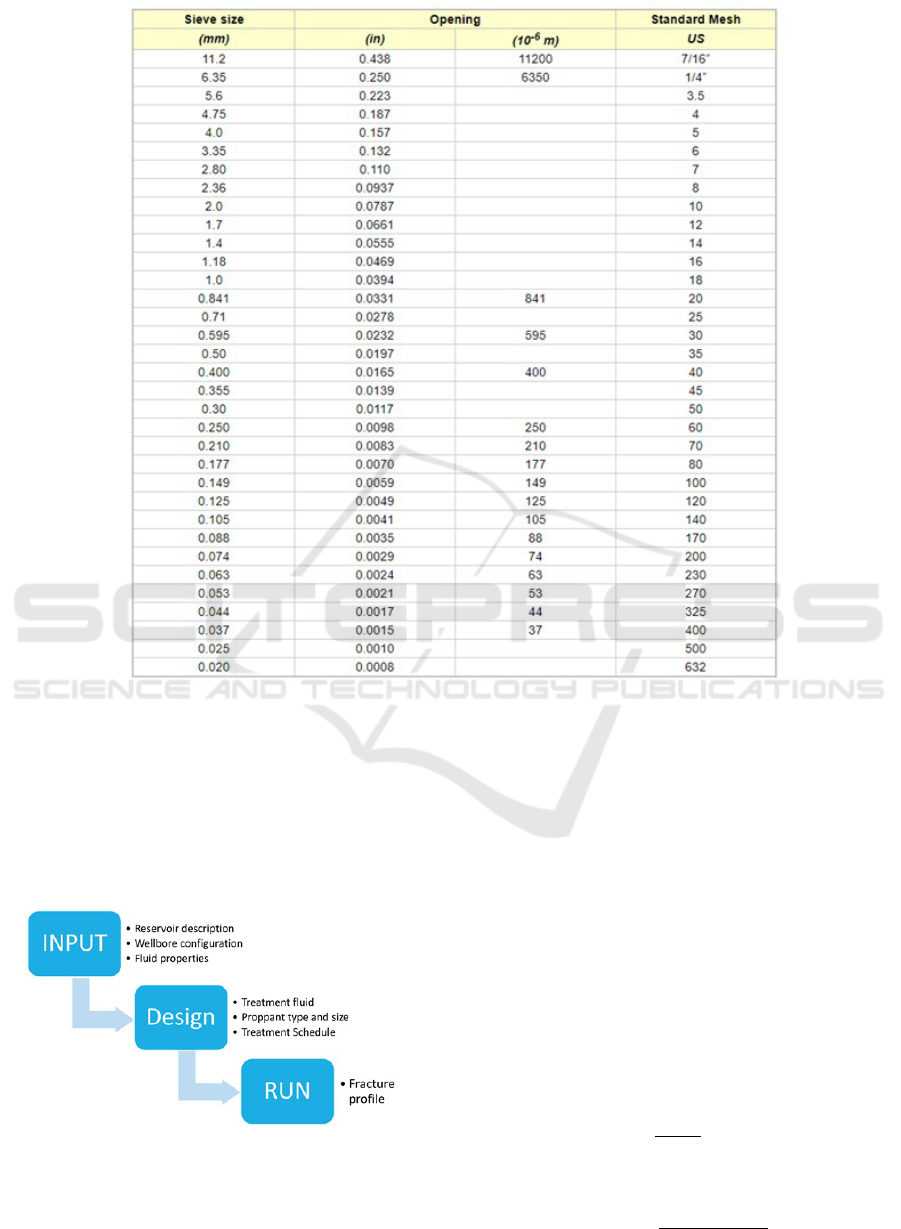
Figure 3: Availability of Gravel Pack Size (Reproduced from Febriani, 2003)
running the simulation. The simulation result will
show the fracture profile, from the proppant con-
centration until the fracture conductivity distribution.
The result will be used in the next step, which is de-
termining whether frac-pack is effective to be applied
in M well or not.
Figure 4: Flowchart of fracturing simulation
Skin Calculation
Frac-pack will be called effective if it can miti-
gate sand problem by applying the sand screen and in-
crease the production. This can be known by calculat-
ing the skin that may be caused by frac-pack process.
Based on the book written by Chaudhri (Chaudhri,
2003), there are some causes that can create skin. In
this thesis, there are only three relevant skin causes,
which are: partial penetration, perforation and frac-
turing.
Skin Due to Partial Penetration
Partial penetration is commonly happened in gas
well. The wells are usually produced in only certain
parts of pay zone, creating limited entry for the fluid.
Partial penetration scheme can be seen in Figure 5.
The formula to calculate skin factor due to partial pen-
etration, Sp, is presented by Yeh and Reynolds (Yeh
and Reynolds, ), as follows.
S
p
=
1 − b0
b0
)ln(h
wd
) (5)
Where :
h
w
d =
c
0
b
0
(1 − b
0
)h
d
exp(c
1
)
(6)
ICoSET 2019 - The Second International Conference on Science, Engineering and Technology
294
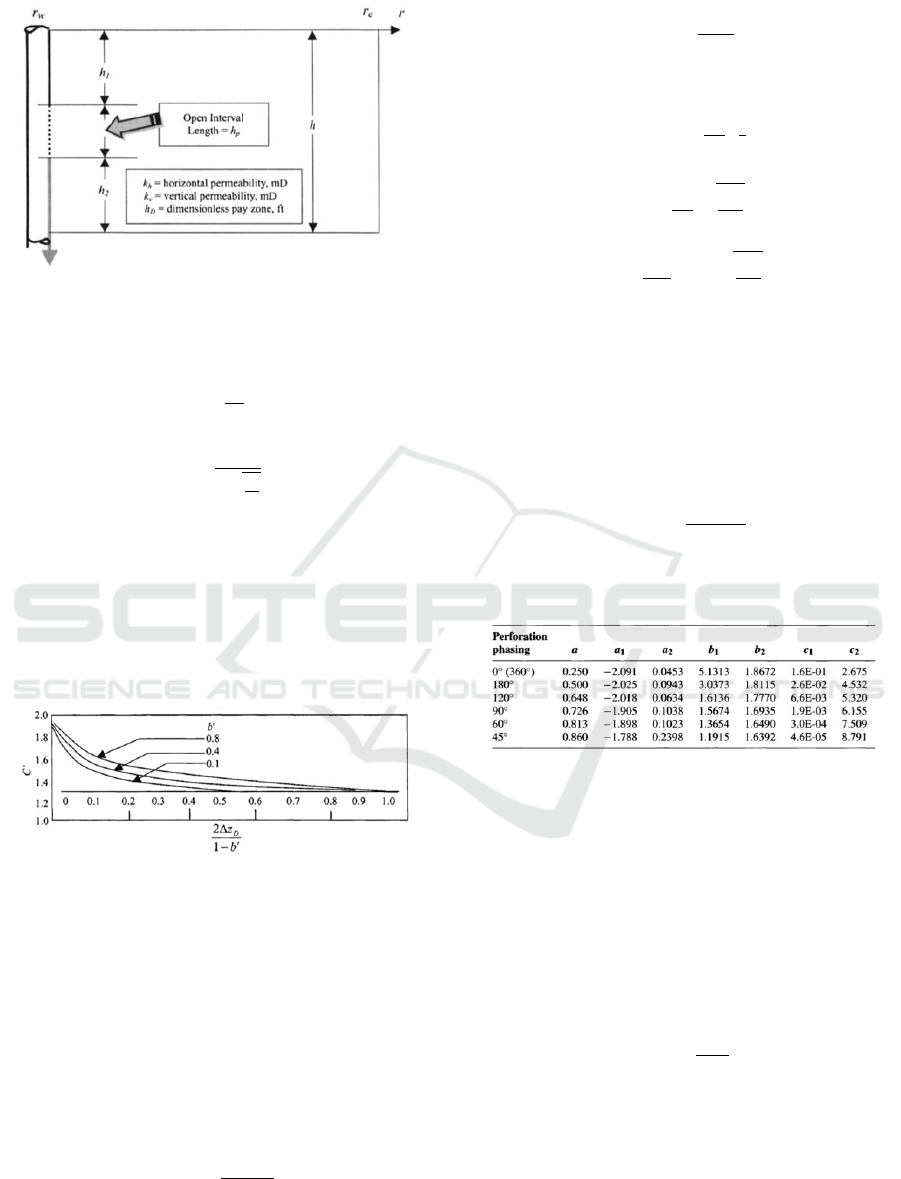
Figure 5: Partial Penetration Scheme (Gas Well Testing
Handbook (Chaudhri,2003))
b
0
=
h
p
h
(7)
h
D
=
h
rw
q
kh
kv
(8)
c
1
= 0.481 + 1.01(b
0
) − 0.838(b
0
)
2
(9)
∆Z
D
=
h
1
h
2
h h
1
(10)
While c’ can be estimated using the graph in Fig-
ure 6.
Figure 6: C’ Determination on Yeh and Reynolds Method (
Gas Well Testing Handbook (Chaudhri,2003))
Skin Due to Perforation
Skin due to perforation can be calculated using
a semi-analytical solution presented by Karakas and
Tariq (Karakas and Tariq, 8247). This perforation
skin is sum of plane flow effect (S
H
), vertical skin
effect (S
V
) and wellbore effects (S
wb
).
Plane Flow Effects
S
H
= ln
rw
r
0
w(θ)
) (11)
r
0
w
(θ) =
a
θ
(r
w
+ L
perf
)
f orθ 6= 0 (12)
r
0
w
(θ) =
a
θ
(r
w
+
L
perf
4
)
f orθ = 0 (13)
Vertical Skin Effect
S
v
= 10
a
h
b−1
d
r
b
d
(14)
h
d
=
hp
l p
r
kv
kH
(15)
r
d
=
r
p
2h
p
1 +
r
kv
kH
(16)
a = a
1
logr
D
+ a
2
(17)
b = b
1
r
D
+ b
2
(18)
Wellbore Effects
S
w
b = c
1
e
c2rWD
(19)
r
W
D =
r
w
L
P
+ r
w
(20)
a
1
,a
2
,b
1
,b
2
,c
1
, c
2
are functions of perforation
phasing and can be seen in Figure 7.
Figure 7: Constants for Perforation Skin Effects Calculation
(Gas Well Testing Handbook (Chaudhri,2003))
After calculating all those elements, skin due to
perforation can be calculated using this formula:
S
P
f = S
H
+ S
V
+ S
w
b (21)
Skin Due to Fracturing Fracture performance is a
function of dimensionless fracture conductivity (CfD)
as shown in Figure 8. Dimensionless fracture conduc-
tivity can be calculated using this formula.
C
f d
=
k f w
kx
f
(22)
This relationship is presented by Cinco-Ley and
Samaniego (1981). Equivalent wellbore radius is cal-
culated for the fracture by assuming that the fracture
is not adjacent to ant boundaries that may cover in-
terval of its reservoir. Using blue line in Figure 8,
skin due to fracturing can be determined using this
relationship S
f
+ln(x
f
/r
w
). In 2005, the relationship
Productivity Analysis of Frac-pack Completion in M Well with Sand Problem Indication and High Permeability Formation
295

Figure 8: Fracture Performancen Under Pseudo Radial
Flow (Well Completion Design (Bellarby,2009))
between skin and dimensionless fracture conductiv-
ity (CfD) is generalized and validated by Meyer and
Jacot (Meyer and Jacot, ).
Productivity Analysis
Determination on whether the productivity is in-
creasing or not can be concluded by its Fold of In-
crease (FOI), which is represented below:
FOI =
ln
re
rw
− 0.75 + S
pre
ln
re
rw
− 0.75 + S
post
(23)
4 CASE STUDY
This thesis uses data from M well, an offshore gas
well in Indonesia which has been indicated to produce
sand. The reservoir pore pressure is measured to be
5,812 psi. This well’s formation has medium to high
permeability for about 259 mD and porosity for about
19.4%. The fluid viscosity is about 0.0299 cp. Water
saturation in this well is big enough, for about 41%.
This reservoir is sandstone in the interval of 10,335
– 10,839 ft TVDSS. There is no gas cap indication
that means frac-pack can be conducted in this well.
In addition, the water depth is 4,255 ft and has been
observed that the temperature in depth of 10,312 ft is
182°F.
Based on DST data which conducted in M Well,
the drainage radius of this well is 4000 ft. The design
of M well consists of 4 casing string: conductor cas-
ing, surface casing, intermediate casing and produc-
tion liner with OD of 36”, 20”, 13-5/8” and 9-5/8” in
order. This well is perforated in the interval of 10,405
– 10,479 ft TVDSS. The perforation scheme is: shot
density: 4 SPF; perforation radius (rp): 0.25 inches;
perforation penetration depth (L
perf
): 8 inches and
phasing angle: 120°.
A study has been conducted to analyze the rock
strength of M reservoir and the result states that the
formation is medium in strength, means that this well
needs sand control method so that it can produce
fluid until depletion phase. Furthermore, the reser-
voir is not well distributed so that a completion type
with larger gravel/sand interface is required to pre-
vent plugging. Frac-pack is the sand control method
chosen to mitigate sand problem in this well. To de-
termine the effective gravel size, sieve analysis is con-
ducted with the result in Table 1.
5 RESULT AND DISCUSSION
The sieve analysis result shows that the uniformity co-
efficient is 6.18. From Table 2, C value shows that the
sand grain in this M formation is poorly sorted. In or-
der to use Schwartz correlation, D40 value is required.
From the calculation, it is obtained that D40 value is
0.01793 in. The gravel design, based on Schwartz
concept, results in minimum gravel diameter (D
min
)
of 0.01103 in and maximum gravel diameter (D
min
)
of 0.02480 in. According to the availability of gravel
size shown in Figure 3, the gravel size chosen is 20/40
US Mesh. This result will be used to choose proppant
selection in Fracpro simulation.
Proppant used in the simulation is Brady 20/40 be-
cause of some reasons. First, Brady 20/40 is a natural-
source sand, make it easy to obtain. The sand will be
shifted to the size of 20/40 US Mesh. Due to its avail-
ability, this sand will cost cheaper than another type
of proppant.
Second, the screen will have a certain life span.
In a time, the screen will be run out because it will
be plugged by fine sand. That makes refracturing will
be required. Using this type of proppant will make
the refracturing easier. This refracturing is conducted
after re-perforating the formation by using deep pen-
etrating perforation. If resin-coated proppant or ce-
ramic proppant is used, the process will be more dif-
ficult because those proppants will create a harder
layer. Furthermore, Brady 20/40 is enough for this
formation since the formation is not a tight formation
or basement.
Fracturing fluid used in this simulation is Dy-
nafrac HT 30, provided by Weatherford. Fracturing
fluid will be used to bring proppant along, thus need a
gel strength. Dynafrac HT 30 with viscosity of 270.9
cp is suitable to provide a good gel strength. In addi-
tion, this fluid is common so it will be easy to obtain.
In this case with high permeability involved, a
slow fluid rate will be inappropriate. High permeabil-
ity means that there will be more hole or pores in the
ICoSET 2019 - The Second International Conference on Science, Engineering and Technology
296

Figure 9: Fracture Profile as result from Fracpro simulation
Table 1: Sieve Analysis Result of M Well Formation
MEASUREMENT I MEASUREMENT II
NO. MESH IN % WEIGHT
% CUMM.
WEIGHT
% WEIGHT
% CUMM.
WEIGHT
1 20 0.0331 9.837 9.837 12.791 12.791
2 30 0.0232 2.350 12.187 2.581 15.372
3 35 0.0197 1.843 14.030 1.723 17.095
4 50 0.0117 7.591 21.621 7.661 24.755
5 60 0.0098 3.679 25.301 3.469 28.225
6 80 0.0070 9.496 34.797 6.786 35.011
7 100 0.0059 5.688 40.485 7.591 42.602
8 200 0.0029 32.005 72.490 26.691 69.293
9 pan 0 27.510 100 30.707 100
Table 2: C value Description
C<3 well sorted, highly uniform sand
3<C<5 uniform sand
5<C<10 moderate/poorly sorted sand
C>10 poorly sorted highly non-uniform sand
formation, commonly called sink hole. Thus, the frac-
turing fluid pumped to reservoir can enter the hole. If
the rate is slow, the fluid can easily flow to the macro
pores, leaving the proppant and then leading to early
screen-out. This will create a very short fracture and
fail to make a good frac-pack. However, in frac-pack
method, a long fracture is unneeded because the focus
is to mitigate the sand problem but here the treatment
designed should be used effectively. That is why, in
this case, a rate of 50 bpm is used. Meanwhile, the
slurry treatment is conducted in 6 stages, whose prop-
pant concentration are 2, 2, 3, 4, 5 and 6 ppg respec-
tively. This is done so that the proppant will be well
spread in the fracture until the tip.
The fracture profile is shown in Figure 9. The
proppant concentration profile shows that the prop-
pant has been well spread in the fracture. It is less
and less to the fracture tip. The fracture width (W
f
)
and half-length (X
f
) created are 0.025 ft (0.3 in) and
80.9 ft respectively. The dimensionless fracture con-
ductivity is 0.03511.
Then, skin calculation is done based on formula
in Subchapter 3. It is assumed that M formation is
isotropic. The result is shown in Table 3. From the
result, the fracture skin is negative, means that frac-
pack is successful because it can reduce the damage
created by the partial penetration and perforation.
Fold of Increase is calculated to be 1.0523, means
that frac-pack has increased the well productivity of
5.23%. This is good result because the goal of frac-
pack, which are mitigating sand problem and increas-
ing productivity index, is achieved.
Productivity Analysis of Frac-pack Completion in M Well with Sand Problem Indication and High Permeability Formation
297

Table 3: Skin Calculation
Skin due to Partial Penetration Sp 27.80013
Skin Due to Perforation Spf 0.120039
Fracture Skin Factor Sf -1.80814
Skin before frac-pack Spre 27.92017
Skin after frac-pack Spost 26.11203
6 CONCLUSION
In designing frac pack completion for well M, the
proppant used is Brady 20/40, where the gravel size is
selected based on sieve analysis. The fluid used is Dy-
nafrac HT 30, whose vendor is Weatherford, based on
its suitable characteristic for this case. The designed
treatment has created fracture width of 0.3 in and frac-
ture half-length of 80.9 ft. This thesis proves that
frac-pack completion method is an effective method
to be applied in sand problem indicated well, in this
case, M well. The productivity enhancement is about
5.23%. This enhancement is happened due to fractur-
ing process.
REFERENCES
Abass, H. H. and Nasr-El-Din, H. A. 2002. Sand Con-
trol: Sand Characterization, Failure Mechanisms and
Completion Method. SPE, page 77686.
Angtony, W., Winarto, H., Chandra, S., Herianto, H., Nu-
groho, Y. A., and Marhaendrajana, T. (2018). Applica-
tion of Novel Doped Nanomaterial Resin to Increase
Sand Consolidation in A Loose Sandstone Reservoir.
Proceedings Indonesian Petroleum Association, Forty
Second Annual Conference and Exhibition.
Bellarby, J. 2009. Well Completion Design.
Chaudhri, A. U. (2003). Gas Well Testing Handbook.
Cinco-Ley, H. and Samaniego, F. 1981. Transient Pressure
Analysis for Fractured Wells. SPE, 7490.
Economides, M. J. et al. 1994. Petroleum Production Sys-
tems.
Ellis, R. C. (1998). An Overview of Frac-Packs: A Technical
Revolution (Evolution) Process.
Febriani, S. (2003). Penanggulangan masalah produksi.
Thesis in Islamic University of Riau No. TP.06. 01,
01.(01).
Hashemi, A. and Gringarten, A. C. 2005. Compari-
son of Well Productivity between Vertical, Horizontal
and Hydraulically Fractured Wells in Gas-Condensate
Reservoirs.
Houchin, L. R. and Dunlap, D. D. 1988. Formation Damage
during Gravel-Pack Completions. SPE, page 17166.
Karakas, M. and Tariq, S. (18247). 1988. Semi Analytical
Production Model for Perforated Completion.
Meyer, B. R. and Jacot, R. H. 2005. Pseudosteady-
State Analysis of Finite-Conductivity Vertical Frac-
tures. SPE, page 95941.
Odeh, A. S. (1980). An Equation for Calculating Skin Fac-
tor Due to Restricted-Entry. JPT, Journal of Petroleum
Technology,(June).
Ott, W. K. (2003). World Oil: Modern Sandface Completion
Practices Handbook First Edition.
Pucknell, J. K. and Clifford, P. J. 1991. Calculation on
Total Skin Factors. SPE, page 23100.
Renpu, W. 2011. Advanced Well Completion Engineering.
Saucier, R. J. (1974). Considerations in Gravel Pack De-
sign.
Yeh, N. S. and Reynolds, A. C. 1989. Computation of
the Pseudo-Skin Caused by a Restricted-Entry Well
Completed in a Multilayer Reservoir.
ICoSET 2019 - The Second International Conference on Science, Engineering and Technology
298
