
Arc Flash and ZSI Analysis for Personal and Equipment Protection
in Distribution System
Firilia Filiana, Yun Tonce Kusuma P., Kevin Qalby Andira, Mifta Nur Farid
Institut Teknologi Kalimantan
Keywords: Arc Flash; Distribution System; Personal Protective Equipment; Relay; Zone Selective Interlocking
Abstract: The distribution system has an important role in the electric power system. This system is directly related to
consumers so that continuity must be maintained. More and more customers are connected to the protection
system will increase the risk of interference. Disturbances that often arise in the electric power system are
short circuit. This fault can further cause arc flash, which endangers workers and equipment. Protection
equipment added to the distribution system is a circuit breaker (CB) and relay. Both of this equipment have
been widely used in electric power systems. To improve the performance of the relay settings, the Zone
Selective Interlocking (ZSI) method is applied to the overcurrent relay (OCR) and ground fault relay (GFR)
time settings. ZSI will determine priority areas that should not experience blackouts such as important
equipment such as generators or big loads and minimize trips by eliminating sources of interference as soon
as possible. The time setting of the ZSI method will be used as a parameter when calculating arc flash
energy. The results of this energy calculation are used as a reference to determine personal protective
equipment (PPE) that must be used when working in electrical areas. The combination of these two analyzes
protects the system from disruption while securing the workers in it.
1 INTRODUCTION
The protection system on the electric power system
is designed not only to protect equipment but also to
the workers inside. Equipment safety will affect the
safety of workers as well. The electrical system
safety equipment that is still commonly used is a
relay with the current transformer (CT) and circuit
breaker (CB). The time setting of the relay is very
important because the CB trip time will be a
parameter in the calculation of arc energy. The faster
the CB opens, the shorter the time of the arc.
However, CB trip time must still follow the
specified relay coordination to avoid trip errors
(Dugan, 2007; Doan et al., 2009; Simms and
Johnson, 2013) .
Improvements in the relay settings for the power
system have been carried out, for example, by
dividing the system into smaller parts. Relay settings
will be based on the state of this small system so that
information about the interference will be more
accurate. This relay setting can also be paired with
other analyzes to improve system reliability (Ma et
al., 2017; Shen et al., 2019; Kanabar et al., 2017) .
The arcing analysis itself can only be done after
the protection system has been well coordinated.
The arc event is unique in each event. Several
models have been carried out to illustrate the arc
events as in (Doan et al., 2009; IEEE, 2001; Doan
and Swiegart, 2003; Papallo, 2012) . Other factors
that influence arcing calculations, such as
grounding, isolation, switches, and the likelihood of
arcing events, have also been investigated to make
calculations closer to real events (Short and Eblen,
2012; Gregory and Lippert, 2012; Nelson et al.,
2014) .
The arc will cause energy to damage the affected
area. If there are workers who are near the short
circuit location, then the impact of the arc energy
can cause danger to workers. Therefore, the arc
energy can be a reference for protective clothing that
workers need to wear while working in voltage areas
(Dugan, 2007; Doan et al., 2009; Hoagland, 2013) .
Relay coordination settings can be improvised to
reduce the possibility of arcing hazards because the
timing parameters of arc events can be changed
through the relay settings (Simms and Johnson,
2013; Valdes and Dougherty, 2014; D’Mello et al.,
2016; Walker, 2013) . One method that has been
Filiana, F., Kusuma P., Y., Andira, K. and Farid, M.
Arc Flash and ZSI Analysis for Personal and Equipment Protection in Distribution System.
DOI: 10.5220/0009445002130220
In Proceedings of the 1st International Conference on Industrial Technology (ICONIT 2019), pages 213-220
ISBN: 978-989-758-434-3
Copyright
c
2020 by SCITEPRESS – Science and Technology Publications, Lda. All rights reserved
213

widely studied and used is the Zone Selective
Interlocking (ZSI) method. ZSI will divide the
power system into zones based on priority levels.
Fault in one zone will not affect the other zones and
will also minimize trip events so that power
continuity will be maintained (Valdes and
Dougherty, 2014; Hodgson and Shipp, 2010; Glover
et al., 2012) .
This research will apply ZSI on the coordination
of overcurrent relays and ground fault relays. Next,
perform an arc flash analysis to determine the
incident energy of the arc flash. The calculation of
relay settings and arc flash analysis uses the IEEE
standard, and the determination of personal
protective equipment is based on the NFPA 70E
standard.
The simulation is carried out on the distribution
system of the Balikpapan city. The distribution
system is an important part of a power system whose
continuity needs to be maintained. Distribution
system positions that are close to the load have the
potential to experience short circuit events that must
be immediately handled by workers in a voltage
situation.
2 PROTECTION SYSTEM OF
POWER SYSTEM
2.1 Distribution System
The power system is generally divided into four
parts, namely generators, transmission lines,
distribution lines, and loads. The distribution system
is a very important part of the power system for two
reasons, namely because it is the system closest to
the consumer, and the investment costs are high. If
there is a fault in the distribution system, it will
directly affect consumers. Unlike when there is a
disruption in the transmission system or generating
system that does not directly affect consumers
(Glover et al., 2012) .
2.2 Short Circuit Fault
A distribution system that is connected to many
loads has a high probability of interference. Some
disturbances that can arise in the distribution system
such as harmonics, excess or lack of reactive power,
overload, and short circuit. A short circuit event is
one of the events that cause quite serious damage. A
short circuit fault occurs because of connections
between parts that cannot be connected. This can
cause a very large current so that it can damage the
electrical equipment that is around the point of fault
that occurs. If a short circuit occurs, the current
value will increase very quickly and is far higher
than the nominal current. A short circuit can be
formulated like equation 1. IF is short circuit
current, VF is the voltage on the bus where the short
circuit occurs, and ZF is the impedance measured
from the location of the short circuit (Glover et al.,
2012) .
F
Z
F
V
F
I
(1)
2.3 Relay Setting
One of the protective equipment that is commonly
used is a relay. The relay will determine whether the
current that is read by the current transformer is the
fault current. If the detected fault current has passed
through the setting, the relay will give a command to
the CB to open the contact and separate the
disturbed area. The relay has two settings, namely
current and time. If both of these settings have been
met, the relay will operate. The relay operating time
must be correctly determined to ensure that when a
fault occurs, the relay does not trip before other
protective devices. In general, the relay can be set by
selecting two parameters, namely the current pick-up
or plug setting multiplier (PSM) and the operating
time or time setting multiplier (TMS; Gers and
Holmes, 2004) . The PSM settings of the relay can
be seen in equation (2).
CTR
nom
IOLF
PSM
(2)
OLF is an overload factor whose value is
determined based on the equipment being protected.
Then, Inom is the nominal line current, while CTR is
the primary side ratio of the current transformer
(CT) / tap primary. TMS adjusts the time delay (t1)
relay when operating whenever the fault current
exceeds the current pick-up setting. This TMS will
affect the value of the operating time of the relay. To
determine the value of the time dial, equation (3) can
be used.
TD.
1
SET
I
I
.
k
1
t
(3)
ICONIT 2019 - International Conference on Industrial Technology
214

I am current flow in the line circuit, ISET is
current relay setting, and the others are constant
from the chosen standards.
2.4 Arc Flash Analysis
High short circuit currents can cause the emergence
of high energy around the fault location. This large
energy is usually called the arc flash. Arc flash can
cause fire and even explosion because the arc flash
is heat energy and intense light at the point of the
arc. The phenomenon of an arc explosion which is a
combination of a conductor and the air around a hot
arc that evaporates, causing pressure, which often
causes the equipment or insulation material to
explode. The beginning of the arc flash appears due
to arcing fault. Arcing fault itself can be defined as
the flow of electric current flowing in a line that
should not have current flowing. The current creates
an electric arc plasma and releases a dangerous
amount of energy. For the system in which the
voltage under 1kV is using equation (4) and the
other using equation (5; IEEE, 2001; Plaines, 2005) .
)G(000526.0)V(0966.0Ilog662.0KIlog
Bfa
BfBf
Ilog)G(00304,0Ilog)V(5588,0
(4
)
Bf
Ilog983.000402.0
a
Ilog
(5
)
Equation Description:
I
a = arcin
g
faul
t
curren
t
(kA)
K
= -0,153 for open air arc, or -0,097 for
enclosed arc.
IBF =
b
olted faul
t
curren
t
(kA)
G = Conducto
r
Gap (mm)
After Ia obtained, calculate the normalized
incident energy using equation (6). Then calculate
the incident energy by using equation (7; IEEE,
2001) .
)G(000526.0G0011.0
a
Ilog081.1
2
K
1
K
n
Elog
(6)
x
x
nf
D
610
2.0
t
EC184.4E
(7)
Equation Description:
En = Normalized inciden
t
energy (cal/cm2)
E = Inciden
t
Energy (cal/cm2)
K1 = -0,792 fo
r
open ai
r
arc, o
r
-0,555 fo
r
enclosed arc.
K2
= 0 for ungrounded system, -0,113 for grounded
system.
t
= Arc durations (s)
= 1,0 for voltage above 1 kV, or
1,5 for voltage below 1 kV
D = Distance from the arc (mm)
x = Distance exponen
t
from IEEE 1584 standard
Table 1: Personal Protective Equipment Categories
Category Cal/cm2 Clothing
0 1.2 Untreated Cotton
1 4 Flame retardant (FR) shirt
an
d
FR
p
ants
2 8 Cotton underwear FR shirt
an
d
FR
p
ants
3 25 Cotton underwear FR shirt,
FR
p
ants, an
d
FR coveralls
4 40 Cotton underwear FR shirt,
FR pants, double layer
switchin
g
coat dan
p
ants
2.5 Determining Personal Protective
Equipment (Ppe) Categories
Arc flash hazard category can be determined based
on the energy that occurs. Flash hazard arcs are
categorized into five categories and can be seen in
Table 1. The hazard category will determine the
standard for using PPE that refers to the NFPA 70-E
standard. This standard will describe the PPE needed
by workers to work in areas that have the potential
for arc flash. The higher the hazard category, the
PPE recommendation will be more complete, closed,
and safe when used by workers. The highest energy
level of the standard is 40 cal / cm2, and if the
energy that occurs is more than that, then the danger
that arises is very dangerous (NFPA, 2003) .
2.6 Zone Selective Interlocking Method
Protection systems using relays have been
developed, and one of them uses a protection zone.
Zone Selective Interlocking (ZSI) is a
communication scheme used with electronic trip
units and electronic protective relays for circuit
breakers to increase the level of protection in power
distribution systems. Zones are classified according
to their location downstream of the main circuit
protection devices, which are generally defined as
zone 1.
The system will be made into several protection
zones. As an illustration, the power system has 3
zones in series connected from zone 3 to 1. If using
normal relay coordination, when interference occurs
in zone 3, CB in zone 3 will trip, then CB in zone 2
will trip and continue to zone 1. This will disrupt
services in zones 2 and 1. ZSI allows interference to
be eliminated by using CB in its protection zone
without disturbing others (Simms and Johnson,
2013; Walker, 2013; Hodgson and D. Shipp, 2010;
Glover et al., 2012)
Arc Flash and ZSI Analysis for Personal and Equipment Protection in Distribution System
215
3 SIMULATION AND ANALYSIS
This research began by collecting data from the
distribution system. The simulation is done using
ETAP software. The data that has been generated
will be used as a parameter in the simulation. Some
of the simulations performed are power flow
simulation, short circuit simulation, then OCR, and
GFR coordination simulation. OCR and GFR
simulations are carried out using the ZSI method in
it. Next, the simulation results are used as
parameters to determine the arc flash energy.
Finally, from the calculation results, the level of PPE
must be determined. The explanation of each step
will be explained as follows.
Table 2: The Result of Load Flow and Short Circuit
Simulation
Bus ID IFL (A)
I Max I Min.
ISC3φ
(
kA
)
ISC1φ
(
kA
)
ISC2φ (kA)
Bus 1 4.2 2.117 0.987 1.169
Bus 2 1.3 2.126 0.989 1.172
Bus 3 5.5 2.129 0.99 1.173
Bus 4 10.2 2.149 0.996 1.179
Bus 5 85.7 2.152 0.997 1.18
Bus 6 12.6 2.167 1.001 1.185
Bus 7 18.5 2.199 1.01 1.196
Bus 8 39.8 2.208 1.012 1.199
Bus 9 21.3 2.202 1.011 1.197
Bus 10 13.9 2.185 1.006 1.191
Bus 11 8.5 2.173 1.002 1.187
Bus 12 5.4 2.173 1.002 1.187
Bus 13 46.6 2.216 1.015 1.202
Bus 14 4.2 2.213 1.014 1.201
Bus 15 49 2.225 1.017 1.205
Bus 16 54.1 2.241 1.022 1.211
Bus 17 95.1 2.309 1.043 1.238
Bus 18 119.1 2.316 1.045 1.241
Bus 19 24 2.304 1.042 1.237
Bus 20 21 2.289 1.037 1.232
Bus 21 135 2.358 1.06 1.262
Bus 22 177.4 2.363 1.061 1.264
Bus 23 42.3 2.36 1.06 1.263
Bus 24 37.8 2.35 1.058 1.26
Bus 25 35.7 2.347 1.057 1.259
Bus 26 256.8 2.364 1.062 1.265
Bus 27 79.4 2.344 1.055 1.257
Bus 28 44.8 2.338 1.054 1.254
Bus 29 39 2.326 1.05 1.25
Bus 30 22.1 2.273 1.035 1.232
Bus 31 13.9 2.225 1.022 1.216
Bus 32 262.5 2.373 1.068 1.276
Bus 33 288 2.455 1.137 1.403
3.1 Power Flow Simulation
In the initial stage, the system will be modeled
according to real conditions based on data that has
been obtained at the data collection stage using
ETAP software. Data needed include voltage,
power, and impedance of each piece of equipment.
The next step is the simulation of power flow.
This simulation is done as a reference that the
system is running in good condition. So it can be
seen that the flow of power from the source to load
can be distributed normally. The power flow
1
2
3
4
5
6
7
8
9
10
11
12
13
14
15
16
17
18
19
20
21
22
23
24
25
26
27
28
29
30
31
32
33
L1
T1
T2
L2
T4
L4
T5
L5
T7
L7
T14
L14
T15
L15
L11
T11
T33
L33
T32_1
L32_1
L32_2
T32_2
T25
L25
L24
T24
T23
L23
T16
L16
T20_1
L20_1
L20_2
T20_2
T17
L17
L19
T19
T21
L21
L30
T30
T31
L31
T29_1
T29_2
L29_1
L29_2
T28
L28
L27T27
Zona 1
Zona 3
Zona 2
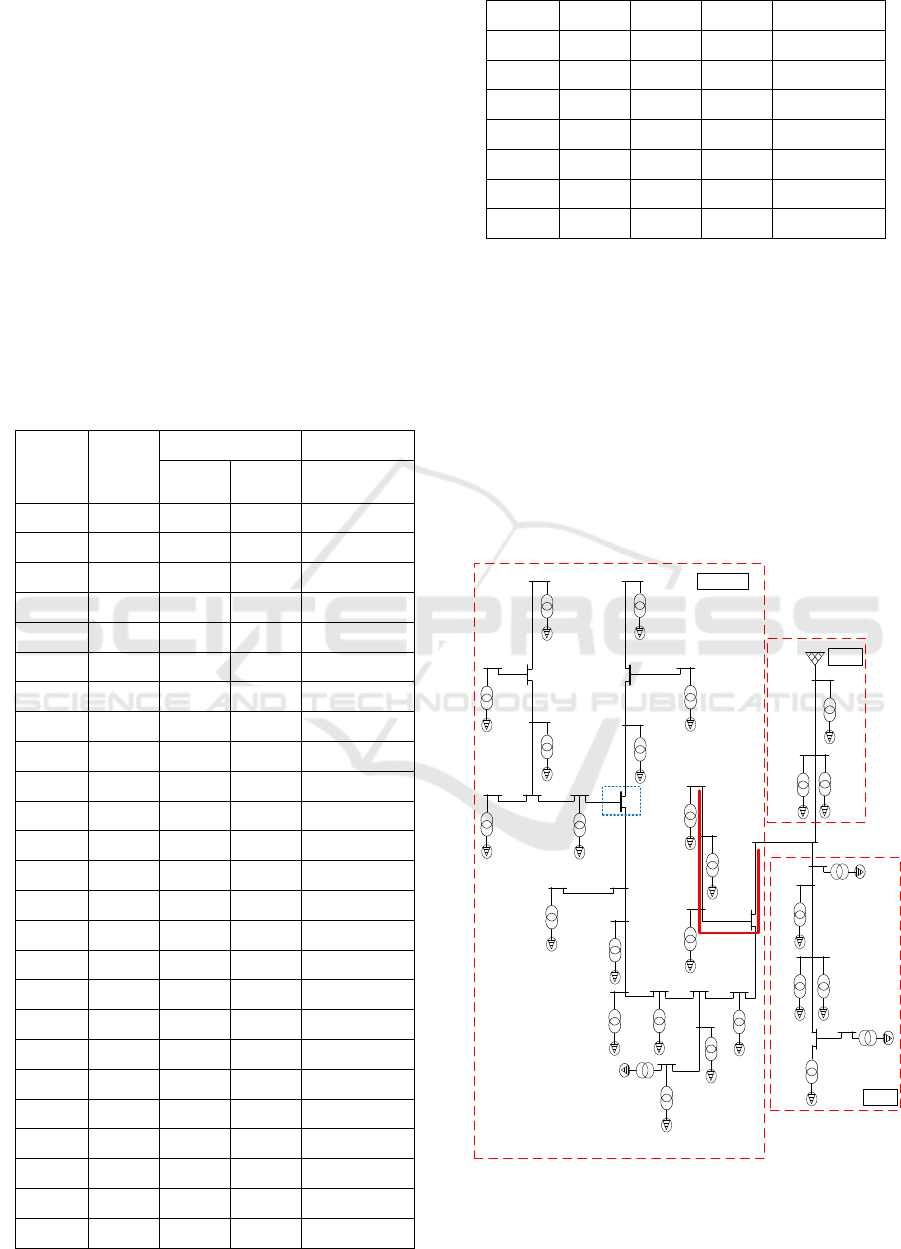
Figure 1: Distribution System
ICONIT 2019 - International Conference on Industrial Technology
216
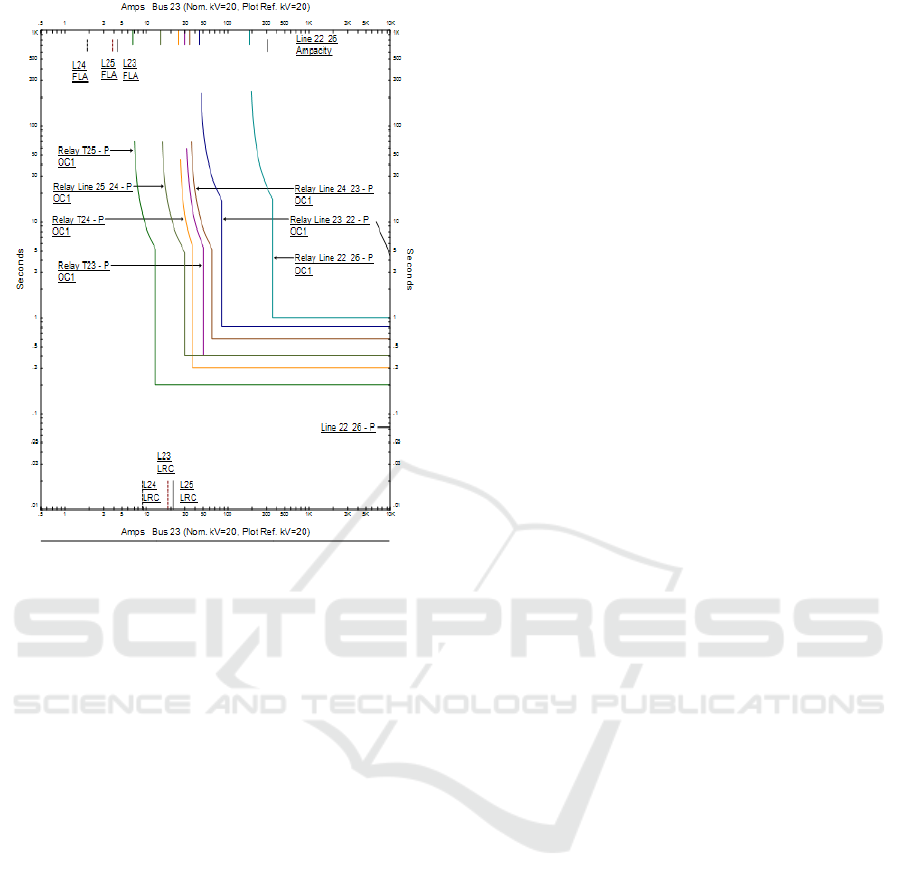
Figure 2: Relay Coordination
The Simulation will also get a full load current
(IFL), which will be used for OCR and GFR
settings. Besides, power flow simulation is also
carried out to determine the value of voltage, power,
and full load current on each bus at the steady-state
condition. Power flow simulation is done by Newton
Raphson Modification Method.
3.2 Short Circuit Simulation
The Inom of equation (2) can come from overload or
short circuit fault, so the next simulation is a short
circuit simulation. The calculated short-circuit
current is a maximum 3-phase short circuit, a
minimum of 2 phases, and a maximum of 1 phase to
ground. A maximum of 3 phase short circuit and
minimum 2 phase will be used for OCR settings,
which will overcome the overload and phase short
circuit. While phase to ground short circuit will be
obtained from a single-phase short circuit simulation
and then become a parameter for setting GFR. The
short circuit current obtained is presented in Table 2.
3.3 OCR and GFR Coordination using
ZSI Method
Relays installed in each primary part of the
transformer are 35 relays and 31 relays in the line.
Each relay will be equipped with a current
transformer to read the value of the current flowing
in the line or equipment. Besides, the relay also has
a CB that will open if it gets a trigger from the relay.
The system configuration can be seen in Figure 1.
Short circuit data previously used to determine
the current and time settings of the protection relay.
OCR will be used to protect equipment from
overload current and short circuit 3 phase, two-
phase, or interphase. For overload disturbances, the
current setting uses equation (2), and the time setting
uses equation (3). While for a short circuit, the
current setting also uses equation (2), but the time
setting is set by itself. This time setting must be
coordinated between relays. The time interval
between relays must be between 0.2 - 0.4 seconds.
The shortest time is placed in the load, and the value
increases if it approaches the source.
Single-phase disturbance to the ground is
protected using GFR. This relay also has two
settings, namely the current based on equation (2)
and the time setting determined based on the
coordination between relays. The time between
relays must also be between 0.2 - 0.4 seconds. GFR
relay coordination is carried out at one voltage level,
so at different voltage levels, the coordination used
is also different. Relay current settings are
determined based on single-phase fault current to the
ground and special charging lines for relays in the
line.
Figure 2 shows the current-time curve against the
OCR relay for L25 to Bus26 loads (marked with a
thick red line in Figure 1). There are seven relays
connected between the two devices, namely Relay
T25, Relay Line 25_24, Relay T24, Relay Line
24_23, Relay T23, Relay Line 23_22, and Relay
Line 22_26. For other equipment, settings are done
in the same way.
Based on Figure 2, two curves are combined into
one, firstly the curve for overload disturbance is in
the form of an inverse and the curve for a short
circuit which is in a vertical straight line. Horizontal
lines indicate the time delay of the relay for short
circuit fault with a fixed value. If the fault current
meets the current setting of the relay, the relay will
give a signal to the CB after the delay time is met.
While the time for overload depends more on the
amount of overload current, the greater the current
that appears, the faster the relay's working time. The
x-axis represents the amount of current, and the y-
axis represents the amount of time.
Arc Flash and ZSI Analysis for Personal and Equipment Protection in Distribution System
217
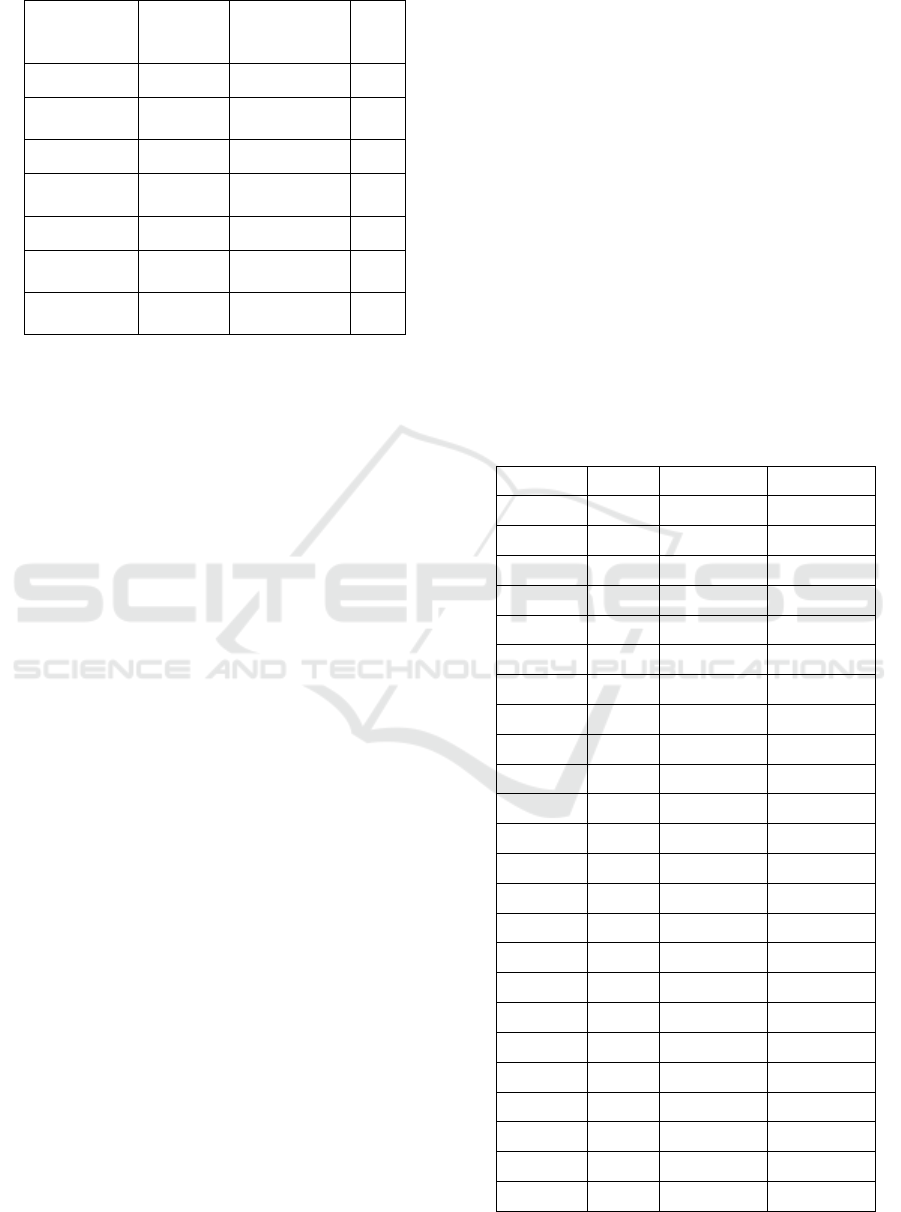
Table 3: Relay Setting of Figure 2
Relay
ISET for
overload
(
A
)
ISET for SC
(A)
t (s)
Relay T25 2 2032.502 0.2
Relay Line
25
_
24
4 2035.1 0.4
Relay T24 18 2035.1 0.3
Relay Line
24_23
28 2043.76 0.6
Relay T23 46 2043.76 0.4
Relay Line
23
_
22
GH 2046.358 1
Relay Line
22_26
56 2047.224 1.4
Besides, the relay current setting must be higher
than the inrush current transformer or be located
behind the relay curve. This shows that a high
starting transformer current will not make the relay
works. But if the high current can cause damage to
the transformer, the relay will work. Each equipment
has a damage curve that states the equipment
insulation resistance, and relay settings must be
made before the damage curve so that the relay can
work before the equipment insulation is damaged.
After all parts of the system have been secured
using a relay, then the ZSI method is added. The
system is divided into 3 zones, as in Figure 1. If
there is a disturbance in one zone, then the other
zone must not experience a trip too. The fault that
occurs at load L23 will cause Relay T23 to work,
followed by Relay Line 23_22 and Relay Line
22_26. After the Relay Line 22_26 causes a trip, no
CB can trip again due to the relay. This is because
the last Relay in the same zone as the L23 load is the
Relay Line 22_26. Trip events on Relay Line 22_26
will lock Relay Line 26_28 and Relay 26_27 to
remain open. This also applies to interference in
other zones. Relay settings can be seen in Table 3.
ZSI is also enforced in one zone as in Bus 8
(blue dotted line in Figure 1). The area from Bus 1
to Bus 7 will be zone 1a, and the area of Bus 9 to
Bus 11 will be zone 1b. Because CB that can trip is
limited, it must be well ensured that the relay can
detect interference as soon as possible and work
effectively to eliminate fault so that it does not
spread and trigger other relays to work.
3.4 Arc Flash Analysis and PPE
Categories
Arc flash analysis is done by calculating the amount
of energy that appears when the arc flash occurs. By
using the current arc value in equation (5), a
normalized event energy value (En) can be
calculated using equation (6). Finally, the event
energy (E) is solved using equation (7). The time
setting of the Relay plus the operating time of the
CB will be the parameter of the arc flash time
duration. The longer the arc flash event, the higher
the arc flash energy that appears. Other parameters,
such as the values of K, G, D, and x, adjust the real
situation.
The results of incident energy will be used as a
reference in determining PPE requirements based on
Table 1. The energy incident and PPE level settings
can be seen in Table 4.
Table 4: The Result of Arc Flash Analysis
ID Bus t (s) E (cal/cm2) Level PPE
Bus 1 0.5 1.195761 0
Bus 2 0.5 1.201164 1
Bus 3 0.7 1.684151 1
Bus 4 0.9 2.186959 1
Bus 5 0.7 1.703491 1
Bus 6 1.1 2.696746 1
Bus 7 1.3 3.237097 1
Bus 8 1.3 3.251178 1
Bus 9 1.1 2.743053 1
Bus 10 0.9 2.225909 1
Bus 11 0.5 1.229401 1
Bus 12 0.5 1.229401 1
Bus 13 1.5 3.765803 1
Bus 14 1.5 3.760386 1
Bus 15 1.5 3.782058 1
Bus 16 1.5 3.810964 1
Bus 17 1.5 3.93396 1
Bus 18 1.5 3.946634 1
Bus 19 1.1 2.878266 1
Bus 20 0.7 1.818955 1
Bus 21 1.5 4.02273 2
Bus 22 1.5 4.031795 2
Bus 23 1.1 2.952661 1
Bus 24 0.7 1.870507 1
ICONIT 2019 - International Conference on Industrial Technology
218

Bus 25 0.5 1.334264 1
Bus 26 1.5 4.033608 2
Bus 27 1.5 3.997355 1
Bus 28 1.3 3.454952 1
Bus 29 1.1 2.907479 1
Bus 30 0.7 1.805447 1
Bus 31 0.5 1.260686 1
Bus 32 1.7 4.589918 2
Bus 33 1.7 4.758638 2
4 CONCLUSION
The distribution system requires a protection system
because of the location of the distribution system
that is connected to many loads will increase the risk
of interference. Relays can be added to the
distribution system as protective equipment. Relays
are equipped with supporting equipment such as CT
and CB. Relay settings need to be coordinated so
that there are no trip errors, and disturbances can be
isolated immediately. ZSI method is added to the
relay coordination to minimize the number of CB
that trip. ZSI divides the distribution system into 3
zones where a disturbance in one zone will not affect
the other zones. After relaying the coordination with
ZSI, the relay will work time, which is the duration
of the short circuit before the CB trip. During the
duration of this short circuit, there is energy released
due to high currents or known as arc flash. Arc flash
is very dangerous not only for equipment but also
for workers. By knowing the value of energy
released during short circuit events, the protective
clothing that workers must use can also be
determined. From the distribution system analyzed,
it is known that the highest PPE level is level 2.
ACKNOWLEDGMENT
This research was financially supported by the
Institute for Research and Community Service of
Kalimantan Institute of Technology through grant
809/IT10.R/PN.08/2019.
REFERENCES
T. B. Dugan, Reducing The Flash Hazard: Methods to
protect workers from the devastating effects of arc
flash, IEEE Industry Applications Magazine, May-June
2007
D. R. Doan, J. K. Slivka, and C. J. Bohrer, A Summary of
Arc Flash Hazard Assessments and Safety Improvements,
IEEE Transactions On Industry Applications, Vol. 45, No.
4, July/August 2009
J. Simms and G. Johnson, Protective Relaying Methods
for Reducing Arc Flash Energy, IEEE Transactions On
Industry Applications, Vol. 49, No. 2, March/April
2013
J. Ma, X. Xiang, R. Zhang, et al, Regional protection
scheme for distribution network based on logical
information, IET Generation, Transmission &
Distribution, Vol. 11, 2017
S. Shen, H. Wang, K. Jiang, et al, Regional Area
Protection Scheme for Modern Distribution System,
IEEE Transactions on Smart Grid, Vol 10, 2019
M. Kanabar, V. Muthukrishnan, D. Patel, et al, Integrated
asset monitoring, personnel safety, and reliability with
next generation protection relays for distribution
networks, The Instution of Engineering and
Technology, 2017
IEEE Std 1584-2002, “IEEE Guide for Performing Arc-
Flash Hazard Calculation”, The Institute of Electrical
and electronics Engineers, Inc., New York, Ch. 15,
2001
D. R. Doan and R. A. Swiegart, A Summary of Arc-Flash
Energy Calculations, IEEE Transactions On Industry
Applications, Vol. 39, No. 4, July/August 2003
T. Papallo, Arc Flash Calculations Using a Physics-Based
Circuit Model, IEEE Transactions On Industry
Applications, Vol. 48, No. 4, July/August 2012
T. A. Short and M. L. Eblen, Medium-Voltage Arc Flash
in Open Air and Padmounted Equipment, IEEE
Transactions On Industry Applications, Vol. 48, No. 1,
January/February 2012
G. D. Gregory and K. J. Lippert, Applying Low-Voltage
Circuit Breakers to Limit Arc-Flash Energy, IEEE
Transactions On Industry Applications, Vol.48, No. 4,
July/August 2012
J. P. Nelson, J. D. Billman and J. E. Bowen, The Effects of
System Grounding, Bus Insulation, and Probability on
Arc Flash Hazard Reduction—The Missing Links,
IEEE Transactions On Industry Applications, Vol. 50,
No. 5, September/October 2014
H. Hoagland, Arc-Flash PPE Research Update, IEEE
Transactions On Industry Applications, Vol. 49, No. 3,
May/June 2013
M. E. Valdes and J. J. Dougherty, Advances in Protective
Device Interlocking for Improved Protection and
Selectivity, IEEE Transactions On Industry
Applications, Vol. 49, No. 3, May/June 2014
M. D’Mello, M. Noonan, M. E. Valdes, J. Benavides Arc
Flash Hazard Reduction at Incoming Terminals of LV
Equipment, IEEE Transactions On Industry
Applications, Vol. 52, No. 1, January/February 2016
C. G. Walker, Arc-Flash Energy Reduction Techniques:
Zone-Selective Interlocking and Energy-Reducing
Maintenance Switching, IEEE Transactions On
Arc Flash and ZSI Analysis for Personal and Equipment Protection in Distribution System
219

Industry Applications, Vol. 49, No. 2, March/April
2013
D. L. Hodgson and D. Shipp, Arc-Flash Incident Energy
Reduction Using Zone Selective Interlocking, IEEE
Transactions On Industry Applications, Vol. 46, No. 3,
May/June 2010
J. D. Glover, M. S. Sarma, and T. J. Overbye, Power
System Analysis and Design 5th Edition, Cengage
Learning, USA, 2012
J. M. Gers and E. J. Holmes, IET Power and Energy Series
47 - Protection of Electricity Distribution Networks
2nd Edition, The Institution of Electrical Engineers,
London, 2004
D. Plaines, IL , Understanding and Reducing Arc Flash
Hazards, Littelfuse POWR-GARD Products, 2005
NFPA 70E., “Electrical Safety Requirements for
Employee Workplaces 2003 Edition”, NFPA 70E-
2003.
ICONIT 2019 - International Conference on Industrial Technology
220
