
The Relationship between Energy, Nutrition, and Dietary Fiber
Intake with the Nutritional Status of Down Syndrome Children
Lusi Anindia Rahmawati
1
, Sri Anna Marliyati
2
and Ikeu Ekayanti
2
1
Department of Nutrition, Faculty of Science and Technology, Universitas Al-Azhar, Indonesia
2
Department of Community Nutrition, Faculty of Human Ecology, IPB University, Indonesia
Keywords: Down Syndrome, Intake, Nutritional Status.
Abstract: Down syndrome is one of the disability conditions that can reduce productivity especially if coming with
nutritional problems. Overweight is a nutritional problem that often occurs on Down Syndrome children.
This research was aimed to understand the relationship between energy, nutrition, and fiber intake and the
nutritional status of Down syndrome children. The design of this study was a cross-sectional study. As
many as 50 samples were selected using purposive sampling from five extraordinary schools in Magetan
East Java. Structured interviews and a 2x24 hour recall questionnaire were conducted with mothers of
Down Syndrome children. According to the z-score of BMI for age, 40.0% of children in this study were
overweight and obese, 52.0% was normal, and 8.0% was found to have thin and severely thin nutritional
status. Based on the bivariate analysis, energy intake, carbohydrate intake, and fiber intake were not
significantly associated with the nutritional status of children with Down syndrome (p>0.05). Protein intake
(p=0.018) and fat intake (p=0.027) were significantly associated with the nutritional status of children with
Down syndrome.
1 INTRODUCTION
Disability is one of the conditions that may reduce
productivity. Down syndrome is one of the disability
due to a genetic disorder that occurs during fetal
growth (on chromosome 21/trisomy 21). The
symptoms might greatly vary, from mild to severe
that was mental retardation with the IQ level of less
than 70, facial profile (Mongoloid), and typical palm
line (simian crease) (Ministry of Health, 2013).
The global number of patients with Down
syndrome indicated an increased trend of 30% in
1979-2003 (Shin et al., 2009). According to the data
of Basic Health Research, the percentage of children
with Down syndrome increased from 0.12 in 2010
to0.13 in 2013 (Ministry of Health, 2013).
Furthermore, data of the National Socio-economic
Survey 2003 issued by the Central Bureau of
Statistics 2003 indicated that East Java had the most
patients with mental retardation in Indonesia with 17
550 patients with Down syndrome (Central Bureau
of Statistics, 2003). The high prevalence requires
special attention to improve their life quality.
Nutritional status is one of the factors affecting
an individual life quality. The study that was
conducted by Nursilmi et al. (2017) showed that
there is a positive correlation between nutritional
status and the life quality of physical health and the
environment. The better the nutritional status, the
better the individual life quality. Overweight is a
nutritional problem that often occurs in children with
Down syndrome. The study that was held by
Oosterom et al. (2012) showed that children with
Down syndrome are more potential for suffering
from overweight and obesity than other children. In
addition to that, based on Marin and Graupera
(2011), most children with Down syndrome have
both overweight and obese nutritional status.
Overnutrition on children with Down syndrome
shall be prevented as it may deteriorate their health.
Besides, overweight and obesity suffered by children
with Down syndrome will restrict their opportunities
to participate in social, recreational, and sports
activities significantly contributing to their physical
and emotional development (Marin and Graupera,
2011).
Factors directly influencing nutritional status are
food intake and infection (Supariasa et al., 2002).
Yulni (2013) in her study on elementary school
children found a correlation between energy intake
346
Rahmawati, L., Marliyati, S. and Ekayanti, I.
The Relationship between Energy, Nutrition, and Dietary Fiber Intake with the Nutritional Status of Down Syndrome Children.
DOI: 10.5220/0009768703460350
In Proceedings of the 1st International Conference on Health (ICOH 2019), pages 346-350
ISBN: 978-989-758-454-1
Copyright
c
2020 by SCITEPRESS – Science and Technology Publications, Lda. All rights reserved
and carbohydrate and nutritional status. Based on the
studies above, we are interested in the correlation
between nutrient intake and nutritional status on
children with Down syndrome. The research is
conducted to examine the correlation between
energy, nutrition, and dietary fiber intake with the
nutritional status of Down syndrome children.
2 MATERIALS AND METHODS
2.1 Study Design and Subjects
The research used a cross-sectional study design and
conducted in April-June 2015. The research subjects
were 50 students with Down syndrome from five
extraordinary schools in Magetan. They were
selected using purposive sampling and based on
inclusion criteria i.e. 1) aged 6-8 years old, 2) having
no chronic disease, 3) currently living with their
biological mothers, and 4) with mothers willing to
participate in the research.
2.2 Data Collection and Analysis
Data collected comprised of characteristics,
nutritional status, and nutrient intake of subjects.
Data collection of the subject characteristics were
conducted through structural interviews using
questionnaires with mothers of Down Syndrome
children. Nutritional status data were gathered using
an anthropometric measurement of body weight and
body height. Bodyweight was measured using a
body scale; while body height was measured using a
microtome. Nutrient intake data were collected
through interviews with the mothers of Down
Syndrome children using 2×24 recall questionnaires.
Data collected were analyzed using SPSS for
Windows verse 16. Univariate analysis was
conducted to investigate the distribution of each
variable. To observe the correlation between energy,
nutrition, and fiber intake and nutritional status of
the subjects, we conducted Spearman correlation
test. The odds ratio was calculated based on the 95%
confidence interval (CI).
3 RESULTS
3.1 Characteristics of Subjects
From 50 subjects, 33 (66.0%) were males and 17
(34.0%) were females. Distribution of the subject
age was 29 (58.05) subjects aged ≤12 years old, 21
(42.0%) others were aged >12 years old.
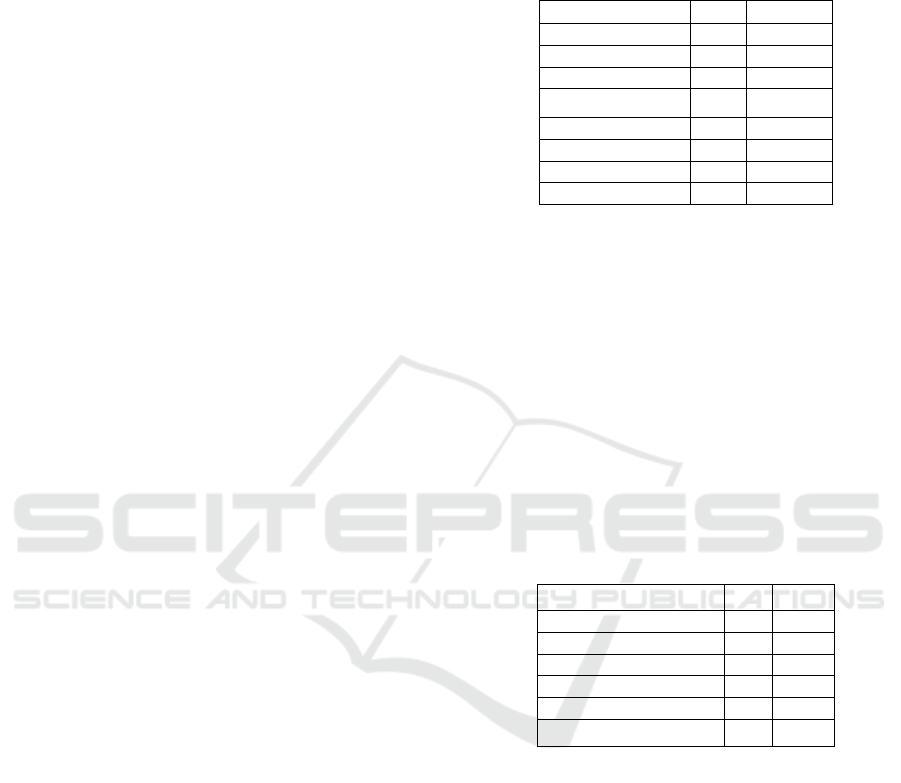
Table 1: Distribution of the characteristics of subjects.
Characteristics n %
Sex
Male 33 66.0
Female 17 34.0
Total 50 100.0
Age
≤ 12 years old 29 58.0
> 12 years old 21 42.0
Total 50 100.0
3.2 Nutritional Status of Subjects
Nutritional status was categorized based on Body
Mass Index in accordance with age (BMI for Age)
for children aged 5-18 years old (Ministry of Health,
2011). More than half of the subjects had a normal
nutritional status (n = 26). 11 subjects (22.0%) had
an overweight nutritional status, and 9 (19.0%)
subjects had an obese nutritional status. Of the total
subjects, 2 (4.0%) subjects had a severely thin
nutritional status, and 2 (4.0%) other subjects had a
thin nutritional status.
Table 2: Distribution of the nutritional status of subjects
based on BMI for Age.
Nutritional Status n
%
Severel
y
thin 2 4.0
Thin 2 4.0
Normal 26 52.0
Overwei
g
ht 11 22.0
Obese 9 18.0
Total 50 100.0
3.3 Energy, Nutrition, and Dietary
Fiber Intake
Energy, nutrition, and dietary fiber intake of subjects
were categorized based on the adequacy level. The
mean of energy intake of subjects was 1,900 kcal.
Most subjects (42.0%) had the energy adequacy
level categorized as excessive (≥ 120% RDA),
34.0% had the energy adequacy level categorized as
deficit (< 90% RDA), and 24.0% had the energy
adequacy level categorized as normal (90-119%
RDA).
Protein adequacy level was normal when in the
range of 90.0-119.0% of Recommended Dietary
Allowance (Gibson, 2005). The mean of protein
intake of the research subjects was 54 grams. Of 50
The Relationship between Energy, Nutrition, and Dietary Fiber Intake with the Nutritional Status of Down Syndrome Children
347
subjects, 10 (20%) had a protein adequacy level
categorized as normal; while 40 others had a protein
adequacy level categorized as deficit and excessive
(20 subjects for each).
The recommended total fat intake for children
aged 4-18 years old was 25.0-35.0% of calories for
children (Hardinsyah et al., 2014). Of 50 subjects, 8
(16%) had a fat adequacy level categorized as
normal. 42 others had a fat adequacy level
categorized as deficit and excessive (22 and 20
subjects for each, respectively). The mean fat intake
of the subjects was 60.7 grams.
The recommended carbohydrate intake for
children aged 4-18 years old was 45.0-65.0% of
calories for children (Hardinsyah et al., 2014). The
mean carbohydrate intake of the subjects was 414.9
gram. Most of the subjects (64.0%) had an excessive
carbohydrate adequacy level. 28.0% of subjects had
a carbohydrate adequacy level categorized as
normal; while 8.0% others had a carbohydrate
adequacy level categorized as a deficit.
The recommended amount of fiber intake to
prevent obesity and non-infectious diseases was 25
g/day (Perkeni, 2011). All research subjects (100.0%)
had fiber intake categorized as inadequate. The mean
of fiber intake of the subjects was 6.0 g/day.
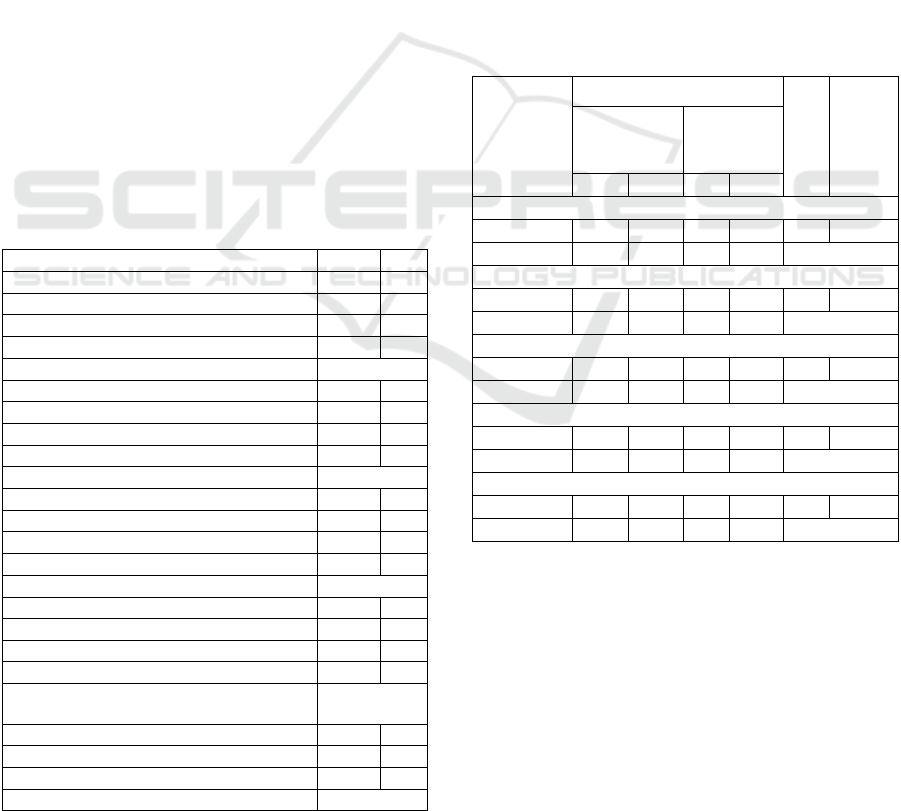
Table 3: Distribution of subjects based on the level of
energy, nutrition, and dietary fiber adequacy.
Variable n
%
Ener
gy
Deficit
(
< 90% RDA
)
17 34.0
N
ormal
(
90-119% RDA
)
12 24.0
Excessive
(
≥
120% RDA
)
21 42.0
The mean of ener
gy
intake ± sd
(
kcal
)
1900 ± 572
Protein
Deficit
(
< 90% RDA
)
20 40.0
N
ormal
(
90-119% RDA
)
10 20.0
Excessive
(
≥
120% RDA
)
20 40.0
The mean of
p
rotein intake ± sd
(g
ram
)
54 ± 20.3
Fat
Deficit
(
< 25% of calories
)
22 44.0
N
ormal
(
25
–
35% of calories
)
8 16.0
Excessive
(
> 35% of calories
)
20 40.0
The mean of fat intake ± sd
(g
ram
)
60.7 ± 28.9
Carboh
y
drate
Deficit
(
< 45% of calories
)
48.0
N
ormal
(
45
–
65% of calories
)
14 28.0
Excessive
(
> 65% of calories
)
32
The mean of carbohydrate intake ± sd
(g
ram
)
414.9 ± 243.7
Fibe
r
Inade
q
uate
(
< 25
g)
50 100.
Ade
q
uate
(
≥
25
g)
00.0
The mean of fiber intake ± sd
(g
ram
)
6.0 ± 3.5
3.4 Correlation between Energy,
Nutrition, and Dietary Fiber Intake
with the Nutritional Status of
Subjects
Referring to Spearman correlation analysis, the
protein and fat intake variables significantly related
to overweight and obese nutritional status on the
subjects (p < 0.05). Subjects with excessive protein
intake (≥ 120% RDA) were potential for obesity 4.1
higher than subjects with adequate protein intake (<
120% RDA). Similarly, subjects with excessive fat
intake (≥ 25% of calories) were potential for obesity
3.9 higher than subjects with adequate protein
intake (< 25% of calories). However, energy,
carbohydrate, and dietary fiber intake did not
significantly relate to the nutritional status of the
research subjects.
Table 4: Correlation between energy, nutrition, and dietary
fiber intake with the nutritional status of subjects.
Variable
Nutritional Status
OR
p
Overweight/
obese
(n=20)
Normal/
thin
(n=30)
n
%
n
%
Energy
Excessive 11 52.4 10 47.6 2.4 0.128
Adequate 9 31.0 20 69.0 CI : 0.76-
Protein
Excessive 12 60.0 8 40.0 4.1 0.018*
Adequate 8 26.7 22 73.3 CI: 1.24-
Fat
Excessive 15 53.6 13 46.4 3.9 0.027*
Adequate 5 22.7 17 77.3 CI: 1.13-
Carbohydrate
Excessive 14 43.7 18 56.3 1.6 0.470
Adequate 6 33.3 12 66.7 CI : 0.47-
Fiber
Excessive 9 31.0 20 69.0 0.4 0.128
Adequate 11 52.4 10 47.6 CI : 0.13-
4 DISCUSSION
Although more than half of subjects evidently had a
normal nutritional status, subjects with overweight
and obese nutritional status also came in a high
number. It was in accordance with other studies on
Down syndrome (Koniuszy and Kunowski, 2013;
Marin and Graupera, 2011). According to National
Food Service Management Institute (2006),
overweight was one of the nutritional problems
ICOH 2019 - 1st International Conference on Health
348

majorly suffered by school-age children with Down
syndrome. The nutritional problem should be
prevented to improve their health condition.
In this study energy, nutrition, and dietary fiber
intake of children with Down syndrome indicated an
imbalanced result. Of the total subjects, few had the
recommended energy, protein, fat, and carbohydrate
intake. Even no subject had met the recommended
fiber intake.
Children with Down syndrome tended to
excessively consume food. When interviewed,
several parents complained about their children’s
non-stop eating habits before all of the food was
eaten (especially snack eating). It triggered
excessive energy, protein, and carbohydrate intake
in most children with Down syndrome. It was in line
with Samour and King (2012) study that children
with Down syndrome tended to have higher food
intake than Dietary Reference Intake (DRI).
Furthermore, another study also indicated that
carbohydrate intake of children with Down
syndrome was considered high (Grammatikopoulou
et al., 2008).
All subjects had fiber intake categorized as
inadequate. Various studies on children with Down
syndrome gave a similar result. Almost all children
with Down syndrome had inadequate fiber intake
(Marin and Graupera, 2011; Koniuszy and
Kunowski, 2013; Samarkandy et al., 2012).
Achieving the recommended fiber consumption was
difficult for children with Down syndrome. A study
that was held by Mahan and Stump (2008) showed
that it was due to swallowing and chewing ability
delays in their preschool age. The delays
consequently restricted parents to give various types
of food, especially vegetables.
Disproportional energy, nutrient, and fiber intake
in most subjects were probably due to imbalanced
daily meals. It was supported by the previous study
concluding that daily meals of children with Down
syndrome were imbalanced in terms of energy and
nutrition (Koniuszy and Kunowski, 2013).
Food intake was one of the factors directly
affecting an individual nutritional status. We found
that protein and fat intake significantly correlated
with nutritional status of children with Down
syndrome (p > 0.05). In this study, the odds of being
overweight and obesity in Down syndrome children
with excessive protein intake was 4.1 (95% CI:1.24-
13.78). It suited the study of Del-Mar et al. (2015).
Another study also confirmed that total protein and
high animal protein intake could improve body
weight and IMT (Rolland-Cachera et al., 2004;
Hermanussen, 2008). Some other studies correlated
animal protein intake with obese nutritional status
(Lin et al., 2015; Wang and Beydoun, 2009).
According to the studies, animal protein intake,
especially meat and processed products triggered
high fat intake, saturated fat, and total calorie and
reduced vegetable consumption (Nicklas et al.,
1995).
Several studies indicated a significant correlation
between fat intake and nutritional status (Saker et
al., 2011; Mc Gloin et al., 2002). We figured out that
the odds of being overweight and obese in Down
syndrome children with excessive fat intake was 3.9
(95% CI:1.13-13.60). Bray et al. (2004) declared
that high fat intake might indirectly increase
overweight and obesity risks by increasing energy
density and thus excessive energy intake.
Even though we could not find the correlation
between energy, carbohydrate, and dietary fiber
intake with nutritional status of Down syndrome
children, most children with Down syndrome tended
to not have the recommended energy, nutrient, and
fiber intake. Therefore, efforts to improve the
condition should be made, optimizing health
condition of Down syndrome children.
5 CONCLUSION
In conclusion, in this study, the percentage of
children with Down syndrome and overweight and
obese nutritional status was 40%. Children with
Down syndrome with excessive protein and fat
intake were more potential for obesity. In general,
most children with Down syndrome tended to not
have the recommended energy, nutrition, and fiber
intake. Therefore, efforts to improve the condition
shall be made, optimizing the health condition of
Down syndrome children.
ACKNOWLEDGMENTS
The publication of this research was funded by
International Seminar Grant LP2M Universitas Al
Azhar Indonesia.
REFERENCES
[Ministry of Health] Ministry of Health of the Republic of
Indonesia, 2011. Decree of the minister of health of
the republic of Indonesia on anthropometric standards
The Relationship between Energy, Nutrition, and Dietary Fiber Intake with the Nutritional Status of Down Syndrome Children
349

to assess the nutritional status of children. Jakarta,
Ministry of Health of the Republic of Indonesia.
[Ministry of Health] Ministry of Healthof the Republic of
Indonesia, 2013. Basic Health Research 2013. Jakarta,
Ministry of Health of the Republic of Indonesia.
[NFSMI] National Food Service Management Institute,
2006. Handbook for Children with Special Food and
Nutrition Needs. Oxford, The University of
Mississippi.
[PERKENI] Perkumpulan Endokrinologi Indonesia, 2011.
Konsensus Pengelolaan dan Pencegahan Diabetes
Mellitus Tipe 2 di Indonesia. Jakarta, Perkeni.
Bray, G.A., Paeratakul, S., Popkin, B.M., 2004. Dietary fat
and obesity: a review of animal, clinical and
epidemiological studies. PhysiolBehav. 83: 549 – 555.
Central Bureau of Statistics, 2003. Result of National
Socio-economic Survey 2003. Jakarta, Central Bureau
of Statistics; 2003.
Del-Mar, B.M., Tur, J.A., Morandi, A., Tommasi, M.,
Tomasselli, F., Maffeis, C., 2015. Protein intake as a
risk factor of overweight/obesity in 8-to-12 years old
children. Medicine (Baltimore). 94(52): e2408.
Grammatikopoulou, M.G., Manai, A., Tsigga, M.,
Fachantidou, A.T., Tsinopoulou, A.G., Zakas, A.,
2008. Nutrient intake and anthropometry in children
and adolescents with Down Syndrome-a preliminary
study. Dev Neurorehab. 11(4): 260 – 267.
Hardinsyah, Riyadi, H., Napitupulu, V., 2014. Kecukupan
energi, protein, lemak dan karbohidrat. In Angka
Kecukupan Gizi yang Dianjurkan bagi Bangsa
Indonesia. Jakarta, Kemenkes.
Hermanussen, M., 2008. Nutritional protein intake is
associated with body mass index in young adolescents.
Georgian Med News. 156(156):84 – 88.
Koniuszy, Z.G., Kunowski, M., 2013. Glycemic Index and
Glycemic Load of diets in children and young people
with Down Syndrome. Acta Sci. Pol.,Technol.
Aliment. 12(2): 181 – 194.
Lin, Y., Mouratidou, T., Vereecken, C., Kersting, M.,
Bolca, S., Moraes, A.C.F., Garcia, M.C., Moreno,
L.A., Gross, M.G., Valtuena, J., et al., 2015. Dietary
animal and plant protein intakes and their association
with obesity and cardio-metabolic indicators
inEuropean adolescents: The HELENA cross-sectional
study. Nutr J. 14(10): 1 – 11.
Mahan, L.K., Stump, S.E., 2008. Krause’s Food and
Nutrition Therapy. 12th ed. Missouri, Saunders
Elsevier.
Marin, A.S., Graupera, J.M.X., 2011. Nutritional status of
intellectual diasbled persons with Down Syndrome.
Nutr Hosp. 26 (5): 1059 – 1066.
McGloin, A.F., Livingstone, M.B., Greene, L.C., Webb,
S.E., Gibson, J.M., Jebb, S.A., Cole, T.J., Coward,
W.A., Wright, A., Prentice, A.M., 2002. Energy and
fat intake in obese and lean children at varying risk of
obesity. Int J ObesRelatMetabDisord. 26(2): 200- 207.
Nicklas, T.A., Farris, R.P., Myers, L., Berenson, G.S.,
1995. Impact of meat consumption on nutritional
quality and cardiovascular risk factors in young adults:
the Bogalusa Heart Study. J Am Diet Assoc. 95:887–
892.
Nursilmi, Kusharto, C.M., Dwiriani, C.M., 2017.
Hubungan status gizi dan kesehatan dengan kualitas
hidupo lansia di dua lokasi berbeda. Jurnal MKMI.
13(4):369-379.
Oosterom, H.B.M.V.G., Dommelen, P.V., Schonbeck, Y.,
Murphy, A.M.O., Wouwe, J.P.V., Buitendijk, S.E..
2012. Prevalence of overweight in Dutch children with
Down Syndrome. Pediatrics. 130 (6): 1520 –1526.
Rolland-Cachera, M.F., Thibault, H., Souberbielle, J.C.,
Soulie, D., Carbonel, P., Deheeger, M., Roinsol, D.,
Longueville, E., Bellisle, F., Serog, P., 2004. Massive
obesity in adolescents: dietary interventions and
behaviours associated with weight regain at 2 y
follow-up. Int J ObesRelatMetabDisord. 28(4): 514–
519.
Saker, M., Merzouk, H., Merzouk, S.A., Ahmed, S.B.,
Narce, M., 2011. Predictive factors of obesity and their
relationships to dietary intake in schoolchildren in
Western Algeria. J Clin Med. 6(2): 90 – 99.
Samarkandy, M.M., Mohamed, B.A., Al-Hamdan, A.A.,
2012. Nutritional assessment and obesity in Down
Syndrome children and their siblings in Saudi Arabia.
Saudi Med J. 33(11): 1216 – 1221.
Samour, P.Q., King, K., 2005. Handbook of Pediatric
Nutrition. 3rd ed. Sudbury, Jones and Bartlett
Publishers.
Shin, M., Besser, L.M., Kucik, J.E., Lu, C., Siffel, C.,
Correa, A., 2009. Prevalence of Down Syndrome
among chidren and adolescents in 10 regions of the
United States. Pediatrics. 124(6):1565-1571.
Supariasa, I.D.N., Bakri, B., Fajar, I., 2001. Penilaian
Status Gizi. Jakarta, EGC.
Wang, Y., Beydoun, M.A., 2009. Meat consumption is
associated with obesity and central obesity among US
adults. Int J Obes (Lond). 33(6): 621- 628.
Yulni, 2013. Hubungan asupan zat gizi makro dengan
status gizi pada anak sekolah dasar di wilayah pesisir
Kota Makassar. Jurnal MKMI. 205-211.
ICOH 2019 - 1st International Conference on Health
350
