
Effectiveness of E-tourism Website as a Tourism Promotion Media using
AIDA Model: A Study in Context of visitingjogja.com
Nazli Amanda
1
, Paulus Insap Santosa
1
and Wing Wahyu Winarno
1
1
Department of Electrical Engineering and Information Technology, Universitas Gadjah Mada, Yogyakarta, Indonesia
Keywords:
E-tourism, Effectiveness, Promotion, AIDA, WebQual
Abstract:
The use of e-commerce in the tourism industry is known as e-tourism terminology. E-tourism can include
promotion, marketing to tourism transactions. The Indonesian government has poured a considerable amount
of funds in developing e-tourism, as well as the Government of the Special Region of Yogyakarta in developing
visitingjogja.com as one of the e-tourism website. By using questionnaires this study wants to find the extent
to which the effectiveness of website e-tourism as a tourism promotion media is measured using the AIDA
model based on the area on WebQual 4.0. In addition, this study also examined what factors were influential
in it. The results showed a very high level of effectiveness in most of the AIDA model, which is Attention,
Interest and Desire but has not been too effective in the stage of Action. furthermore, areas on WebQual 4.0
has an effect on every stage of AIDA.
1 INTRODUCTION
Tourism that uses information technology in its man-
agement is called e-tourism. In a publication that
made the World Tourism Organization, ”Tourism
Ecommerce”, wrote that the notion of e-tourism is
the use of technology to enhance tourism relations
(Zhang, 2009). Etourism is something that is very po-
tential to be developed, therefore, the Indonesian gov-
ernment has poured substantial funds in developing
e-tourism in Indonesia, especially after the implemen-
tation of tourist visits in 2008. E-tourism can include
promotional, marketing to transaction of tourism sec-
tor. At present almost 75% of the world’s popu-
lation owns smartphones, therefore the development
of tourism through interconnected interconnected ser-
vices is a great potential that must be managed well
and planned (Murtadho and Shihab, 2011).
Promotion is one of the four basic elements of
marketing, the four elements are product, place, price
and promotion. (Sari, 2011) Promotional tools must
attract attention, get and encourage interest, gener-
ate desire, and produce action. Promotions are im-
plemented effectively and controlled properly it will
play a role in influencing and raising consumer inter-
est which in turn will significantly affect the number
of purchases of products or services.
A good promotional tool at this time is online
media, this is because the number of internet users
is increasing at any time. According to data from
the Indonesian Internet Service Providers Association
(APJII) in 2016, the figure of 132.7 million out of
256.2 million Indonesians has used the internet, and
the majority are on the island of Java ((APJI), 2015).
Visitingjogja.com is an information system based
e-tourism websites launched by the Department of
Tourism DIY (Special Region of Yogyakarta), which
aims to integrate the various information through a
single door. The vision of the Office of Tourism is
to realize Yogyakarta as a culture-based tourism area
that is based on local strength and excellence and can
be the locomotive for the development of the Special
Region of Yogyakarta. Therefore this study wants to
find out the extent of the effectiveness of the informa-
tion system visitingjogja.com in terms of promoting
tourism in the Special Region of Yogyakarta using the
AIDA marketing model.
AIDA
The effectiveness of a product or service promo-
tion can be measured by using the AIDA model (at-
tention, interest, desire, action). The AIDA model is
one of the class models known as hierrarchy effect
models or hierrarchy models, which implies that con-
sumers move through a series of steps or stages when
they make purchasing decisions. This model is a lin-
ear model, sequentially built on the assumption that
consumers who move through a series of cognitive
stages (thinking) and affective (feelings) and the peak
Amanda, N., Santosa, P. and Winarno, W.
Effectiveness of E-tourismWebsite as a Tourism Promotion Media using AIDA Model: A Study in Context of visitingjogja.com.
DOI: 10.5220/0009866001330138
In Proceedings of the International Conference on Creative Economics, Tourism and Information Management (ICCETIM 2019) - Creativity and Innovation Developments for Global
Competitiveness and Sustainability, pages 133-138
ISBN: 978-989-758-451-0
Copyright
c
2020 by SCITEPRESS – Science and Technology Publications, Lda. All rights reserved
133
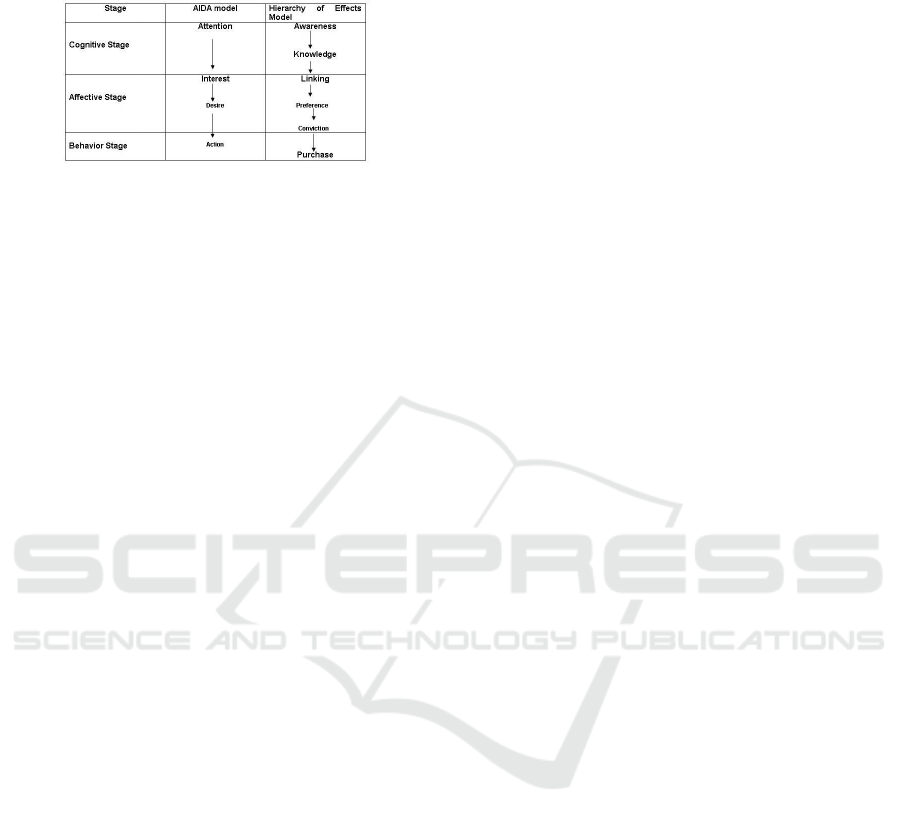
stage is action (purchase or experiment)(Zeithaml
et al., 1990)
Figure 1: Hierrarchy of Effect Model (source
http://old.perpusnas.go.id/gambarmajalah/1-hirarcyeffect-
model.jpg)
The level of effectiveness based on AIDA, ex-
plains the steps taken by consumers in responding
to advertisements or information offered. These
steps include: attention, maintaining interest (inter-
est), stimulating desire (desire), and resulting in ac-
tion according to the contents of the information pro-
vided (action)(Vakratsas and Ambler, 1999).
WebQual 4.0
Webqual is a method of measuring website quality
based on the perceptions of end users (communities).
This method is a development of servqual (Zeithaml
et al., 1990) which was used previously in measur-
ing service quality (Zeithaml et al., 1990) (Diana and
Tjiptono., 2007). WebQual 4.0 is based on research
in three areas, namely, Information Quality, Service
Interaction Quality, Usability.
a Information Quality is the quality of them content
obtained at the site, the suitabelity of information
for user purposes such as accuracy, format and rel-
evance (Diana and Tjiptono., 2007)
b Service Interaction is the quality of the interac-
tion of service experienced by users when they
delve deeper into the site, which is realized by
the trust and empathy, for example the issue of
security of transactions and information, product
delivery, personalization and communication with
site owners. (Diana and Tjiptono., 2007)
c Usability is the quality associated with site de-
sign, for example appearance, ease of use, navi-
gation and images conveyed to users (Diana and
Tjiptono., 2007)
2 LITERATURE REVIEW
The study (Adhanisa and Fatchiya, 2017) uses AIDA
as a measure of the website and Instagram shows that
websites and Instagram are only effective in attracting
attention, and attracting interest, while in wanting and
also acting is still less influential. This is influenced
by the completeness of the information on the web-
site and the completeness of information and caption
grammar on Instagram. The study was conducted in
Yogyakarta.
The study (Losung, 2011) measures the effec-
tiveness of utilizing e-tourism as a promotional Me-
dia and its implications in tourism destination plan-
ning. The goals of this study are to find factors that
influence the effectiveness of e-tourism seen from
the expectations of users from highest e-tourism fea-
tures and considered the most important in providing
etourism information. The study was conducted in
North Sulawesi.
The study (Masthori et al., 2016) resulted in a
modified webqual method that was able to explore the
quality of website services as well as the level of ben-
efits obtained through the application of the website
so that this method can be used to evaluate the quality
of local government website services more compre-
hensively. The data analysis technique used is quan-
titative and qualitative with the method of collecting
data using a questionnaire.
3 OBJECTIVE OF THIS STUDY
a. To find out how effective e-tourism website vis-
itingjogja.com when measured using a model
AIDA
b. To find out whether there is influence/effect We-
bQual 4.0 on the effectiveness of using th emodel
AIDA
4 METHODOLOGY
The effectiveness of the website visitingjogja.com as
a tourism promotion media can be measured using the
AIDA model (attention, interest, desire, action). Ef-
fectiveness was measured by the quality of the web-
site by WebQual 4.0 are, quality of information, ser-
vice interaction quality, and usability.
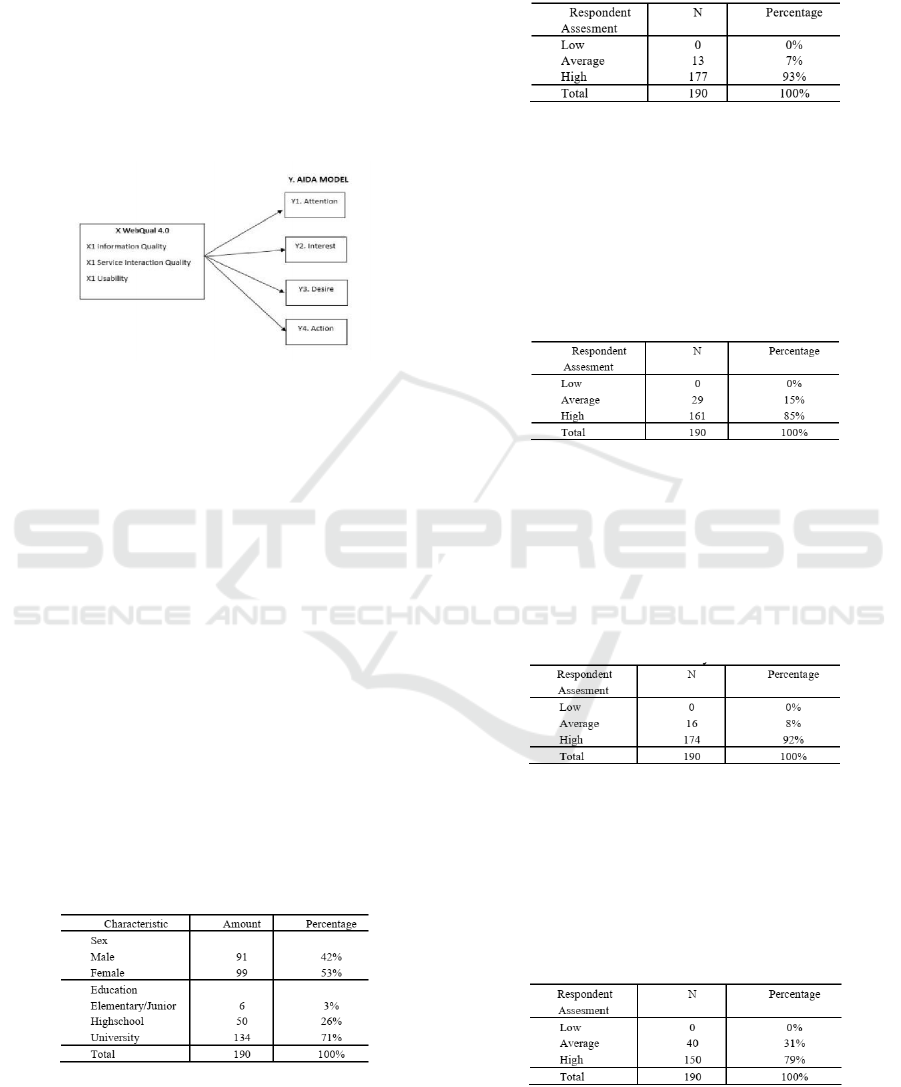
In this study the independent variable is the area
on WebQual 4.0 (quality information, service interac-
tion quality, and usability) while the dependent vari-
able is the AIDA model (attention, interest, desire, ac-
tion). The hypothesis in this study is formulated as
follows:
H1. There is the influence of WebQual 4.0 variable
on Attention H2. There is the influence of WebQual
4.0 variable on Interest H3. There is the influence
ICCETIM 2019 - International Conference on Creative Economics, Tourism Information Management
134
of WebQual 4.0 variable on Desire H4. There is the
influence of WebQual 4.0 variable on Action
Each variable is broken down into several indica-
tors as a reference in making questionnaire questions.
Data collected by distributing questionnaires online.
The scale used in this measurement is an interval scale
of 1-5. Point given as below
Strongly Agree : 5 point Agree : 4 point Neither
Agree/Disagree : 3 point Disagree : 2 point Strongly
Disagree : 1 point
Figure 2: Variable Corelation
This study uses a sampling method that is non-
probability sampling with an accidental sampling pro-
cedure, with a technique where the researcher se-
lects the sample spontaneously or anyone who is con-
sidered to represent the population based on prede-
termined criteria (Unaradjan 2013). This accidental
sampling technique was carried out because the re-
searcher did not know the population so it did not de-
termine the sampling frame.
Questionnaires lasted from 15 March 2019 until
15 May 2019. The total questionnaires were collected
on the questionnaire was 219. But after verifying and
reducing 190 questionnaires were obtained. The data
was then processed for research.
5 RESULT
Respondents Detail is an important factor and it is be-
ing measured. The following table shows the details
of the respondents.
Figure 3: Responden Detail.
Figure 3 represents the distribution of respondents
by sex dan education. The data were collected from
190 respondents among the 100 respondents 42% are
male and 53% are female. On educational distribu-
tion shows 3% are elementary/junior school, 26% are
highschool and the rest are university with 71%.
Figure 4: Quality of Information Distribution.
Based on the data in the Figure 4 shows that the
majority of respondents rated Quality of Information
on sites visitingjogja.com very high, with a percent-
age of 93% and this proves that the quality of infor-
mation provided on the website is good according to
respondents, both on the side of completeness of in-
formation, actuality , benefits as well as the language
of communication is delivered.
Figure 5: Service Interaction quality Distribution.
Based on the Figure 5, the assessment of the ma-
jority of respondents to the quality of service interac-
tions is very high reaching 85%, while the remaining
15% assess the quality of service interactions is mod-
erate. This shows that the majority of respondents
considered the elements of communication, security,
believability in the site visitingjogja.com is good.
Figure 6: Usability Distribution.
According to the Figure 6 above, the majority of
respondents rate the Usability or quality associated
with the site design is very good, with the percentage
of votes a high category by 92%, while the remaining
16% rate this medium/average. This shows the easy to
use element, interface design, access speed assessed
by the majority of respondents to be very good.
Figure 7: Attention Distribution.
Based on the Figure 7, the majority of respondents
paid very high attention when viewing the contents
Effectiveness of E-tourismWebsite as a Tourism Promotion Media using AIDA Model: A Study in Context of visitingjogja.com
135
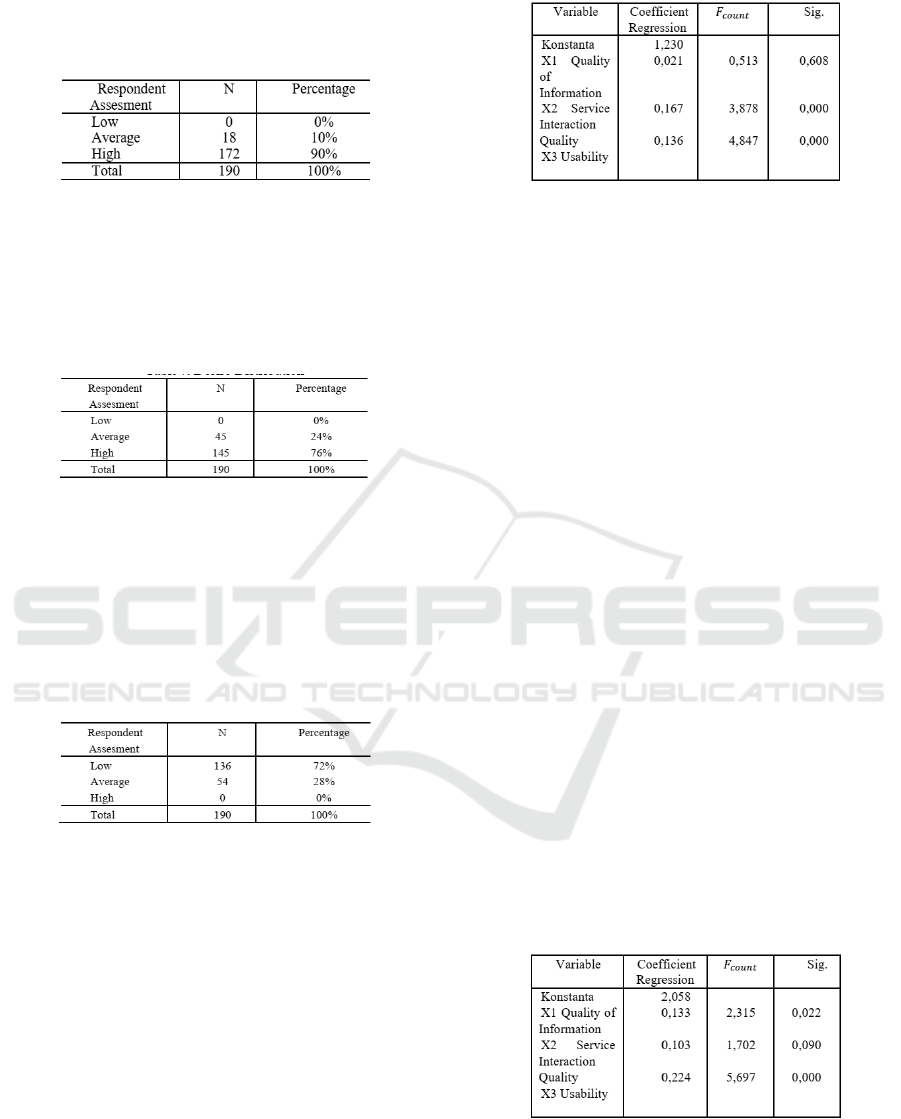
of the website visitingjogja.com, with a high atten-
tion rating of 79%, the remaining 31% rated moder-
ate/average.
Figure 8: Interest Distribution.
Based on Table 8, the majority of respondents
judge the content of visitingjogja.com causing any
interest for respondents to know more information
about the product delivered within a site, this is in-
dicated by the high percentage of votes by 90% and
the remaining 10% judge was moderate/average.
Figure 9: Desire Distribution.
Based on the Figure 9, 76% of respondents rated the
content of sites visitingjog causing a high desire to
make purchases or visit tourism products, while the
other 24% rated moderate/average. The majority of
respondents would to make purchases or visit tourism
products offered, in this stage the respondents began
to look for additional information to meet the needs
of the tourism products they wanted.
Figure 10: Action Distribution.
Based on the Figure 10, it shows that the assess-
ment of the action of the majority of respondents
is low, which is 72% and for the mederate/average
is 28%. this shows that the majority of respon-
dents have not or rarely visited or made purchases of
tourism products after getting information from visit-
ingjogja.com.
6 FINDING
From this chapter, it can be described some findings
about the analysis from the data collection. The anal-
ysis model is multiple linear regression analysis on
each of WebQual 4.0 variables as independen variable
to each of AIDA variable as dependen variable.
Figure 11: Action Distribution.
F
count
= 83,354 0,000
R Square = 0,573
To find out whether the X variable influences si-
multaneously on the Y variable, the resulting data
must meet the following conditions,
a If the value of Sig. <0.05 then there is a simul-
taneous effect of variable X on Y, then h1 is ac-
cepted..
b If the value of F
count
> F
table
then there is a si-
multaneous effect of variable X on Y, then h1 is
accepted.
According from the Figure 11, it is known that
F
count
is 83,354 with a significance value is 0,000, and
from the formula F
table
= (k; n-k) , FF
table
=2,42 were
obtained. where k is the number of variables and is
the number of respondent, so it can be concluded as
below:
a 0,000 < 0,05, then hypothesis 1 is accepted
b 83,354 > 2,42, then hypothesis 1 is accepted
The Figure 11 shows that the percentage of the
effect of the Quality of Information, Service Interac-
tion Quality and Usability variables has a simultane-
ous effect of R Square, which is 57.4%, the remaining
42.6% is influenced by other variables outside the re-
search.
So the regression equation is Y = a + b1X1 +
b2X2 = b3X3 + b4X4, then Attention = 1, 230 +
0, 021 + 0, 167 + 0, 136
Figure 12: Multiple Linear Regression to Y2 Interest.
F
count
= 84,846 0,000
R Square = 0,578
According to Figure 12, it is known that F
count
is
84.846 with a significance value of 0.000, from the
ICCETIM 2019 - International Conference on Creative Economics, Tourism Information Management
136
formula F
table
= (k; n-k) , FF
table
=2,42 were ob-
tained. where k is the number of variables and n is
the number of respondent, so it can be concluded as
below:
a 0,000 < 0,05, then hypothesis 2 is accepted
b 84,846 > 2,42, then hypothesis 2 is accepted
The Figure 12 shows that the percentage of the
effect of the Quality of Information, Service Inter-
action Quality and Usability variables has a simul-
taneous effect of R Square, which is 57.8%, the re-
maining 42.2% is influenced by other variables out-
side the research. then the regression equation is
Y = a + b1X1 + b2X2 = b3X3 + b4X4, so Interest =
2, 058 + 0, 133 + 0, 103 + 0,224.
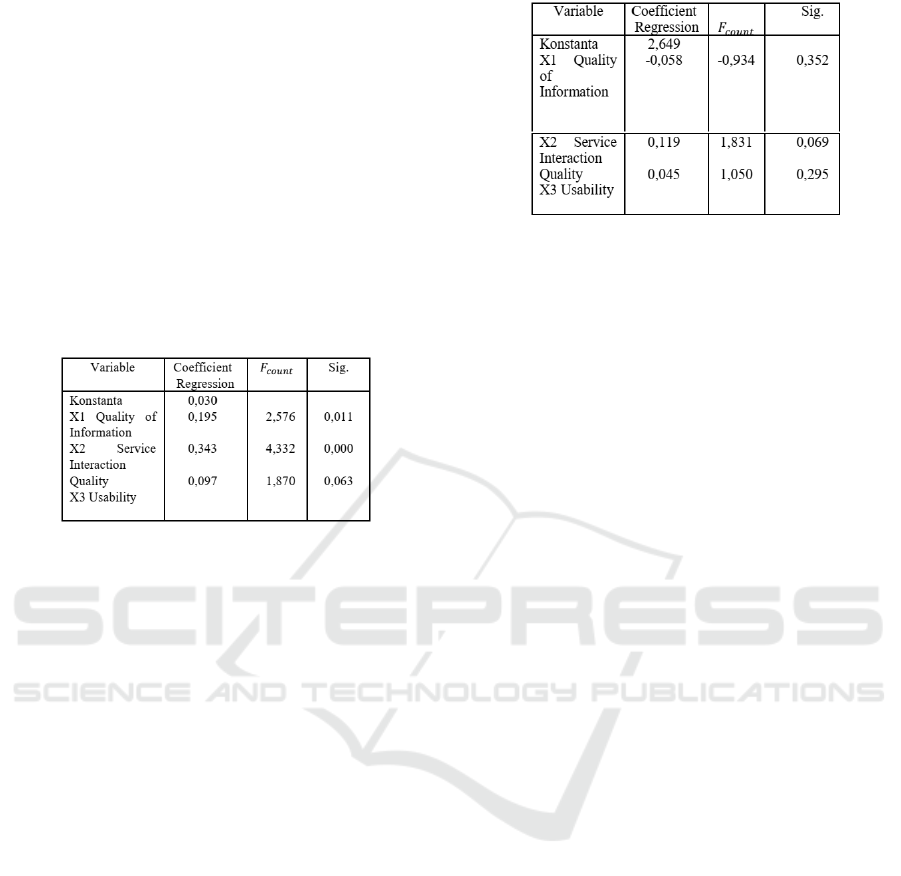
Figure 13: Multiple Linear Regression to Y3.Desire.
F
count
= 69,553 0,000
R Square = 0,529
According Figure 13, it is known that F
count
is
69,553 with a significance value of 0.000, from the
formula F
table
= (k; n-k) , FF
table
=2,42 were ob-
tained. where k is the number of variables and n is
the number of respondent, so it can be concluded as
below
a 0,000 < 0,05, then hypothesis 3 is accepted
b 69,553 > 2,42, then hypothesis 3 is accepted
The Figure 13 shows that the percentage of the
effect of the Quality of Information, Service Interac-
tion Quality and Usability variables has a simultane-
ous effect of R Square, which is 52,9%, the remaining
47,1% is influenced by other variables outside the re-
search.
Then the regression equation is Y = a + b1X1 +
b2X2 = b3X3 + b4X4, so Desire = 0, 030 + 0, 195 +
0, 343 + 0, 097
F
count
= 5,335 0.002
R Square = 0,079
According Figure 14, it is known that F
count
is
5,335 with a significance value of 0.000, from the for-
mula F
table
= (k; n-k) , FF
table
=2,42 were obtained.
where k is the number of variables and n is the number
of respondent, so it can be concluded as below :
a 0,002 < 0,05, hypothesis 4 is accepted
b 5,335 > 2,42, then hypothesis 3 is accepted
Figure 14: Multiple Linear Regression to Y4 Action.
The Figure 14 shows that the percentage of the
effect of the Quality of Information, Service Inter-
action Quality and Usability variables has a simul-
taneous effect of R Square, which is 7,9%, the re-
maining 92,1% is influenced by other variables out-
side the research. Then the regression equation is
Y = a + b1X 1 + b2X2 = b3X 3 + b4X 4, so Action =
2, 649 + (−0, 058) + 0, 119 +0, 045
7 CONCLUSION AND
RECOMMENDATION
Based on the results of the analysis and discussion
that have been explained, there are some conclusions
from this study. First, the results of this study show a
high valuation response to the stages of Attention, In-
terest, Desire. So that the effectiveness of the website
visitingjogja.com effectively only reaches the third
stage, which is Desire from the four stages of AIDA.
Second, there is the effect/influence of each area
on WebQual 4.0 to AIDA, this is evidenced by the
value of the Significancy of each step of less than
0.05. In addition, it is also known the percentage
of the influence of area variables on WebQual 4.0
on AIDA, which is Attention stage is 57.3%, Inter-
est is 57.8%, and Desire is 52.9%, this indicates the
influence of quality of information, service interac-
tion quality and usability affect more than half to the
stages of attention, interest, desire, and the rest is in-
fluenced by other factors outside this research. While
Action, the percentage of the influence of the We-
bqual 4.0 area is only 7.9%, this proves that the deci-
sion to take action is influenced by many factors out-
side of this research.
In the future, an increase in each of the WebQual
4.0 areas is needed, because this area has an influence
on the effectiveness of website e-tourism for promo-
tion side and besides that there needs to be research to
find out other factors that influence the effectiveness
of tourism promotion on website etourism.
Effectiveness of E-tourismWebsite as a Tourism Promotion Media using AIDA Model: A Study in Context of visitingjogja.com
137

REFERENCES
Adhanisa, C. and Fatchiya, A. (2017). Efektivitas website
dan instagram sebagai sarana promosi kawasan wisata
berbasis masyarakat. Jurnal Sains Komunikasi dan
Pengembangan Masyarakat.[Internet], 1(4):451–466.
(APJI), A. P. J. I. I. (2015). Profil pengguna internet indone-
sia 2014.
Diana, A. and Tjiptono., F. (2007). EBusiness. Andi : Yo-
gyakarta.
Losung, L. M. (2011). EFEKTIVITAS PEMANFAATAN
E-TOURISM SEBAGAI MEDIA PROMOSI DAN IM-
PLIKASINYA PADA PERENCANAAN DESTINASI
PARIWISATA (Studi Kasus: Dinas Kebudayaan dan
Pariwisata Sulawesi Utara). PhD thesis, Universitas
Gadjah Mada.
Masthori, A., Nugroho, H. A., and Ferdiana, R. (2016).
The use of modified webqual method in evaluation of
website service quality of local government (penggu-
naan metode webqual modifikasi dalam evaluasi kual-
itas layanan website pemerintah daerah). Pekommas,
1(1):57–68.
Murtadho, A. and Shihab, M. R. (2011). Analisis si-
tus e-tourism indonesia: Studi terhadap persebaran
geografis, pengklasifikasian situs serta pemanfaatan
fungsi dan fitur. Journal of Information Systems,
7(1):13–25.
Sari, S. P. (2011). Pengaruh tipe keterlibatan konsumen ter-
hadap kepercayaan merek dan dampaknya pada kepu-
tusan pembelian. FE (Manajemen), 7(7).
Vakratsas, D. and Ambler, T. (1999). How advertising
works: what do we really know? Journal of mar-
keting, 63(1):26–43.
Zeithaml, V. A., Parasuraman, A., Berry, L. L., and Berry,
L. L. (1990). Delivering quality service: Balancing
customer perceptions and expectations. Simon and
Schuster.
Zhang, J. (2009). Tourism e-commence business model in-
novation analysis. In 2009 International Conference
on E-Business and Information System Security, pages
1–5. IEEE.
ICCETIM 2019 - International Conference on Creative Economics, Tourism Information Management
138
