
Experimental Study and Mathematical Quantification of Drying as
Pretreatment of Local Biomass for Adsorbents in Biogas Purification
Ari Diana Susanti
1
, Paryanto
1
, Wusana Agung Wibowo
1
, Cariessa Salsanofa
1
and Irfaan Fauzi
1
1
Department of Chemical Engineering, Universitas Sebelas Maret, Surakarta, Indonesia
Keywords: Bi-G Correlation, Convective Drying, Diffusivity Model, Dincer and Dost Model, Fick’s law equations
Abstract: Biogas impurities is a major problem related to its heating value and feasibility of conversion to small-scale
electrical energy. Adsorption is believed as one of the potential method of biogas purification. This process
conducted in porous material whose surface active properties, such as activated carbon with an acid or base
activator. Laboratory experiments and mathematical quantification were carried out to study the drying
process of Gamal (Gliricidia sepium) stem as a source of biomass that were widely grown in the local area of
livestock / biodigester. Determination of the drying process parameters and mass transfer parameters were
approached using three drying models: (1) Dincer and Dost models, (2) Bi-G correlation approach, and (3)
Fick’s law equation. This research shows that second Fick’s Law is the best model to describe the drying
process parameters and to calculate the mass transfer parameters for Gamal stem.
1 INTRODUCTION
Drying, an energy intensive process, involves both
heat and mass transfer (Ndukwu, 2017). Drying can
be done by traditional and modern drying method,
there are sun drying and oven drying (Ramavandi,
2015). The most common traditional drying is using
solar heat because it costs more reasonable price and
easy to practice (Afolabi, 2014). Drying using hot air
widely used in industries because it is more efficient
in time (Fernando, 2016). Arredondo (2016) argued
that cylinders in shape has lower energy
consumptions due to their fast moisture removal.
The drying process of wood has two stages, the
first stage is moisture transfer from the inner wood as
capillary flow and diffusion to the surface. Then the
second stage is water evaporation from the wood
surface to the environmental or drying medium
(Zhengbin, 2019). Moisture transfer coefficient and
effective moisture diffusivity are used to analyse the
efficiency of mass transfer and drying moisture
transfer model (Harchegani, 2014). By measuring the
weight loss of samples at time interval, moisture
losses during drying process can be determined
(Akonor, 2016).
Alara (2017) said the most important aspect of
drying technology is the mathematical modelling of
drying processes. The mathematical modelling is
used to arrange several equations to describe a system
(Sridhar, 2015).
In this research, drying processes were conducted
in electrical oven. In theoretical consideration, three
moisture transfer models, including: Dincer and Dost
model, Bi-G correlation approach, and conventional
solution of second Fick's law of diffusion were used
to determine effective moisture diffusivity and
moisture transfer coefficient. The modelling is
basically based on a set of mathematical equations
which can explain the drying system and the solution
of these equations must allow the prediction of the
process parameters as the function of time at any
point of the dryer which is basically depending only
on the initial condition (Nurafifah, 2018).
2 MATERIAL AND METHODS
This research uses several instruments, such as:
Woodcutter machines. It was used to cut the
raw material into 3 cm of length.
Oven. This research use oven for drying
process.
Calipers. It has been used to measure the
diameter of the raw material.
Petri dishes. During the drying process, the
raw materials was put into petri dishes.
42
Susanti, A., Paryanto, ., Wibowo, W., Salsanofa, C. and Fauzi, I.
Experimental Study and Mathematical Quantification of Drying as Pretreatment of Local Biomass for Adsorbents in Biogas Purification.
DOI: 10.5220/0009871700002905
In Proceedings of the 8th Annual Southeast Asian International Seminar (ASAIS 2019), pages 42-48
ISBN: 978-989-758-468-8
Copyright
c
2022 by SCITEPRESS – Science and Technology Publications, Lda. All rights reserved

2.1 Materials
Wood stems of Gliricidia sepium from local area and
assumed to be cylindrical in shape were used.
2.2 Experimental Procedure
This research was divided into three steps. There are
(1) raw material preparation, Gliricidia sepium was
cut into various diameter which are 13 cm, 16 cm, and
18 cm. Each variation has 3 cm length, (2) oven
drying, the sample is weighed and placed in a
different petri dish for each diameter. The sample is
dried in the oven at 100
o
C and weighed every 10
minutes, and (3) calculation of the experimental data,
the sample weight losses data was obtained and then
the experimental data will be compared to calculate
the drying rate.
2.3 Mathematical Modeling
2.3.1 Model I: Dincer and Dost Model
In this model, the transient moisture diffusion process
is similar to the heat conduction process in entire
drying process. The different geometric-shaped of the
raw material/moist solid can be determined by Dincer
and Dost equation (Harchegani, 2014). The time-
dependent moisture diffusivity equation in one-
dimensional cylindrical coordinates for an infinite
cylinder can be written as follow:
(1)
Initial and boundary condition:
,0
,
0,
0,
,
,
(2)
Biot and Fourier dimensionless number:
/ (3)
/
(4)
The moisture ratio at any point of the solid can be
expressed as follow (Lingayat, 2016):
/
(5)
The solution in equation (1) with the
dimensionless humidity distribution centre boundary
conditions for an object
∑
(6)
The solution of equation (1) with the boundary
conditions yields dimensionless centre moisture
distribution is
≅
(7)
For an infinite cylindrical object:
exp
0.5066/1.7
(8)
exp
(9)
The characteristic in equation (9) is given by
Dincer and Dost as follow:
For an infinite cylindrical object:
3 4.188ln
6.796
1
.
⁄
⁄
(10)
For 0.1 10
The exponential form can be used to express
dimensionless moisture distribution.
exp
(11)
where G represents lag factor (dimensionless) which
indicate an internal resistance of an object to the heat
and/or moisture transfer during drying and S
represents drying coefficient that shows the drying
capability of an object per unit time (1/s).
The moisture diffusivity for an infinite slab,
cylinder or spherical products is given by the
following equation below:
⁄
(12)
The moisture transfer coefficients results can be
express in
⁄
(13)
And to determine the moisture transfer coefficient
for an infinite cylindrical object can be written as
follow:
⁄
11.974ln
3.3559ln
⁄
(14)
2.3.2 Model II: Bi-G Correlation
Biot number–lag factor (Bi–G) correlation is
proposed by Dincer and Dost and has been used to
determine the mass transfer parameters (Harchegani,
2014).
0.0576
.
(15)
1. The characteristic first root in equation (9) is
determined using the following expression below
for infinite cylindrical object.
3.4775
25.285
68.43
82.468 35.638 (16)
Experimental Study and Mathematical Quantification of Drying as Pretreatment of Local Biomass for Adsorbents in Biogas Purification
43
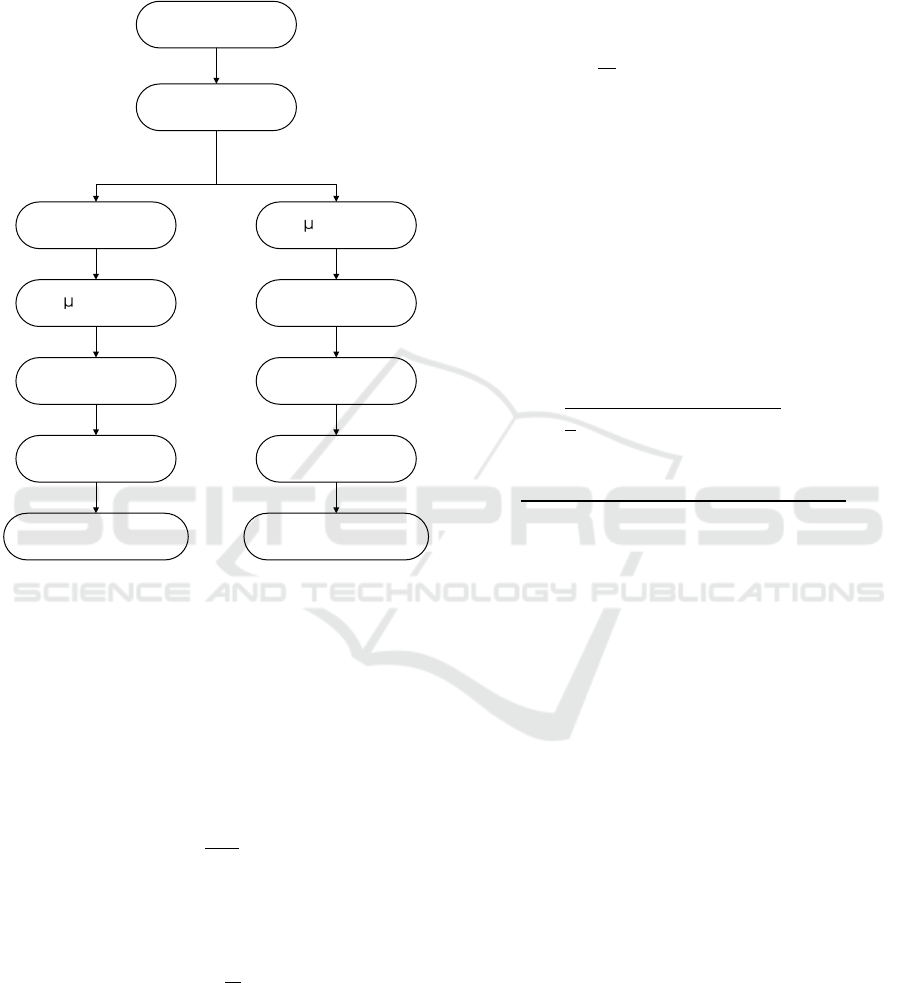
The procedure of using Dincer and Dost and Bi-
G Correlation modelling technique for estimating the
process parameters and drying parameters is as
follows:
Experimental moisture content
( Eq. 5)
Exponential form of (Eq. 11)
to obtain G and S
Biot number (Eq. 8)
G=A
1
Moisture Diffusivity
(Eq. 12)
Moisture transfer coefficient
(Eq. 14)
Moisture distribution (Eq. 7) from
A
1
(Eq. 8) and B
1
(Eq. 9)
Dincer and Dost
Model
Moisture Diffus ivity (Eq. 12)
Biot number
(Eq. 15)
Moisture transfer coefficient
(Eq. 13)
Moisture distribution (Eq. 7) from
A
1
(Eq. 8) and B
1
(Eq. 9)
1
(Eq. 16)
Bi-G Correlation
1
(Eq. 10)
Figure 1.
2.3.3 Model III: Second Fick’s Law
Second Fick’s law can be used to study water
diffusion kinetics and effective moisture diffusivities
(Demiray, 2017).
Crank’s solution of second Fick’s law has
been used by many authors to determine effective
moisture diffusivity by assuming uniform moisture
distribution
∑
exp
(17)
where n is the number of terms in Fourier series.
The convective mass transfer coefficient was
described by Kaya et al. as follow:
ln
(18)
where A and V are the sample surface area (m
2
) and
the sample volume (m
3
).
To determine the samples drying parameters, we
can use the conventional solution of second Fick’s
law as follow:
Result log of equation 17
Plot the experimental data of ln(MR) versus
the drying time then calculate the moisture
diffusivity.
(19)
The convective mass transfer coefficient was
determined using Eq. 18
Calculate the moisture ratio values.
2.3.4 Analysis
Determination of the best model for mathematical
quantification of drying of gamal stem will be done
through statistical criteria, root of mean square error
(RMSE) and coecient of determination (R) (Azeez,
2019). Dhanushkodi (2017) explained that RMSE
and R can be solved by this equation below:
RMSE
1
∑
,
,
2
1
(20)
∑
,
,
∑
,
∑
,
(21)
3 RESULTS AND DISCUSSION
3.1 Drying Kinetics
The equilibrium moisture content of the biomass
sample for different diameter is determined with a
temperature of 100oC during the drying period and
reached when there is no significant change in sample
weight. Drying time for each sample are 210, 240,
240 minutes for the drying process carried out
respectively on the sample diameter of 13, 16, 18 mm.
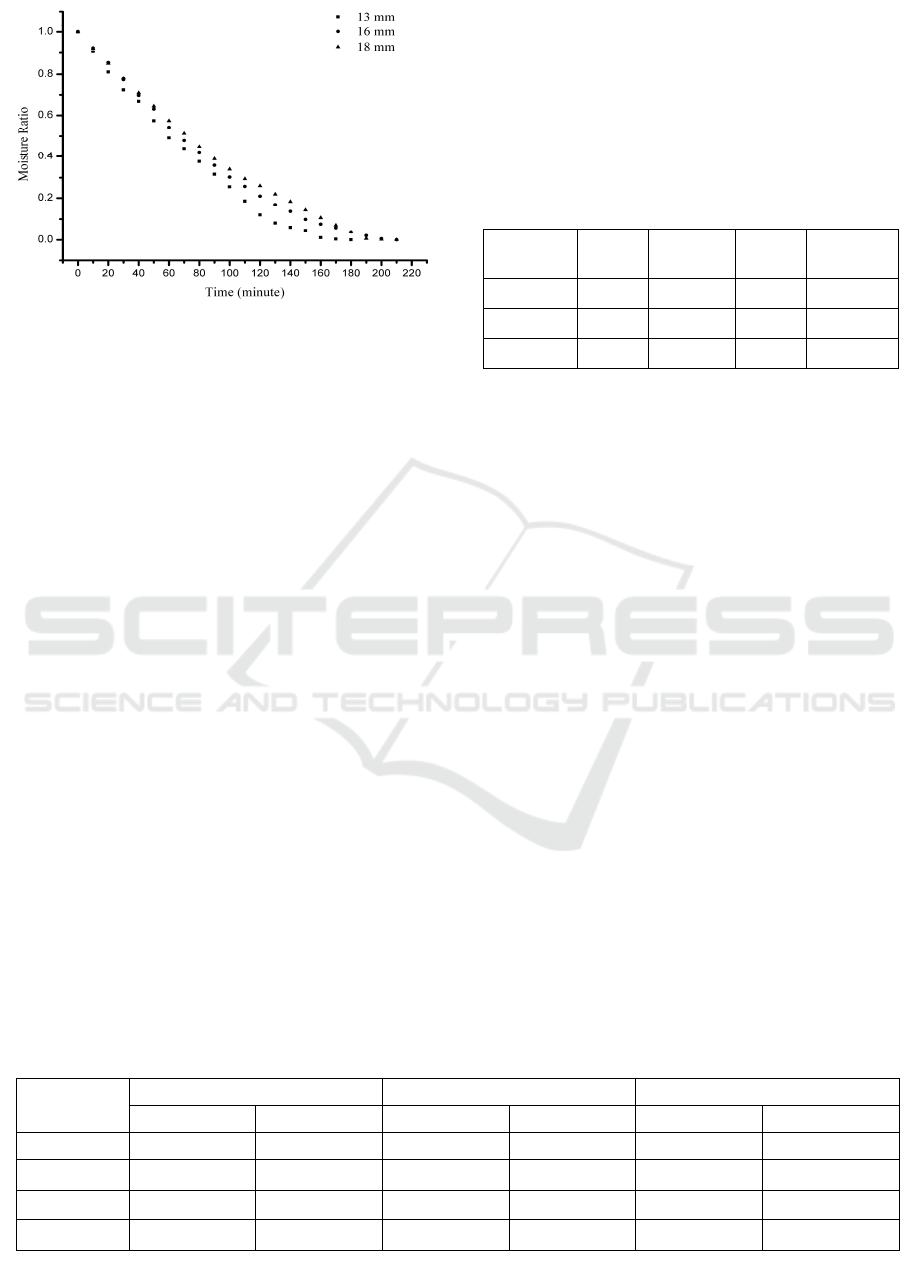
To reach equilibrium moisture content, Figure (2)
shows the ratio between humidity vs time for
different sample diameters. The graph shows an
exponential trend for the drying curve. Lowest
diameter (13 mm) requires the shortest time to reach
entire equilibrium moisture content. Larger diameter
has a larger contact surface area but contains more
moisture content so it requires a longer time.
Generally drying takes place in two periods, a
constant rate and a period of falling rates. After a
warm-up period, a constant rate occurs and is
followed by a period of slowing down. Usually, in a
ASAIS 2019 - Annual Southeast Asian International Seminar
44
constant period, there is a reduction of moisture on
the surface.
The drying rate during this period mostly depends
on the rate of heat transfer to the material that being
dried. Therefore, the maximum drying rate that can
be reached is considered a limited heat transfer. If
drying is continued, the slope of the drying rate curve
becomes less steep (period of falling rate), and finally
tends to be almost horizontal for a very long time.
3.2 Model Application: Moisture
Diffusivity and Moisture Transfer
Coefficient Estimation
By using the least-squares method, the dimensionless
values of the experimental moisture ratio were
regressed against the drying time according to
equation (11) and the drying coefficient (S) and the
lag factor (G) were obtained. Values of R
2
and RMSE
indicate that the exponential equation satisfactorily
fitted to the experimental data. The drying coefficient
values obtained are shown in (Table 1).
The drying coefficient shows the drying ability of
a product per unit time. The values of lag factor
(1.1892, 1.1982, and 1.2151) for the diameter of the
samples respectively 13, 16, 18 mm more than 1
indicating the diffusion of humidity in the sample is
controlled by internal and external resistance.
3.2.1 Dincer and Dost Models (Model I) and
Bi-G Correlation (Model II)
Biot (Bi) number values, the first root of the
transcendental characteristic equation (μ1), moisture
diffusivity (D) and moisture transfer convective
coefficient (km) obtained by the Dincer and Dost
model (Model I) and the Bi-G correlation (Model II)
is presented in Table (2).
Biot numbers is one of the most important
parameters during the drying process and show the
main moisture transfer mechanism in the material.
Very small Biot numbers, < 0.1, indicate that mass
transfer is externally controlled, while Biot numbers
> 0.1 indicate the presence of both internal resistance
(due to the sample itself) and surface resistance (due
to boundary layers) for moisture transfer. Biot
number values by both models I and II show that these
characteristics depend on the diameter of the sample
and increase with increasing diameter. The moisture
diffusivity of each diameter was calculated by Model
I and Model II by equation (12) and the results are
shown in Table (2). The humidity diffusivity values
of Model I and Model II with differences in diameter
Figure 2 : Moisture ratio of sample drying vs time with
a
diameter difference.
Table 1: Results of Calculation of Mass Transfer Parameters with Dincer and Dost models (Model I) and Bi-G correlation
(Model II).
Parameter
13mm 16mm 18mm
model 1 model 2 model 1 model 2 model 1 model 2
Bi
0,883800638 5,885382432 0,943972494 7,206677355 1,062701427 10,47264355
D (m
2
h
-1
)
5,80877E-05 3,82202E-05 6,72587E-05 4,4526E-05 7,94096E-05 5,32643E-05
μ1
0,996116992 1,228021522 1,025141704 1,259943676 1,077992197 1,316236551
km (m h
-1
)
0,000303603 0,006652639 0,000291341 0,005895662 0,000315262 0,005568645
Table 2: Drying coefficient (S) and Lag factor (G), MR =
G exp (-S t).
Diameter
(mm)
G S (h
-1
) R
2
RMSE
13
1,1892 1,3642 0,8391 0,1271
16
1,1982 1,1044 0,9005 0,0992
18
1,2151 1,1392 0,8304 0,1271
Experimental Study and Mathematical Quantification of Drying as Pretreatment of Local Biomass for Adsorbents in Biogas Purification
45

are 5.80877E-05; 3.82202E-05; 4,4526E-05;
5,32643E-05 for model II for diameters of 3, 16, 18
mm.
Moisture transfer convective coefficient for
drying application is determined based on the values
of G, Bi and D with models I and Model II using
equations (13) and (14). The parameter value of the
moisture transfer convective coefficient ranges from
0.000291341-0.000315262 m h-1 for models I and
0.005568645-0.006652639 m h-1 for model II at each
diameter.
3.2.2 Second Fick’s Law (Model III)
By plotting ln(MR) and drying time and then using
the gradient of the graph in Figure (3), the effective
diffusivity value of humidity with equation (17) with
a variety of sample diameter is obtained. The
effective diffusivity values of humidity are obtained
in Table (3). The values range from 1.19656E-05 -
1.93599E-05 m2 h-1. And the value of convective
mass transfer coefficient (Km) with moisture content
for the variation of sample diameter are illustrated in
Figure (4). The obtained values ranged between
0.003881654 - 0.012967475 (average value
0.006184313) m h-1, 0.003771573 - 0.012697894
(average value 0.005628793) m h-1, 0.004383745 -
0.016848745 (average value 0.005750302) m h-1 for
samples with diameters of 13, 16, 18 mm.
Figure 4: The relationship of convective mass transfer to
moisture content in the difference in sample diameter.
Figure 5: Calculation of humidity diffusivity with several
models of sample diameter
3.3 Surface Area Effect on Mass
Transfer Parameters
It is known that the diffusivity calculation value of all
models increases with increasing sample diameter
Figure (5). Increasing the diameter of the sample
causes the surface area of the contact area towards
mass transfer to be higher, resulting in the diffusivity
value of the water molecules increases.
Figure 6: Experimental and predicted dimensionless
moisture ratio during oven drying of local biomass at 16
mm diameter
Figure 3: The relationship of Ln(MR) to the drying time
on the difference in sample diameter.
Table 3: Mass Transfer Calculation Results with Second
Fick’s Law.
Diameter 13 mm 16 mm 18 mm
Deff (m
2
h
-1
) 1,19 E-05 1,41 E-05 1,93 E-05
Km Average
(m h-
1
)
0,006184 0,005628 0,005750
ASAIS 2019 - Annual Southeast Asian International Seminar
46

The mass transfer coefficient tends to increase
with the sample diameter Table (2 and 3). The mass
transfer coefficient is a function of the drying air and
the geometry system of the sample. It means the mass
transfer process is controlled externally with
boundary conditions and not internally controlled.
The calculated and experimental moisture ratio
profiles for each model are shown in figure (6). It is
revealed that for all treatments and predictions by
Fick’s Second Law model agreed better with the
experimental moisture ratio data in comparison with
all model.
4 CONCLUSIONS
In this experiment, wood drying biomass samples
were heated in convective mechanism and
mathematically-modelled into three different
variations. There are three theoretical models in this
experiment, Dincer and Dost model, the Bi-G
correlation approach and the conventional solution of
Fick's second law of diffusion which is used to
calculate the mass transfer parameters and predict the
dimensionless humidity ratio of the sample drying
process. The summaries are listed as follows:
The entire drying process occurred in a falling rate
period and no constant rate period was observed,
which indicates diffusion is the dominant physical
mechanism that determines the movement of
water vapor throughout the sample.
Biot number values indicate limited simultaneous
internal and surface resistance to moisture
transfer.
The mass transfer parameters can be increased by
increasing the diameter of the sample (mass
diffusion coefficient and moisture transfer
coefficient) for larger diameter has a larger
contact surface area but contains more moisture
content so it requires a longer time.
From the analysis of those three models, it can be
concluded that Fick’s Second Law is the best
model to describe the drying process parameters
and the mass transfer parameters for Gliricidia
sepium in a cylindrical shape because it has
minimal error.
ACKNOWLEDGEMENTS
The authors would like to thank Universitas Sebelas
Maret, for financial support of the research through
Hibah Penelitian Unggulan Terapan (PUT UNS) with
contract no. No.516/UN27.21/PP/2019.
REFERENCES
Afolabi, T, G., Akintunde, T, Y, T., Adeyanju, J, A., 2014.
Mathematical Modeling of Drying Kinetics of
Untreated and Pretreated Cocoyam Slices. India
Akonor P. T., Ofori H., Dziedzoave N. T., Kortei N. K.
Nutritional Properties of Shrimp Meat as Affected by
Different Traditional Drying Techniques. Ghana
Alara O.R., Abdurahman N.H., Olalere O.A. 2017.
Mathematical modelling and morphological
properties of thin layer oven drying of Vernonia
amygdalina leaves. Malaysia
Arredondo, Mariana Trujillo. 2016. Mathematical model
for solar drying of potato cylinders with thermal
conductivity radially modulated. Colombia
Azeez Luqmon., Adebisi Segun A, Oyedeji Abdulrasaq O.,
Adetoro Rasheed O., Tijani Kazeem O. 2019.
Bioactive compounds’ contents, drying kinetics and
mathematical modelling of tomato slices influenced
by drying temperatures and time. Nigeria
Dhanushkodi S., Wilson Vincent H., Sudhakar K. 2017.
Mathematical modeling of drying behavior of cashew
in a solar biomass hybrid dryer. India
Demiray, Engin., Tulek, Yahya. 2017. Effect of
temperature on water diffusion during rehydration of
sundried red pepper (Capsicum annuum L.).
Turkey
Fernando, J, A, K, M., Amarasinghe, A, D, U, S., 2016.
Drying Kinetics and Mathematical Modeling of Hot
Air Drying of Coconut Coir Pith. Sri Lanka
He Zhengbin., Qian Jing., Qu Lijie., Wang Zhenyu., Yi
Songlin. 2019. Simulation of moisture transfer during
wood vacuum drying. China
Kaya A, Aydin O, Dincer I (2010) Comparison of
experimental data with results of some drying models
for regularly shaped products. Heat Mass Transfer
46:555–562
Lingayat, A., Chandramohan, V.P., Raju, V, R, K. 2016.
Design, Development and Performance of Indirect
Type Solar Dryer for Banana Drying. India
Ndukwu, Macmanus C., Dirioha Cyprian., Abam, Fidelis
I., Ihediwa, Victor E. 2017. Heat and mass transfer
parameters in the drying of cocoyam slice. Nigeria
Nurafifah, F., Chuah, A Luqman., Wahida, M.A. Puteri
Farah. 2018. Drying of Plectranthus amboinicus
(lour) spreng leaves by using oven dryer. Malaysia
Ramavandi Bahman., Asgari Ghorban. 2015. Comparative
study of sun-dried and biomass oven-dried Malva
sylvestris for high-rate Cu (II) removal from
wastewater. Iran
Torki Harchegani, M., Ghanbarian, D., Sadeghi, M. 2014.
Estimation of Whole Lemon Mass Transfer
Parameters During Hot Air Drying Using Different
Modelling Methods. Iran.
Experimental Study and Mathematical Quantification of Drying as Pretreatment of Local Biomass for Adsorbents in Biogas Purification
47

Sridhar, D., Motappa Madhu, G. 2015. Drying Kinetics and
Mathematical Modeling of Casuarina equisetifolia
Wood Chips at Various Temperatures. India
ASAIS 2019 - Annual Southeast Asian International Seminar
48
