
The Effect of Indonesian Economic Openness on Poverty Levels in
Indonesia
Purwiyanta, and Ambar Puji Harjanto
Universitas Pembangunan Negeri Veteran Yogyakarta
Keywords: Globalization, Trade openness, Financial openness, Poverty, Error Correction Model
Abstract: Globalization is often positioned as a cause of poverty problems in a country. This study seeks to provide
empirical evidence for this view, especially for the Indonesian economy. Globalization is represented
through the openness of trade in goods and services (external balance) and openness in the financial sector,
including foreign direct investment and investment portfolios. It is suspected that trade openness and
financial openness affect poverty levels in Indonesia. The model used to test the hypothesis is the error
correction model (ECM), with time-series data from 1998 to 2017. The conclusion of this study is that it is
true that trade openness affects poverty in Indonesia, but financial openness does not affect poverty in
Indonesia.
1 INTRODUCTION
Most economists agree that trade liberalization and
financial liberalization, or what is often referred to
as openness in trade and financial openness, is one
way to improve a country's economy. The openness
policy on financial trade is expected to increase
trade. World trade data from 1980 to 2002 have
more than tripled. While in 2000, foreign direct
investment worldwide reached 1.4 trillion dollars
(Deliarnov, 2012).
The level of trade openness is measured using an
index of the level of openness (ratio of exports and
imports to GDP). According to Nowbutsing (2014),
the level of openness can be classified into three
categories namely less than 50% included in the
category of low level of openness, more than 50%
and less than 100% included in the category of
medium level of openness and more than 100%
included in the category of high level of openness.
In the Asian region, Singapore has the highest level
of openness, and Myanmar the lowest. Indonesia
itself is ranked ninth on average, with a medium
level of openness category.
Financial openness is marked by the magnitude
of transactions in the financial market (financial
market) starting from around the mid-1980s. The
movement of capital flows is increasingly large in
industrialized countries, especially countries in
Europe and America that have spread to various
regions of the world, especially countries in Asia-
Pacific. Chinn and Ito (2008) revealed that since
1970, based on the characteristics of the group of
less developed countries, the financial disclosure
index calculated from the ratio of capital accounts to
foreign funding showed that the Asia-Pacific region
had the greatest degree of openness when compared
to other geographical regions. This indicates that the
financial sector in the Asia-Pacific region is more
open and has very low financial market constraints.
An economy with an increasingly free financial
sector will contribute positively to macroeconomic
conditions. Kalemli-Ozcan & Sørensen (2003)
revealed that the increasingly integrated cross-
country capital flows would keep macroeconomic
variable fluctuations. This is because open financial
flows will help the country in gaining a variety of
access to capital, making variations in a country's
production patterns increase, and in turn, will
maintain fluctuations in macroeconomic variables.
Financial openness can be seen from the amount
of foreign investment in the economy, both in the
form of or direct investment foreign direct
investment (FDI), as well as portfolio (portfolio
investment). In the case of developing countries, FDI
has a vital role in the development and economic
growth of the country, as well as portfolio
investment. This condition runs along with greater
trade openness, which also triggers the growth of
Purwiyanta, . and Harjanto, A.
The Effect of Indonesian Economic Openness on Poverty Levels in Indonesia.
DOI: 10.5220/0009966803530358
In Proceedings of the International Conference of Business, Economy, Entrepreneurship and Management (ICBEEM 2019), pages 353-358
ISBN: 978-989-758-471-8
Copyright
c
2020 by SCITEPRESS – Science and Technology Publications, Lda. All rights reserved
353

direct investment and portfolio investment and has a
positive impact on the economic growth of
developing countries.
One of the problems faced by Indonesia as a
developing country is a large number of people who
are still living in poverty, both absolute and relative.
In 1970 the number of people living on the poverty
line (poverty line) numbered 70 million people,
decreased to 42.30 million people in 1980, 38.74
million people in 2000, and decreased to 31.02 in
2010 and 2017 there were 26, 587 million people.
The discussion about economic openness,
namely foreign factors in the Indonesian economy,
has created a polemic in the public sphere.
Specifically for foreign capital, there are pros and
cons, sometimes the debate is less constructive for
economic development. Based on the above
background, this study was conducted to analyze:
a. What is the effect of Indonesia's exports and
imports on poverty levels in Indonesia?
b. How does foreign direct investment in
Indonesia affect poverty levels in Indonesia?
c. How does the investment of Porto polio
abroad in Indonesia affect poverty levels in
Indonesia?
2 LITERATURE REVIEW
2.1 Economic Openness
The relevance of an economy to the global economy
implies that the economy is integrated into the world
market, both the goods market and the world capital
market. Calderon (2005) states that integration in the
global economy contributes to the potential benefits
of economic growth and prosperity. Economic
openness also means increasingly depleting
economic activity barriers between the domestic
market and foreign markets, both the goods market
(trade openness) and financial markets (investment
openness).
a. Trade Openness
Adam Smith explains the importance of trade
openness, where trade without restrictions can create
efficient use of resources and produce a country's
production surplus (exports). The value of trade
openness that is increasingly high is often
interpreted as a hint of a more open economy.
Measurements of trade openness can also be done
with the openness index of import(import
openness)and transparency index of export(export
openness). The import openness index is none other
than the ratio of imports to GDP, while the export
openness index measures the ratio of exports to
GDP.
b. Investment Openness
Asongu (2012), in his research entitled
"Globalization and Africa: Implications for Human
Development," measures the level of financial
openness based on the ratio of foreign investment to
gross domestic product. Simorangkir (2006), in his
study entitled "The Openness and Its Impact to the
Indonesian Economy: ASVAR Approach," measures
financial openness calculated from total foreign
direct investment and portfolio investment inflows
divided by GDP.
2.2 Poverty in Indonesia
Economically, poverty can be defined as a lack of
resources that can be used to meet the necessities of
life and improve the welfare of a group of people.
Resources in the economic context do not only
involve the financial aspects but include all types of
wealth that can improve the welfare of the
community in a broad sense.
Suharto (2006) says that there are three
categories of poverty which is the center of attention
of social work, namely:
a. The poorest group(destitute)or often defined as
poor. This group has income below the poverty line
(generally has no source of income at all) and does
not have access to various social services.
b. The poor(poor), a group who have incomes
below the poverty line, but relative to have access to
basic social services.
c. Vulnerable groups. This group can be
categorized as free from poverty because it has a
relatively better life than the destitute or poor group.
But this group that is often "near poor" (still poor) is
still vulnerable to various social changes around it.
They often move from "vulnerable" to "poor" and
even "status destitute" if there is an economic crisis
and do not get social assistance.
The Central Statistics Agency (BPS) uses the
poor limit of the amount of rupiah spent per month
per capita to meet the minimum food and non-food
needs. For the minimum food requirements, a
standard of 2,100 calories per day is used, while
non-food minimum expenditure expenditures
include spending on housing, clothing, and various
goods and services. Furthermore, to measure
poverty, applied basic needs approach is used, and
the HeadCount Index is. Measurement of poverty
with the basic needs approaches sees poverty as the
ICBEEM 2019 - International Conference on Business, Economy, Entrepreneurship and Management
354

inability to meet basic needs, whereas the approach
Head Count Index is a measure used to measure the
magnitude of absolute poverty.
The World Bank measures poverty using
different measures. The poor are those whose
income is measured by their purchasing power of
less than the US $ 1.90 per day (purchasing power
parity, 2011). Of course, this measure causes
poverty in Indonesia to differ from those calculated
by BPS.
The number of poor people is the number of
people below the threshold called the poverty line,
which is the rupiah value of minimum food and non-
food needs. Therefore, the poverty line consists of
two components, namely the food poverty line(food
line)and the non-food poverty line(non-food line).
2.3 Previous Research
Feriansyah's, Noer Azam Achsani, and Tony
Irawan (2018) have examined the effect of
Financial Liberalization on Macroeconomic
Volatility in the Asia-Pacific region. The dynamic
panel model was used in 19 countries in the Asia-
Pacific region during the period 1976-2015. The
results of the study prove that the benefits of
financial liberalization in the Asia-Pacific Region
are due to the low volatility of macroeconomic
variable growth only in the group of developed
countries, and not for the group of developing
countries. This result proves that the existence of
financial liberalization has not had a full beneficial
effect in the Asia-Pacific Region.
Financial openness in the Asia-Pacific region to
global financial markets has not had a positive effect
on the group of developing countries. That is, an
increase in financial openness in a group of
developing countries will further increase
macroeconomic volatility in that group. As for
developed countries, the results of their interactions
with financial openness show significant negative
results for all estimation results.
Nowbutsing (2014), analyzes the effect of
economic openness on economic growth in member
countries Indian Ocean RIM(IOR). The research
method used was the root unit panel and panel
cointegration for 15 countries (Australia,
Bangladesh, India, Indonesia, Kenya, Madagascar,
Malaysia, Mauritius, Mozambique, Seychelles,
Singapore, South Africa, Sri Lanka, Tanzania, and
Thailand) during the 1997 period until 2011. The
dependent variable of economic growth is
represented by the GDP of each country. While the
independent variable is the degree of trade openness
measured by the ratio of exports plus imports to
GDP, the level of openness of imports (imports as a
percentage of GDP), the level of openness of exports
(exports as a percentage of GDP), government
spending, gross capital formation, inflation, and
labor. The analysis shows that the three levels of
trade openness, the level of import openness, and the
level of export openness have a positive effect. The
level of import openness has the most influence on
economic growth. This is possible because most of
the IOR member countries are large importers in the
field of technology as well as raw materials and
supporting materials for industry.
Eunyoung (2012) studied the impact of trade
openness and foreign direct investment on income
inequality in developing countries. They are using
panel data from 1975 to 2005 from 59 developing
countries. The results of his research suggest that
trade openness and direct investment flows have a
significant effect on expanding income inequality in
developing countries.
That Daumal, Marie (2008) also conducted a
similar study conducted by Eunyoung, for the case
of India and Brazil. Based on the data time series
from 1980-2004 for the Indian case and 1985-2004
for the Brazilian case. The conclusion of his analysis
says that economic openness significantly decreases
inequality of income in the State of Brazil, but in the
case of the State of India quite the opposite,
economic openness increases inequality in India.
Murbarani, Nova (2014) has conducted a study
of the effect of economic openness on inequality
between provinces in Indonesia using panel data
from 26 provinces in Indonesia in 1994-2012. The
results of his research provide the conclusion that
economic openness has a significant influence on
income inequality in Indonesia. His research also
proves that the Kuznets Hypothesis, the relationship
between growth and inequality, which is described
as an inverted U curve, applies in Indonesia.
Tito Brian Adiputra (2017) conducted a study to
determine the effect of economic openness
consisting of trade openness and financial openness
on the index of human development through
economic growth in Indonesia. By using time series
data(time series)from 2000 until 2015. The research
shows that that only financial openness that has a
significant influence improves the human
development index through economic growth in
Indonesia, while no effect of trade openness.
Delis, Arman, et al. (2015) conducted a study
of the effect of Foreign Direct Investment (FDI)
on Unemployment and Poverty in Indonesia, the
period 1993 to 2013. His research concludes that
The Effect of Indonesian Economic Openness on Poverty Levels in Indonesia
355

FDI has a negative and significant effect on the
number of poor people, and FDI has a negative
effect but not significant to the number of
unemployed.
3 RESEARCH METHODS
Data used are secondary time series data, from 1998
to 2017, namely data on Indonesia's poverty rate,
Export and Import Ratio to GDP, FDI to GDP Ratio,
portfolio investment to GDP ratio. The data is
sourced from the World Bank. The relationship
between the variables of Indonesia's economic
openness to poverty in Indonesia is formulated as
follows:
Y = f (X
1
, X
2
, X
3
,) ……………… (1)
Where: Y = Poverty rate in Indonesia (%)
X
1
= Export and Import Ratio to Indonesian GDP
(%)
X
2
=Ratio Foreign Direct Investment to Indonesian
GDP (%)
X
3
=ratio Portfolio investment to GDP of Indonesia
(%)
The model will be used to examine and analyze
the relationship between the dependent and
independent variable error correction model(error
correction Model - ECM). While the error correction
model (ECM) is the right model if the data time
series used is not stationary (Widarjono. 2013). The
error correction model (ECM) is formulated as
follows:
Y = β
0
+ β
1
DX
1t
+ β
2
DX
2t
+ β
3
DX
3
+ β
4
DX
4
+ β
5
ECT + e
……………….
(2)
Where; β
0
= intercept
β
1,
β
2,
β
3,
= regression coefficient
D = first level difference (fist
difference)
ECT = error of imbalance
The econometric statistical steps required
concerning data time series in this study are the unit
root test (unit root test) to see the stationarity of
data. After the unit root test is then performed
cointegration test to determine the possibility of a
long-term balance or stability between the dependent
variable (growth of Indonesian foreign exchange
reserves) with the independent variables in the
model (X1
,
X2
,
X3
,
).
a. (Unit root test unit root tests were)
Performed with the test Augmented Dickey-
Fuller (ADF). If the absolute value of the ADF
statistic is greater than the critical value, the
observed data indicates stationary. Otherwise,
the data is not stationary if the absolute value
of the ADF statistical value is smaller than the
critical value.
b. Cointegration Test Cointegration
The test is done by Johansen's cointegration
test, where Johansen suggests a maximum
estimator likelihood for Q and R and a
statistical test to determine the cointegration
variable r. The presence or absence of
cointegration is based on the test likelihood
ratio (LR). If the calculated LR value is
smaller (<) than the critical value of LR, then
there is no cointegration, and vice versa, if the
calculated LR value is greater (>) than the
critical value of LR, then it is co-integrated.
4 RESULTS
Test results stasionaritasagainst variables analyzed
produced simpilan that all the variables stationary at
first difference. Cointegration test results provide an
indication of the long-term cointegration of the data.
Therefore the error correction model reflected in
equation (2) can be estimated. The estimation results
of the equation are presented in Table 1.
From the estimation results, it is known that the
coefficient value of ECT, shows a statistical
significance, then the model specifications used are
valid. The classical assumption test results also show
that this model is free from heteroscedasticity and
autocorrelation problems. From the estimation
results, it is known that only the variable degree of
openness in the field of trade (X1), which has a
significant influence on poverty in Indonesia. The
degree of financial openness, both variable X2 (FDI)
and X3 (portfolio investment), both have no
significant effect on poverty in Indonesia.
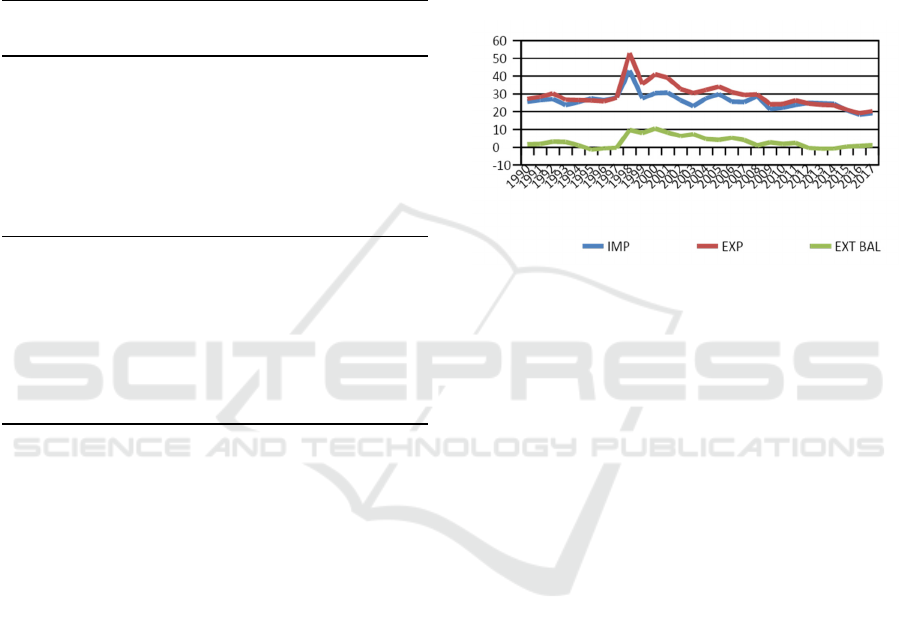
The openness of the Indonesian economy in the
field of trade (X1), measured by the ratio of exports
and imports to GDP. This variable is nothing but the
external balance of goods and services (External
balance on goods and services). Based on data from
1990-2017, fluctuations in Indonesia's exports and
imports tend to be in line, and inline (Figure 1). The
positive relationship of external balance with
poverty in Indonesia can be interpreted that if the
ratio of the surplus of goods and services balance to
GDP is higher, then poverty in Indonesia will
ICBEEM 2019 - International Conference on Business, Economy, Entrepreneurship and Management
356
increase. This tendency must, of course, be
addressed wisely, bearing in mind that Indonesia has
entered into bilateral agreements to open up its
economy widely, such as the MEA, APEC, and
WTO agreements, which aim to expand market
access.
Table 1:Result of Estimated Error Correction Model-ECM
Dependent Variable: D (Y)
Method: Least Squares
Variable Coefficient Std. Error t-Statistic Prob.
C
0.906986 -
2.287462
0.0382 -2.074696
D (X1) 1.613625 0.616793 2.616155 0.0203
D (X2) -0.425048 0.891387 -0.476839 0.6408
D (X3) -0.947886 1.031233 -0.919178 0.3736
ECT -0.756322
0.136744 -5.530957 (-1) 0.0001
R-squared 0.727404 Mean dependent var -3.210526
Adjusted R-squared 0.649519 SD dependent var 6.332622
SE of regression 3.749003 Akaike info criterion 5.701791
Sum squared resid 196.7704 Schwarz criterion 5.950328
Log-likelihood -49.16702 Hannan-Quinn criterion. 5.743854
F-statistic 9.339498 Durbin-Watson stat 0.991198
Prob (F-statistic) 0.000681
Source: Data processed, 2019
Technically so that the impact of openness on
trade in goods and services does not increase
poverty, what needs to be maintained is the ratio of
external equilibrium to GDP maintained at zero
range (or low) or not in the range that is not too
extreme. This can be achieved by:
a. Spurring economic growth beyond export and
import growth
b. Keeping the external balance surplus at a low
range.
c. Maintaining a balance in goods and services
transactions,
Policies that encourage the growth of goods
exports can be used to create a trade balance surplus
and eliminate the service account deficit that has
been occurring so far. Government policies can be
fully directed towards increasing productivity and
reducing inefficiency and increasing
competitiveness. In the long run, government policy
is more directed at fulfilling domestic services by
building a domestic service industry that is robust,
developed and developing, and capable of
contributing to the achievement of a trade surplus in
services.
Openness in financial markets, both foreign
direct investment (FDI) and portfolio investment,
does not have a significant effect on Indonesian
poverty. Further investigation shows that there is no
causality between FDI and poverty in Indonesia.
FDI does not cause poverty in Indonesia. Likewise,
with portfolio investment, there is no causal
relationship between portfolio investment and
poverty. Portfolio investment does not cause poverty
in Indonesia.
Figure 1: Indonesia's Exports, Imports, and External
Equilibrium (% of GDP), 1990 -2017
Thefacts found in this model are that trade
openness (goods and services) to the foreign
economy influences poverty levels in Indonesia.
This tendency more or less provides reinforcement
to the conclusions of the study conducted by
providing support for the results of this study
Eunyoung (2012), Dat Daumal, Marie (2008), and
Murbarani, Nova (2014). Economic openness in the
field of trade is a necessity, but it must still be
sought so that the social impact, especially on
poverty levels, must still be reduced.
5 CONCLUSIONS
The hypothesis that openness in the Indonesian
economy, especially openness in trade, can increase
poverty levels in Indonesia is indeed proven.
However, economic openness in the financial sector
does not contribute to increasing/decreasing poverty
in Indonesia. To reduce the impact of trade openness
on poverty in Indonesia, it is necessary to pay
attention to Indonesia's economic growth rate, which
must be greater than the growth of Indonesia's goods
and services balance.
The Effect of Indonesian Economic Openness on Poverty Levels in Indonesia
357

REFERENCES
Agus Widarjono, 2013: Introduction to Econometrics and
their Applications, Fourth Edition, UPP STIM YKPN
Publisher, Yogyakarta.
Adiputra, Tito Brian, 2017: "The Effect of Economic
Openness on the Indonesian Human Development
Index, Year 2000-2015", Thesis, Hasanudin
University, Makassar.
Arman Delis, Candra Mustika, Ethics of Umiyati, 2015:
"The Effect of FDI on Poverty and Unemployment in
Indonesia", Journal of Economic Paradikma, Vol.10,
No. 0
Asongu, SA, 2012: "Globalization and
Africa: Implications for Human Development", AGDI,
Working Paper.
Chinn, Menzie D, and Hiro Ito, 2008: " A New Measure of
Financial Openne". Journal of Comparative Policy
Analysis, Volume 10, Issue 3,
Calderon, Cesar, 2004: "Trade Openness and Real
Exchange Rate Volatility: Panel Evidence Data",
Central Bank of Chile, Working Papers 294.
Daumal, Marie, 2008: Impact of Trade Openness on
Regional Inequality and Political Unity: the Cases of
India and Brazil. Paper Dauphine Paris University,
Paris
Deliarnov. 2012: "Development of Economic Thought".
Rev.ed .. Jakarta: Rajawali Press.
Feriansyah, Noer Azam Achsani, and Tony Irawan, 2018:
"The Effects of Financial Liberalization on
Macroeconomic Volatility in the Asia-Pacific
Region", JEPI Vol. 18 No. 2
Ha, Eunyoung, 2012: Globalization, Government
Ideology, and Income Inequality in Developing
Countries. The Journal of Politics, Vol. 74, No. 2
Kalemli-Ozcan, S., & Sørensen, B. 2003: Financial
Integration and Economic Welfare.
http://econweb.umd.edu/∼kalemli / assets / books /
SorensenKalemli-Ozcan Feb9 06.pdf.
Murbarani, Nova. 2014: "The Effect of Economic
Openness on Interprovincial Inequality in Indonesia".
Thesis. Gadjah Mada University, Yogyakarta.
Nowbutsing, Baboo M. 2014: "The Impact of Openness on
Economic Growth: Case of Indian Ocean Rim
Countries" Journal of Economic and Development
Studies. Vol.2, No.2, pp. 407-427.
Salim and Budi Sutrisno. 2008: "Investment Law in
Indonesia" Jakarta: PT Raja Grafindo Persada,
Jakarta
Suharto, Edi. 2006: "Public Policy Analysis: A Practical
Guide to Assessing Problems and Social Policy",
Alfabeta, Bandung
ICBEEM 2019 - International Conference on Business, Economy, Entrepreneurship and Management
358
