
Identification of Cumulonimbus Cloud using Sensor Data of NOAA
Satellite Captured by Low Cost Flower Cross Dipole
Yenniwarti Rafsyam
1
, Lingga Ghufira Oktariza
1
, Jonifan
2
, Indra Z.
1
, and Eri Ester Khairas
1
1
Department of Electrical Engineering, Jakarta State Polytechnic
2
Physics Laboratory Gunadarma University
Keywords: kernel-erison method, omnidirectional radiation pattern, right hand circular polarization
Abstract: The implementation of a flower cross dipole could be a promising candidate to receive any information from
NOAA satellite in certain frequency. Flower cross dipole was designed to work in 137 MHz frequency. This
work urgently discusses about identification of cumulonimbus cloud based on NOAA satellite sensor data
which was received by flower cross dipole. The detection system has been developed by real-time monitoring
based on NOAA satellite sensor data, then convert to cloud image. The further study would be focus on
cumulonimbus cloud which causes bad weather in a region. The identification result was validated by
Meteorological, Climatological, and Physical Agency of Indonesia and analyzed by kernel-erison method.
The overall results indicate the flower cross dipole has 1.58 VSWR value with -12.85 dB return loss. In other
hand, the flower cross dipole produced omnidirectional radiation pattern with 11.8 MHz bandwidth and 2.307
dB gain. The low-cost flower cross dipole only has 52.59 cm length with unique and simple design to be
produced.
1 INTRODUCTION
Weather conditions are meteorological elements that
have a high variation in scale of space and time, so it
is difficult to predict. However, weather information
is very important and needed by almost all fields such
as agriculture, transportation, plantations, to early
warning of natural disasters, floods, landslides, and
drought (Sun, 2016). Information on weather
conditions is still limited, one of which is due to
difficult data access. Therefore, we need a technology
system that can determine the exact state of the
national weather. Satellite technology is a necessity
that cannot be avoided anymore at this time because
satellite data is able to quickly display data with wide
coverage.
The National Oceanic and Atmospheric
Administration (NOAA) is a USA scientific agency
that has 19 satellites. The main activity of these
satellites is to observe the ocean and atmosphere on a
global scale (Bosquez, 2016). Hence, it is able to
monitor the territorial waters of Indonesia with a
broad scope for the benefit of weather monitoring.
NOAA satellites are at an orbit altitude of 833-870
km with inclination around 98.7 ° - 98.9 °. NOAA
took aerial photography at around 16:00 to 17:00
WIB. From the images taken by NOAA satellites, it
can be processed so that cloud types and weather
predictions are classified (Rafsyam, 2017) (Rafsyam,
2017). Cumulonimbus clouds are a type of
condensation cloud formed from water vapor and
carried by the wind. The danger of these clouds is it
can produce thunder and bad weather which is usually
found in the tropics area (Sun, 2016) (Dian, 2014)
(Rafsyam, 2017) (Rafsyam, 2071). In addition to bad
weather and lightning, these clouds are also
accompanied by ice and have very cold temperatures.
To detect and predict cumulonimbus clouds, sensor
data is needed from NOAA satellites that cross
Indonesia 2-4 times in 1 day. Hence, NOAA satellite
sensor data can observe the detection of
cumulonimbus clouds in real time (Rafsyam, 2017)
(Rafsyam, 2017).
Earth stations, the satellite signal receiver system
from NOAA satellites with a specified frequency,
have been developed in this work. The earth station
system consists of an omnidirectional antenna to
capture NOAA signals that are connected to a
processing system software. Cross Dipole Antenna is
an omnidirectional system that produces singular
radiation patterns that can receive signals from all
directions. On the other hand, transmissions from
138
Rafsyam, Y., Oktariza, L., Jonifan, ., Z, I. and Khairas, E.
Identification of Cumulonimbus Cloud using Sensor Data of NOAA Satellite Captured by Low Cost Flower Cross Dipole.
DOI: 10.5220/0009968100002905
In Proceedings of the 8th Annual Southeast Asian International Seminar (ASAIS 2019), pages 138-143
ISBN: 978-989-758-468-8
Copyright
c
2022 by SCITEPRESS – Science and Technology Publications, Lda. All rights reserved
NOAA satellites using right hand circular
polarization (RHCP) (Geeta, 2015). Cross dipole
antenna has high gain with circular polarization.
Therefore, antenna design must have a working
frequency of 136 - 138 MHz, impedance of 50 ohms,
and a minimum gain of 12 dBi (Dian, 2014) (Shi,
2016) (Rafsyam, 2017). Sensor data captured by the
dipole antenna should be delivered to a single rectifier
(Vignesh, 2016). The signal is processed by the
software and analyzed using the kernel erison method
to show the comparison of cloud validation from
BMKG with the cloud image analysis results from the
receiver.
2 SYSTEM DESIGN
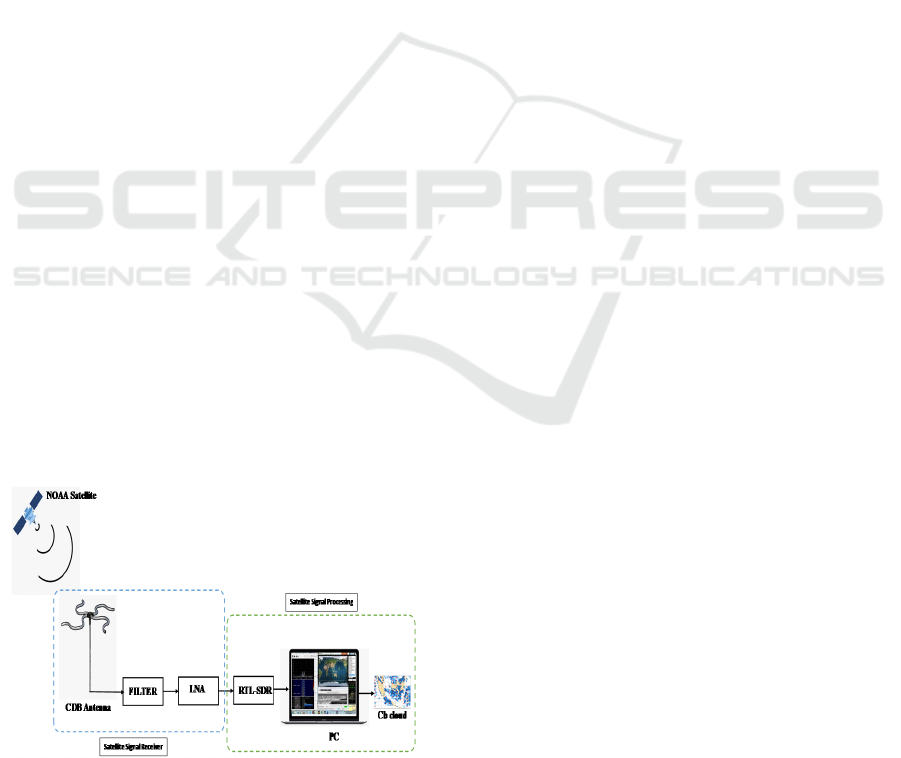
The system design of the earth station is shown in
Figure 1, consisting of a satellite signal receiver and
processing of the 137.9 MHz NOAA satellite signal
which is real-time and can be accessed anytime and
anywhere. In other hands, the flower cross dipole is
designed in several stages before it can be used as a
NOAA satellite signal receiver. In overall, the
calculation of the length of the antenna element that
can work at frequencies 137-138 MHz and simulates
the antenna design based on the calculation results.
Finally, if it matches the simulation results, the
antenna design is fabricated to be tested and
validated.
Figure 1, the design of a receiver system which
is a system flow diagram for receiving data signal
information received from satellites. Data acquisition
systems can automatically detect and receive
information signals from satellites when passing
through the system. The information signal is
captured by the flower cross dipole and then
separated from the carrier by the receiving radio.
Figure 1: System design of Flower Cross Dipole as sensor
data receiver from NOAA satellite
After the information signal is obtained, the
sound card will work to convert analog data into
digital data. Then the digital signal is processed and
recorded in the form of wav files. This file will then
be used at a later stage, namely image processing. The
signal that is obtained is the sound signal and then
converted to an image.
Then this image can be reprocessed so that it can
detect cumulonimbus clouds (clouds that have the
potential to rain). In satellite signal processing,
WxtoImg, python programming and library opencCV
software is used. The data that is already in the form
of a WAV file is processed further using WxtoImg to
produce an image that has information on the state of
the cloud which will later be reprocessed by openCV
python so it can automatically detect that area has a
cumulonimbus cloud.
3 RESULT AND DISCUSSION
The flower cross dipole as shown in Figure 2, is an
omnidirectional and right circular polarized antenna
that can be proven in the analysis of the antenna test
results shown on the Figure 3. This exactly matches
the antenna pattern from the satellite. The radiation of
cross dipole antenna basically generated from two
orthogonal half-wavelength dipoles fed by two
sources with magnitude 90
o
phase difference (Xu,
2016) (Bhaskar 2018). The basic cross dipole is
modified in each side of the cross dipole. In figure 3,
shows the radiation pattern with the parameters of
power received by the flower cross dipole and plotted
from an angle of 10
o
to 360
o
. If observed in the
horizontal plane and vertical plane, the flower cross
dipole can receive energy distributions that tend to be
the same from all angles. So, the antenna radiation
diagram pattern can be illustrated like a spherical.
This indicates that for the capture of signals from
satellites, the signal's incoming direction can be
received by the flower cross dipole from all
directions.
Identification of Cumulonimbus Cloud using Sensor Data of NOAA Satellite Captured by Low Cost Flower Cross Dipole
139
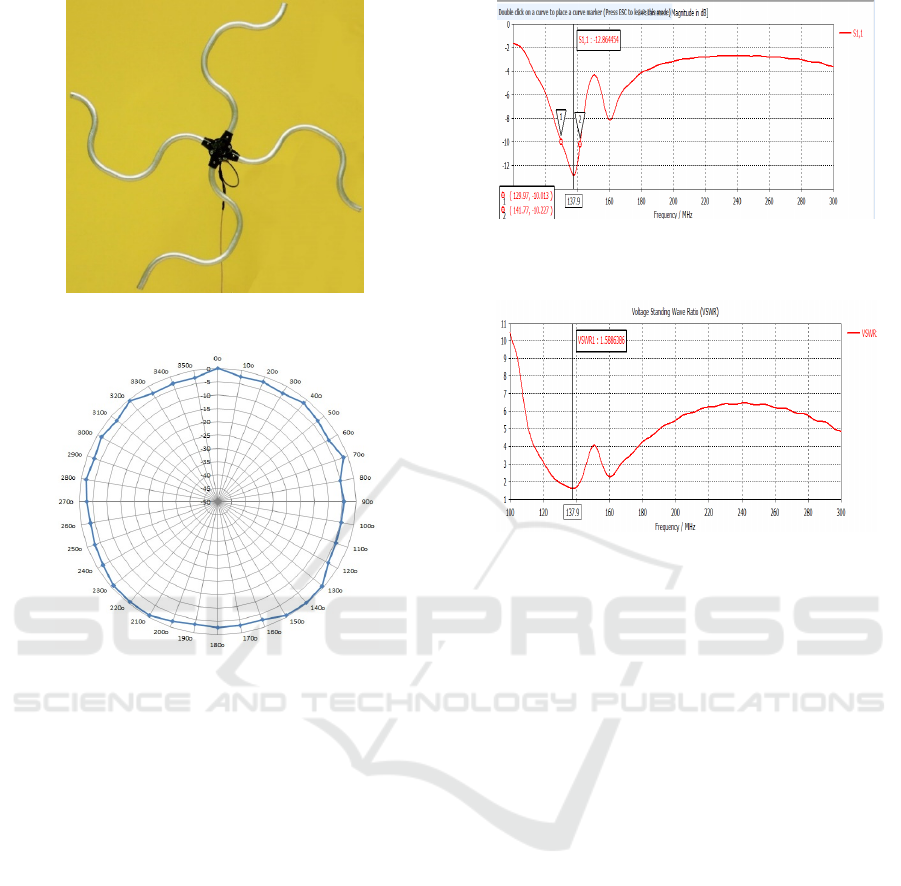
Figure 2. Flower Cross Dipole from above.
Figure 3. Test result of radiation pattern
In antenna testing, the measured parameter is the
amount of energy reflected to the antenna by
measuring the value of S11 or return loss and VSWR
flower cross dipole at a frequency of 137 MHz to 138
MHz. By knowing the amount of return loss, the
amount of energy that can be received by the antenna
can be determined. Antenna test results for the return
loss parameter is shown in Figure 4, resulting in a
return loss value of -12.85 dB. From Figure 4, the x
axis shows frequency and y axis shows return loss,
with detected frequency range 100-300 MHz. Return
loss is known as the ratio of reflected power from a
load to the power on that load and expresses in dB
(Cui, 2014). Return loss provides is helpful, as it
provides a real valued measure of load match.
Another parameter of the load match traditional real
valued measure is voltage standing wave ratio
(VSWR).
Figure 4: Simulation test result of Flower Cross Dipole in
return loss
Figure 5: Simulation test result of Flower Cross Dipole
VSWR parameters
Figure 5 shows the antenna test results for the
VSWR parameter which produces a value of 1.58.
The VSWR value is a conversion of the S11 value
which shows the ratio of the maximum stationery
wave voltage to the maximum travelling wave
voltage that occurs on the flower cross dipole when
capturing satellite signals. With a VSWR value of
around 1.5, the antenna is good enough to be used as
a cross dipole antenna. The antenna test results for the
S11 and VSWR parameters are validated and shown
in Figure 6 which shows the flower cross dipole can
capture satellite signals at 137.9 MHz with the same
value of S11 and VSWR as the test results in Figure
4. Gain which obtained from the simulation results
was 2.307 dB with frequency 137.9 as shown in
Figure 5.
ASAIS 2019 - Annual Southeast Asian International Seminar
140
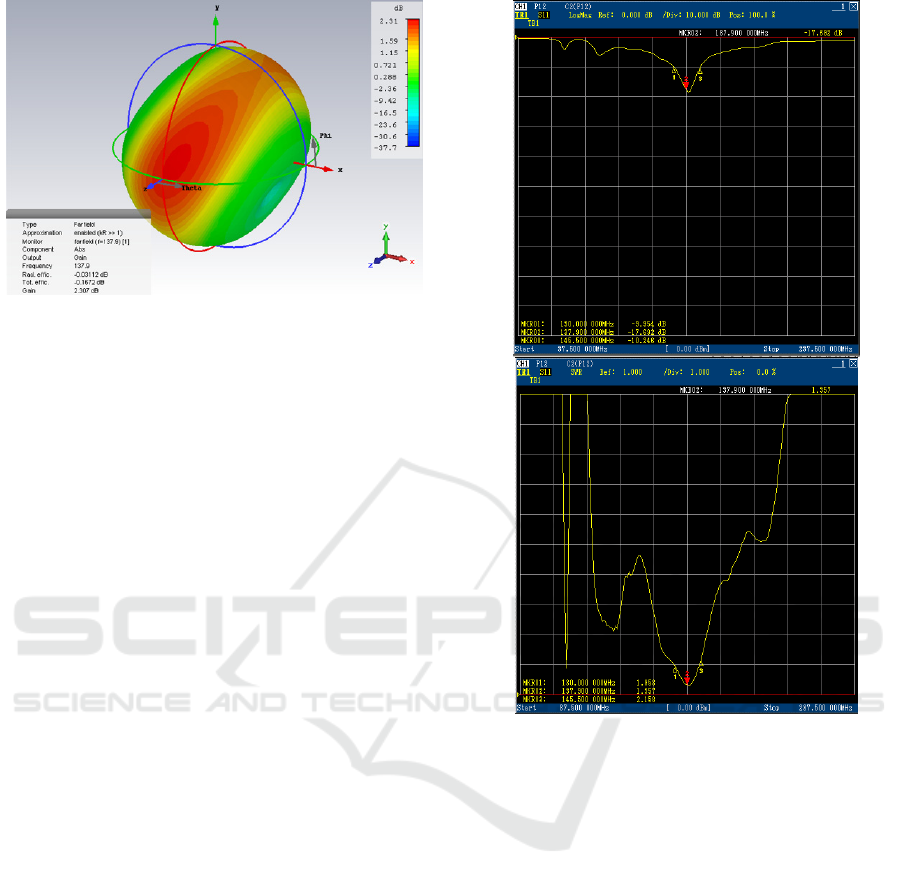
Figure 6: Radiation pattern of Flower Cross Dipole as
receiver
Basically, NOAA satellites record an area by
receiving Advanced Very High Resolution (AVHRR)
data from satellites in the form of 2-4 raw data in one
day. In this study, the flower cross dipole received
NOAA satellite sensor data and was carried out by
following the NOAA satellite schedule that passed in
the territory of Indonesia (Rafsyam, 2017)
2
. NOAA
satellites that are currently active are NOAA 15,
NOAA 18 and NOAA 19 (Uengtrakul, 2014). Test
that have been carried out by connecting the flower
cross dipole with the RTL-SDR dongle is used to
receive signals sent by NOAA satellites (Uengtrakul,
2014).
Figure 7 show us the validation of result of the
flower cross dipole after fabricated. The result of the
parameters are -17, 692 dB of return loss and 1,357
of VSWR. This result performs better than simulation
value which the return loss is below -10 dB while the
VSWR is below 1.92 (Kaur, 2016). The reference
values realize polarization conversion of the reflected
wave, the reflected and directed wave emitted from
flower cross dipole will generate polarization wave,
like circular polarization (Chen, 2015).
Figure 7: Validation result of Flower Cross Dipole
The cumulonimbus cloud detection test aims to
detect cloud from the cloud color gradation
parameters formed. The cumulonimbus clouds with a
wide range of dense clouds with white light color
indicates bad weather conditions in an area. Results
from Signal catched from NOAA satellites 18 in the
form of sound are recorded with the help of SDR
Sharp software (Bosquez, 2016). The software reads
the signal level received at different times and days.
After that the recorded sound signal is converted into
image form with WXtoImg (Mahmood, 2016). The
results of this image will be analyzed and validated
with BMKG data. Image analysis is shown in Figure
8 using the OpenCV Python kernel 2x2.
Cumulonimbus clouds detection can be determined
from the color and gradient of clouds formed in
Figure 8 and most colors of cumulonimbus clouds are
white light. Based on the validation with BMKG data
in Figure 7, the results of the detection of
cumulonimbus clouds by using a flower cross dipole
Identification of Cumulonimbus Cloud using Sensor Data of NOAA Satellite Captured by Low Cost Flower Cross Dipole
141
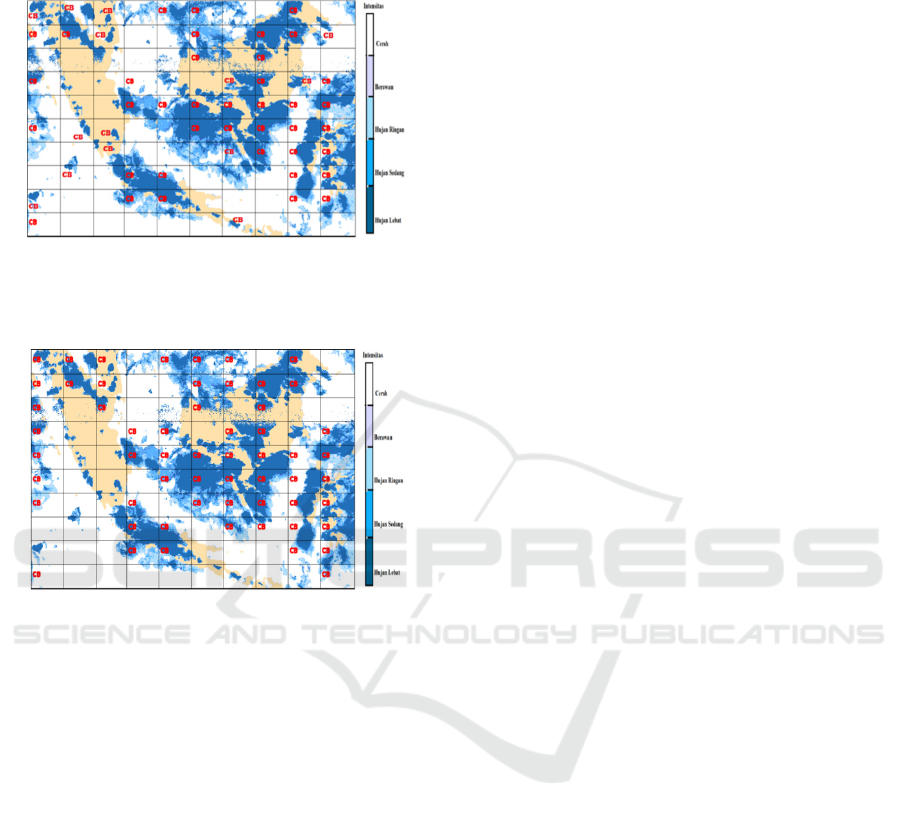
as a NOAA satellite signal receiver have 9% error of
Figure 9.
Figure 8: Meteorological, Climatological, and Physical
Agency of Indonesia validation
Figure 9: Image processing result using openCV Python
kernel (2x2)
4 CONCLUSION
In this study, fabrication of flower cross dipole with a
working frequency of 137.9 MHz was successfully
tested and validated with several parameters such as
VSWR, S11, and gain. The radiation pattern formed
is omnidirectional, so that it can receive signals and
waves from all directions. Signal processing that has
been received by the antenna is validated with the
BMKG image results and the percentage of error
resulting from image processing is 9%. Hence, the
flower cross dipole can be used as a candidate for
satellite receiver signals at a working frequency of
137.9 to detect bad weather due to the presence of
cumulonimbus clouds in an area. Moreover, the
flower cross dipole is a low-cost antenna with
aesthetically unique design and shape.
ACKNOWLEDGEMENT
This research is supported by research grand from
Simlitabmas RISTEKDIKTI and P3M Politeknik
Negeri Jakarta (PNJ) with research program No
023/SP2H/LT/DPRM/2019.
REFERENCES
Bhaskar S, Singh A. K., (2018). Linearly Tapered Meander
Line Cross Dipole Circularly Polarized Antenna for
UHF RFID Tag Applications. Int J RF Micro Comput
Aided Engineering. Wiley Pub. 21563
Bosquez, et al (2016). System for Receiving NOAA
Meteorological Satellite Images using Software
Defined Radio. IEEE. Vol 16.
Chen, C. et al (2015) A Circularly-polarized Metasurfaced
Dipole Antenna with Wide Axial Ratio Beamwidth and
RCS Reduction Functions. Progress in
Electromagnetics Research. Vol 154, 79-85.
Cui. Y, Li. R, and Fu. H. (2014). A Broadband Dual-
Polarized Planar Antenna for 2G/3G/LTE Base
Stations. IEEE Transactions on antennas and
propagation, Vol 62, No 9.
Dian, L.A (2014). Making Map of Rainfall Potential by
Using Satel lite Images of Mtsat in Java Island. Journal
of Geodesy Undip January 2014. Vol 3, No. 1, pp.130.
Gheeta. Dutta, B, R. et al (2015). Parametric Study of
Frequency Selective Surfaces at 5.8 GHz Using
Jerusalem Cross for Microstrip Circular Patch Antenna.
IJISET. Vol 2 Issue 3, March 2015.
Kaur, S. et al (2016) Compact Printed Dipole Antenna with
Low Return Loss and Return. International Journal of
Scientific Research engineering & Technology
(IJSRET). Vol 5, No 11.
Mahmood, S. et al (2016) Cost Efficient Design Approach
for Receiving the NOAA Weather Satellites Data.
IEEE. Vol 16.
1
Rafsyam, et al (2017). Miniaturization Cross Dipole
Antenna based on Helix and Meander Structure for
NOAA Receiver Application. International Journal of
Applied Engineering Research ISSN 0973-4562
Volume 12, Number 18 pp. 7927-7332
2
Rafsyam, Y. et al (2017). Design of Cross Dipole Antenna
Frequency 137 Mhz for NOAA Satellite Receiver. Teg
6 th Annual South East Asian International.
Shi, M., Xie, F., et al (2016). Cloud Detection of Remote
Sensing Images by Deep Learning. IEEE.
Sun, L. Gan, P., et al (2016) A Cloud Detecttion Algorithm-
Generating Method for Remote Sensing Data at Visible
to Short-Wave Infrared Wavelengths. ISPRS Journal of
Photogrammetry and Remote Sensing. Science Diret
Vol 124, pages 70-88.
Uengtrakul, D. B. (2014). "A Cost-Efficient Software
Defined Radio Receiver for Demonstrating Concepts in
Communication and Signal Processing using Python
and RTLSDR," in IEEE Fourth International
ASAIS 2019 - Annual Southeast Asian International Seminar
142

Conference on Digital Information and Communication
Technology and its Applications (DICTAP).
Vignesh, S, B. Nasimuddin, Alphones, A (2016). Circularly
Polarized Strips Integrated Microstrip Antenna for
Energy Harvesting Applications. Microwave and
Optical Technology Letters. Wiley Pub. Vol 58 No 5.
Xu, R. Li, J. Kum, W. (2016). A Broadband Circularly
Polarized Cross Dipole Antenna. IEEE.
Identification of Cumulonimbus Cloud using Sensor Data of NOAA Satellite Captured by Low Cost Flower Cross Dipole
143
