
Profile of Bioactive Compounds and Antioxidant Capacity of
Indonesian Cocoa Powder: A Case of Food Processing Authentication
Besty R. Ulvia
1
, Nuri Andarwulan
1,2
and Dase Hunaefi
1,2
1
Food Science and Technology Department, Faculty of Agricultural Engineering and Technology,
Bogor Agricultural University, Indonesia
2
Southeast Asean Food and Agricultural Science and Technology (SEAFAST) Center,
Bogor Agricultural University, Indonesia
Keywords: Antioxidant Capacity, Bioactive Compounds, Cocoa Powder, Manufacturing Process.
Abstract: One aim of food authentication for cocoa powder is to prove the manufacturing process. Cocoa powder is one
of the derivative products of cacao resulting from crushing and refining cocoa cake. Cocoa cake is processed
further through alkalization and/or grinded to become cocoa powder. The major bioactive compounds found
in cocoa powder are polyphenols and methylxanthines that potential to be sources of antioxidants. The
objectives of this research are to identify bioactive compounds and antioxidant capacity of Indonesian cocoa
powder from different sources for identifying the manufacturing process of alkalization. Profile of bioactive
compounds was identified by using HPLC-UV. DPPH and FRAP method was used for the quantification of
antioxidant capacity. Folin-Ciocalteau method was used for total phenolic content. The total phenolic content
of Indonesian cocoa powder ranged from 14.80 – 79.93 mg (GAE/g). Antioxidant capacity using DPPH
method ranged from 91.67 – 362.24 (µmol TE/g) and FRAP method ranged from 249.16 – 1000.95 (µmol
Fe
2+
/g). The average content of theobromine in cocoa powder ranged from 1.89 – 3.14 (mg/g) respectively.
For caffeine content, ranged from 0.12 – 0.46 (mg/g). Levels of (+)-catechin in 9 samples ranged from 0.04
– 1.10 (mg/g) respectively. Whereas the average content of (-)-epicatechin ranged from 0.04 – 4.68 (mg/g).
Strong positive correlation with Pearson test was established between total phenolic content and antioxidant
capacity with (R
2
= 0.99) for DPPH and (R
2
= 0.97) for FRAP. Higher total phenolic content indicates higher
antioxidant capacity. Analysis of PCA divides the sample based on similarity of chemical characteristics. The
right quadrant on PCA analysis was a group of natural cocoa powder, illustrates the similarity of color and
higher content of theobromine, (-)-epicatechin, caffeine, and fat content. The left quadrant was a group of
alkalized cocoa powder, illustrates the similarity of higher pH and (+)-catechin content of Indonesian cocoa
powder.
1 INTRODUCTION
One of the largest agricultural commodity in
Indonesia is cocoa. In 2014, Indonesian cocoa
production reached 728,414 tonnes with the largest
production found in Celebes approximately 484,387
tonnes. Cocoa widely used by the food industry as
raw materials in the field of confectionary and non-
confectionary. Cocoa derivative products include
cocoa paste, cocoa butter, cocoa cake, cocoa powder,
and chocolate products such as dark chocolate, milk
chocolate, and white chocolate. One of the cocoa
derivative products are widely used in the food
industry is cocoa powder.
A number of studies have been reported on the
benefits of cocoa powder to human health (Cooper et
al., 2008; Ramljak et al., 2005). Polyphenol
compounds contained in cocoa powder has potential
as an antioxidant that can significantly contribute to
human health (Abbe and Ismail 2010). The
polyphenol content of the cocoa powder has a high
correlation to the antioxidant capacity. Antioxidant
capacity of cocoa per serving is greater than green tea
or black tea (Joli’c et al. 2011). The main polyphenol
compounds in cocoa are flavan-3-ol, anthocyanine
and procyanidins where (+)-catechin and (-)-
epicatechin are the monomers of flavanol component
(Weisburger 2001). In vitro studies have shown that
the polyphenol content in cocoa powder can inhibit
Ulvia, B., Andarwulan, N. and Hunaefi, D.
Profile of Bioactive Compounds and Antioxidant Capacity of Indonesian Cocoa Powder: A Case of Food Processing Authentication.
DOI: 10.5220/0009977300002833
In Proceedings of the 2nd SEAFAST International Seminar (2nd SIS 2019) - Facing Future Challenges: Sustainable Food Safety, Quality and Nutrition, pages 97-105
ISBN: 978-989-758-466-4
Copyright
c
2022 by SCITEPRESS – Science and Technology Publications, Lda. All rights reserved
97

reactive species such as 2,2-diphenyl-1-
picrylhydrazyl (DPPH), 2,2'-azino-bis (3-
ethylbenzthiazoline-6-sulphonic acid; ABTS) and
superoxide radicals. The polyphenol content of cocoa
powder also can inhibit the lipid peroxidation and
chelate free pro-oxidant metal ions (Fe
2+
, Cu).
Cocoa products are also rich in methylxanthine
compounds such as caffeine, theobromine, and
theophylline (Rios et al., 2003). Theophylline is
found in very small quantities in cocoa products and
derivatives (Franco et al., 2013). Methylxanthine
compounds contribute to the bitter taste of the cocoa
product. According to Pinilla et al., (2015), the
combination of caffeine and theobromine in cocoa
has benefited as antitumor, anti-inflammatory and
protective action from cardiovascular disease.
Consumption of Indonesian cocoa powder is
expected to increase in the years 2016-2020 with an
average growth of 1.17% per year (Pusdatin, 2016).
The increasing consumption of Indonesian cocoa
powder not supported yet with the information about
the profile of bioactive compounds and antioxidant
capacity contained. Since the level of bioactive
compounds and positive effects of polyphenol,
methylxanthines in cocoa powder are affected by
alkalization process in the manufacturing and limited
information about it, the objectives of this research
are to identify bioactive compounds and antioxidant
capacity of Indonesian cocoa powder from different
sources for identifying the manufacturing process of
alkalization.
2 MATERIAL AND METHODS
2.1 Material
The main materials were cocoa powder samples
produced by PT. Ceres Industrial Company Bandung,
PT. Bumitangerang Mesindotama Tangerang,
household Industry KSU "Guyub Santoso" Blitar,
Aneka Food "Kopkar Sekar" Jember, Big Tree Farm
Bali, Tanjung Subur Farmer Group Padang, West
Sumatra, and bulk cocoa powder from Makassar,
South Sulawesi. Chemicals needed are acetone 80%
(Mallinckrodt, USA), reagent Folin-Ciocalteu 50%
(Merck, Germany), n-hexane, Na
2
CO
3
20%, glacial
acetic acid (Merck, Germany), gallic acid solution,
standard trolox (Sigma, Switzerland), standard
FeSO
4
.6H
2
O, distilled water, a solution of 300 mM
acetate buffer pH 3.6; TPTZ (2,4,6-tripyridyl-s-
triazine) in 40 mM HCL, the solution FeCl
3
· 6H
2
O
20mm, 10
4
mM DPPH reagent, methanol (Merck,
Germany), theobromine standard (Sigma, USA),
caffeine standard (Sigma, USA), (+)-catechin
standard (Fluka 22110), (-)-epicatechin standard
(Sigma E1753), metanol HPLC grade (Merck,
Germany) water HPLC grade (Merck, Germany).
2.2 Extraction Preparation
All samples were prepared for analysis as described
by Brcanovic et al., (2013) with slight modifications.
A mass of 2 g of cocoa powder was defatted with
hexane by using Soxhlet apparatus and the residue
was dried in oven 105
0
C 30 minutes. Defatted cocoa
powder (0.15 g) was then extracted with acetone/
water/ acetic acid (70.29.5.0.5 by volume) using a
sonicator (37 ° C, 10 min) and then centrifuged (1500
rpm, 10 min). The resulting supernatant was decanted
to a 10-mL volumetric flask and diluted with solvent
to the mark. The resulting supernatant here after
referred as extract of cocoa powder.
2.3 Fat, Color, and pH Analysis
Total fat of cocoa powder was determined by Soxhlet
apparatus. The color of cocoa powders was measured
by using Chromameter with Hunter Lab output
notation. the Hunter L scale measures degree of
lightness 0 (black) to 100 (light), the Hunter a scale
measures red to green with true red equal to +100 and
true green equal to -100, and the Hunter b scale
measures yellow to blue with true yellow equal to
+100 and true blue equal to -100. Analysis of pH was
conducted by using pH meter. 1 part of cocoa powder
dissolves with 10 part of water.
2.4 Total Phenolic Content (TPC)
The total phenolic content was determined by using
Folin-Ciocalteu method with gallic acid as standard
according to Miller et al., (2008). 1000 ppm of gallic
acid was prepared and diluted to concentrations
ranging from 50-600 ppm to create a standard curve.
For each analysis, 0.5 ml solution of gallic acid or
extracts of cocoa powder was added to 7.5 ml of
distilled water and 0.5 ml of Folin-Ciocalteu reagent
50% then vortexed. After that, 1 ml of 20% Na
2
CO
3
was added and incubated in the dark at room
temperature for 30 min. Total polyphenols were
measured from the absorbance at 755 nm. Total
phenolic content expressed in milligrams of gallic
acid equivalents per gram defatted cocoa powder.
2nd SIS 2019 - SEAFAST International Seminar
98

2.5 DPPH (1,1-diphenyl-2-
picrylhydrazyl) Assay
Antioxidant capacity with DPPH method was
determined by using a method described by
Brcanovic et al., (2013). DPPH reagent (10
-4
mol/L)
was dissolved using methanol. 0.5 ml of extracts
cocoa powder was added to 4.5 ml of reagent DPPH
then vortexed. The solution then performed
incubation for 30 minutes in a dark room. The color
change of solution was measured using UV-Vis
spectrophotometry at 520 nm. Trolox standard curve
ranging from 50-400 μM was used to calculate the
final result of DPPH. Antioxidant capacity of DPPH
method was expressed in micromoles Trolox
equivalents (TE) per gram defatted cocoa powder.
2.6 FRAP (Ferric Reduction
Antioxidant Power) Assay
FRAP assay was measured by using methods of
Benzie and Strain (1996). FRAP reagent was
prepared from 2.5 ml of 10 mM TPTZ (2,4,6-
tripyridyl-s-triazine) solution in 40mM hydrochloric
acid with 2.5 mL of 20 mM iron (III) chloride and 25
ml of 300 mM acetate buffers at pH 3.6. The FRAP
reagent was prepared fresh daily and warmed to 37
°C in a water bath. 200 µL of cocoa powder extract
was added to 1.3 ml of FRAP reagent and allowed to
react 30 minutes in 37 °C water bath. The absorbance
of the reaction mixture was recorded at 593 nm using
UV-Vis spectrophotometer. The standard curve was
constructed using ferrous sulfate with concentrations
ranging from 50-400 μM and the result was expressed
in micromol ferrous equivalent per gram defatted
cocoa powder.
2.7 Analysis of Individual Bioactive
Compounds using HPLC
Individual bioactive compounds were determined
using an RP-HPLC (Shimadzu SPD-20A).
Determination of individual phenolic compounds
((+)-catechin and (-)-epicatechin)) and
methylxanthines (theobromine and caffeine) was
performed according to the method described by
Ramli et al., (2001). Separation was performed with
C18 (150 mm ID x 4.6 mm, 5 m) column, at flow rate
1 mL/min and an injection volume of 20 µL.
Detection was performed by scanning at 280 nm.
Isocratic elution was used in this method with mobile
phase Methanol: water: acetic acid (20: 79: 1) at
runtime 17 min.
The standard mixture used as a standard for
calibration curve. 50 mg of each standard consisting
of theobromine, (+)-catechin, caffeine and (-)-
epicatechin was weighed then dissolved using mobile
phase in a 25 ml volumetric flask. Mix standard curve
has five points using a dilution series ranging from 10
- 160 ppm. Extracts of cocoa powder prior to use was
filtered by using PTFE 0.45 μm microfilter to prevent
any impurities. Identification was carried out by
comparing the retention times with standards.
Quantitative determination of individual bioactive
compounds in the sample was done using calibration
lines of standard curves.
2.8 Statistical Analysis
All determination was carried out in two replication
and each replication was measured in duplicates. Data
were subjected to one-way analysis of variance
(ANOVA) and the level of significance of (p < 0.05)
using SPSS version programs. The Duncan's Multiple
Range Test (DMRT) was used to separate the means.
A significant difference was considered at level (p <
0.05). Correlations between each analysis were
conducted by Pearson test. Principal component
analysis (PCA) was used to make the results more
easily interpretable.
3 RESULTS AND DISCUSSION
3.1 Characteristics of Total Fat, pH,
and Color of Cocoa Powder
Cocoa powder is divided into two types, natural cocoa
powder and alkalized cocoa powder. Dutch process or
alkalization process performed by washing cocoa
powder with a solution of potassium which aims to
neutralize the acidity of the cocoa beans, relieve
astringent flavor, and initiate the reaction between
pigment cocoa with alkali due to the presence of
oxygen and heat that caused a reddish brown color to
a dark color or often called dark cocoa (Dyer 2003).
The darker the cocoa powder and the higher the pH
contained in cocoa powder indicated a high degree of
alkalization. Characteristics of pH, color and fat
content of Indonesian cocoa powder is presented in
Table 1.
The powders range from pH 4.90 for sample 8, to
pH 8.10 for sample 4. Cocoa powders have been
grouped by pH ranges, described by Miller et al.,
(2008) into lightly alkalized (pH 6.5-7.2), medium
alkalized (pH 7.21-7.60), and heavily alkalized (pH
7.61). Total fat ranged from 11.27 – 37.57 %. Total
Profile of Bioactive Compounds and Antioxidant Capacity of Indonesian Cocoa Powder: A Case of Food Processing Authentication
99

fat contained by alkalized cocoa powder was higher
than natural cocoa powder samples. Color
measurement of cocoa powder by Chromameter with
Hunter Lab notation scale shows L scale value
decrease on alkalized cocoa powder. The results
show that natural cocoa powders a bright color
appearance and alkalized cocoa powder has a darker
color. 1, 2, 3, 4 and 5 has a darker color and higher
pH (> 7) than the other samples. This indicates those
samples had undergone a process of alkalization.
3.2 Total Phenolic Content
Analysis of total phenolic in cocoa powder uses
Folin-Ciocalteau method. The total phenolic content
based on data obtained in Table 2 ranging from 14.80
- 79.93 mg Gallic Acid Equivalent per gram of
defatted cocoa powder dry basis. Results of total
phenolic content were supported by research from
Ramli et al., (2001) that was 20 - 62 (mg GAE / g)
and Miller et al., (2008) that was 7 - 63 (mg GAE/g).
The total phenolic content of samples from the
various regions and brands in Indonesia have
significant differences value (P <0.05). The highest
value of TPC was shown by sample 9 from West
Sumatra (0.37 ± 79.93 mg GAE / g) and the lowest
value was shown by sample 4 from Tangerang (14.80
± 0.23 mg GAE/g). Alkalized cocoa powder samples
(1,2,3,4,5) have a lower value of TPC compared with
natural cocoa powder samples (6,7,8,9). According to
the study of Miller et al., (2008), alkalization process
could damage the flavanol compounds, resulting in
the decrease of TPC on cocoa powder. Beside
alkalization, TPC of cocoa powder can be influenced
by the processing involved in the production of cocoa
powder including fermentation, drying, and roasting.
These treatments affect the content of polyphenols in
cocoa powder (Thomas-Barberan et al., 2012).
Table 1: Characteristics of total fat, pH, and color of Indonesian cocoa powder.
Sample Total fat
1
(%) pH
2
Color identification
Category
L a b
1 16.38 ± 1.22 7.13 ± 0.11 30.47 +8.34 +9.35 Alkalized
2 17.01 ± 2.71 7.16 ± 0.03 30.05 +8.59 +9.38 Alkalized
3 13.43 ± 1.72 7.13 ± 0.05 31.66 +8.40 +8.70 Alkalized
4 11.27 ± 0.35 8.10 ± 0.02 24.65 +5.41 +5.69 Alkalized
5 15.52 ± 0.07 7.44 ± 0.06 21.98 +6.09 +5.59 Alkalized
6 27.84 ± 1.30 6.15 ± 0.05 34.98 +7.79 +8.96 Natural
7 29.22 ± 0.41 5.16 ± 0.07 34.32 +8.28 +8.63 Natural
8 37.57 ± 0.31 4.90 ± 0.03 23.83 +5.52 +5.86 Natural
9 22.84 ± 0.42 5.71 ± 0.10 37.29 +8.39 +9.57 Natural
1
Values listed in the column is the mean ± SE; n = 2
2
Values listed in the column is the mean ± SD; n = 3
Table 2: Total phenolic and antioxidant capacity of Indonesian cocoa powder.
Sample
Production
Origin
Total
Phenolic
Content
(mg GAE/g)
DPPH
(mikromol
TE/g)
FRAP
(mikromol
Fe
2+
/g)
T
*
(mg/g)
Caff
*
(mg/g)
C
*
(mg/g)
EC
*
(mg/g)
1 Bandung 36.90 ± 0.22
d
183.96 ± 2.38
d
540.68 ± 2.78
d
1.99 ± 0.01
a
0.22
± 0.15
b,c
1.10 ± 0.02
e
1.88 ± 0.03
d
2 Bandung 34.19 ± 0.40
c
158.74 ± 1.75
c
473.00 ± 2.85
c
2.51 ± 0.21
b
0.27
± 0.19
c
1.06 ± 0.06
e
1.97 ± 0.02
d,e
3 Tangerang 38.32 ± 0.20
e
185.33 ± 1.26
d
555.55 ± 5.84
d
2.39 ± 0.09
b
0.16
± 0.11
a,b
0.73 ± 0.00
d
0.77 ± 0.01
b
4 Tangerang 14.80 ± 0.23
a
91.67 ± 3.05
a
249.16 ± 2.45
a
1.89 ± 0.16
ac
0.12
± 0.09
a
1.07 ± 0.06
e
0.04 ± 0.01
a
5 Blitar 20.93 ± 0.53
b
119.10 ± 2.20
b
367.02 ± 17.13
b
2.69 ± 0.15
b,c,d
0.26 ± 0.18
c
0.81 ± 0.02
d
0.08 ± 0.01
a
6 Jember 67.76 ± 0.20
g
310.14 ± 5.93
f
826.97 ± 20.89
f
2.89 ± 0.00
c,d
0.46 ± 0.32
d
0.23 ± 0.01
b
4.68 ± 0.01
g
7 Bali 70.47 ± 1.13
h
346.85 ± 4.29
g
1000.95 ± 18.19
h
2.97 ± 0.14
d
0.42 ± 0.29
d
0.38 ± 0.00
c
2.42 ± 0.13
f
8 South Celebes 61.91 ± 0.58
f
296.39 ± 4.15
e
682.27 ± 0.34
e
2.43 ± 0.07
b
0.43 ± 0.31
d
0.04 ± 0.00
a
1.65 ± 0.02
c
9
West
Sumatera
79.93 ± 0.37
i
362.24 ± 3.10
h
934.32 ± 30.49
g
3.08 ± 0.01
d
0.17 ± 0.12
a,b
0.43 ± 0.01
c
2.09 ± 0.00
e
*T = theobromine, C = (+)-catechin, Caff = Caffeine, EC = (-)-epicatechin
Results are the means of two ± standard deviation. Values accompanied by different letters in the same row statistically
different (p<0.05)
2nd SIS 2019 - SEAFAST International Seminar
100

Effect of fermentation of cocoa beans showed
polyphenol content of fermented cocoa beans smaller
than the unfermented cocoa beans (Prayoga et al.,
2013). Fermented cocoa beans decline in the
polyphenol content due to oxidation, polymerization
and proteins binding (Ramli et al., 2006). Generally,
processing of cocoa powder that has a higher
temperature or longer time will reduce the levels of
polyphenols in cocoa powder component as a result
of chemical reactions such as acceleration of
oxidation reactions (Bernaert et al., 2012).
3.3 Antioxidant Capacity
The antioxidant capacity of Indonesian cocoa powder
was evaluated by using DPPH and FRAP (Ferric
Reducing Antioxidant Power) assay. The
identification results of antioxidant capacity using the
two methods are presented in Table 2. The results of
DPPH antioxidant capacity stated by micromoles
Trolox equivalent per gram of defatted cocoa powder
dry basis, whereas for FRAP methods expressed by
Fe
2+
micromoles per gram of defatted cocoa powder
dry basis.
The capacity of antioxidants in Indonesian cocoa
powder depends on the number of hydroxyl groups
which can inhibit the chain reaction of free radicals
associated with hydrogen donors. High levels of
antioxidant in cocoa powder increase the chances of
hydroxyl and hydrogen donors of free radicals
(Tamrin 2012). The antioxidant capacity of DPPH
method ranged from 91.67 - 362.24 (mol TE / g). The
results supported by research of Genovese et al.,
(2009), which has an antioxidant value of 120 mol TE
/ g, but higher than the results reported by Brcanovic
et al., (2013) that was 11.65 - 32.01 (mol TE/g).
Sample 4 had the lowest antioxidant capacity value
(91.77 mol TE/g) and sample 9 had the highest
antioxidant capacity of DPPH method (362.24 mol
TE/g). All samples were significantly different at the
5% significance level except for sample 1 and 3.
The ability for reducing radical compounds is the
latest antioxidant defense mechanisms. This
mechanism is divided into electron transfer and
hydrogen atom transfer (Oboh and Omoregie, 2011).
FRAP method used in this research to calculate the
ability to reduce Fe
3+
to Fe
2+
. FRAP methods have
antioxidant capacity value ranging from 249.16 -
1000.95 (mol Fe
2+
/ g). Results of this study were
lower than the results Oboh and Omoregie (2011) that
was 1466.33 - 2097.12 (mol Fe 2+ / g), but higher
than the Brcanovic et al., (2013), 22:45 - 137.51 (mol
Fe 2+ / g).
3.4 Profile of Bioactive Compound
Identification of bioactive compounds of Indonesian
cocoa powder using HPLC with UV detector using a
wavelength of 280 nm. Methylxanthines and Phenolic
compounds are identified. The HPLC chromatogram
of bioactive compounds of cocoa powder and
standard can be seen in figure 1. A retention time of
bioactive compounds for theobromine, (+)-catechin,
caffeine, and (-)-epicatechin were 3.3, 5.08, 8.5, and
11.8 minutes, respectively. The results of HPLC
analysis are given in Table 2.
Theobromine content of Indonesian cocoa powder
ranged from 1.89 – 3.14 (mg/g). These results lower
than research from Lo Coco et al., (2007) that was
4,6- 26 (mg/g). The caffeine content ranged from 0,12
– 0.46 (mg / g). The previous studies found the
caffeine content 1.74 - 7:53 (mg/g) from Malaysian
cocoa powder (Ramli et al., 2001) and 0.15 - 1.42
from Croatian chocolate manufacture (Belscak et al.,
2009). Methylxanthine compound decreased during
the fermentation process up to 30% of the initial
methylxanthine content. The decreasing of
methylxanthine is caused by the diffusion of alkaloids
from cotyledon (Nigam and Singh, 2014). The
concentration of methylxanthine decreased with the
increasing of alkalization process, decreasing of the
total theobromine content due to alkalization process
reaches 20% (Li et al., 2012). This is consistent with
the result that shows alkalized cocoa powder was
lower in methylxanthine content than natural cocoa
powder. The HPLC results show that theobromine
compound is the highest bioactive compound of
Indonesian cocoa powder. Consumption of
theobromine from cocoa can significantly increase
plasma HDL cholesterol, lowering LDL
concentrations in plasma, providing cardiovascular
protection and reducing the risk of coronary heart
disease (Khan et al., 2012).
Individual phenolic compounds identified in this
study were (+)-catechin and (-)-epicatechin given in
table 2. (+)-Catechin ranged from 0.04 to 1.10 (mg/g).
This result is supported by the research of Belscak et
al., (2009) that found 0.04 to 0.33 (mg/g) and
Brcanovic et al., (2013) that found 0.03 to 0.18
(mg/g). The (-)-epicatechin content of Indonesian
cocoa powder varied from 0.04 - 4.68 (mg/g). Ramli
et al., (2001) reported (-)-epicatechin content of
Malaysian cocoa and chocolate product ranged from
to 0.48 to 6.32 mg/g), but the result was greater than
the results from Brcanovic et al., (2013) that was 0.04
to 0.14 (mg/g).
Profile of Bioactive Compounds and Antioxidant Capacity of Indonesian Cocoa Powder: A Case of Food Processing Authentication
101
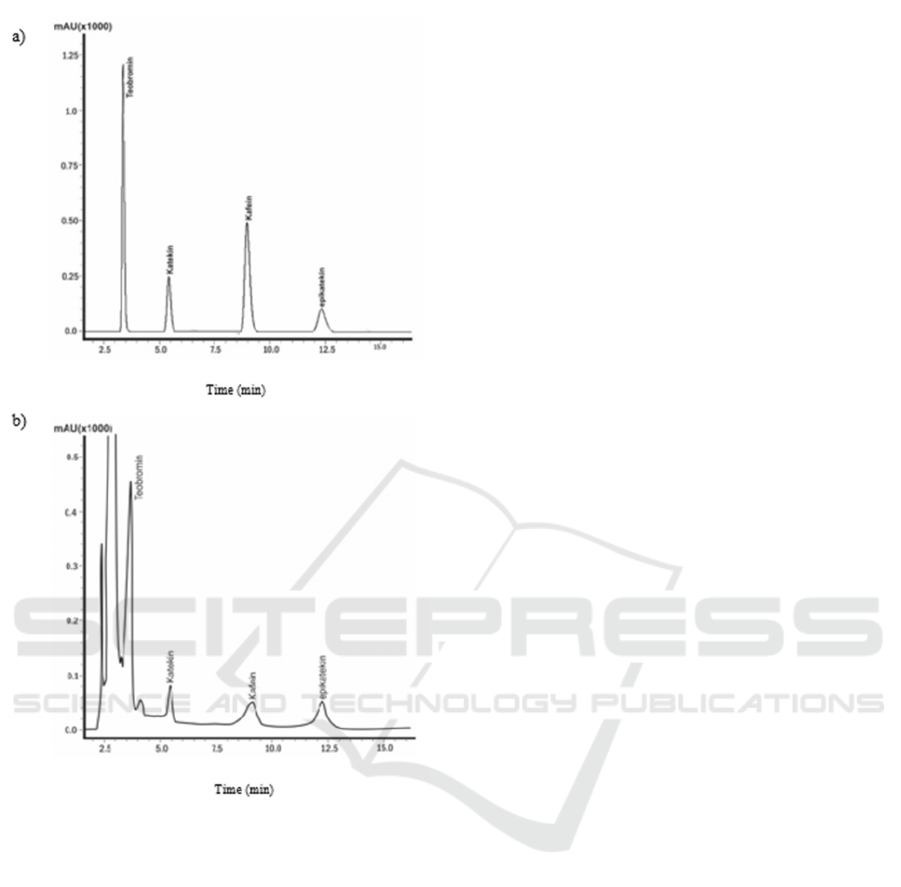
Figure 1: Chromatograms of: a) standard; b) cocoa powder
sample. Analyzed using HPLC with UV detector at a
wavelength of 280 nm.
The (-)-epicatechin content is very influenced by
the level of processing cocoa powder. Meng et al.,
(2009) reported the fermentation process can
significantly reduce the epicatechin content up to 10-
20 %. Sample 1,2,3,4,5 has a lower level of (-) –
epicatechin, it assumed that those samples have
undergone high-temperature of roasting. Roasting
significantly affect the level of polyphenols. Roasting
at higher temperatures induce the epimerization of (-
)- epicatechin into (+) - catechin (Hurst et al., 2011).
This theory supported by the results that show the
concentrations of (+) - catechin were higher in the
alkalized samples (1, 2, 3, 4, 5). Alkalization process
has been reported to reduce the content of (-)-
epicatechin up to 98% and (+)-catechin up to 80%
(Giacometti et al., 2015). This is supported by data
results that showed that the alkalized cocoa powder
samples have a higher value of (+)-catechin and the
lower value of (-) – epicatechin than natural cocoa
powder.
Principal component analysis (PCA) was
performed to classify samples based on the similarity
of their chemical properties. Scatter plots analysis of
PCA are illustrated in Figure 2. The components F1
and F2 represents the total diversity of 87.03% is
considered quite describe the variance of the data
structure. PCA results divided the alkalized and
natural cocoa powder into left and right quadrant.
Samples 6, 7, 8 and 9 (natural) are in the right
quadrant and the alkalized samples are on the
opposite sides. The right quadrant has a lighter color
of cocoa powder and has similarity on high content of
theobromine, (-) - epicatechin, caffeine, and total fat.
These group of samples has high TPC and antioxidant
capacity.
The left side of PCA analysis is identified of
alkalized cocoa powder group. Samples 1, 2, 3, 4, 5
located in the left quadrant has the similar
characteristics of higher pH and (+)-catechin content.
These group of samples has low TPC and antioxidant
capacity level. The pH value contained in the cocoa
powder has a distant quadrant with total phenol and
antioxidant capacity, it can be concluded that a higher
pH value can reduce total phenolic content and
antioxidant capacity.
Correlation between analysis was performed by
Pearson correlation test. The result is shown in Table
3. TPC has a strong correlation with antioxidant
capacity both DPPH and FRAP assay with the
significance level (p <0.01). These results confirm a
relationship between their free radical scavenging and
ferric reducing capacities with the concentration of
phenolic compounds in cocoa powder. Therefore, the
presence of phenolic compounds in the Indonesian
cocoa powder samples contributes significantly to
their antioxidant potential (Brcanovic et al., 2013).
Analysis of color and fat were also correlated
(p<0.05) with TPC and antioxidant capacity. Strong
negative correlation (p< 0.01) was also observed
between pH, TPC, and antioxidant capacity. Higher
pH contained by Indonesian cocoa powder decrease
the level of TPC and antioxidant capacity.
Theobromine and (-)-epicatechin had no
significant correlation at level (p <0.05) to TPC.
Theobromine had a significant correlation at level (p
<0.01) with antioxidant capacity. This is presumably
due to the structure of theobromine that similar to uric
acid which has a mechanism of secondary antioxidant
(Azam et al., 2003). Caffeine compounds do not have
2nd SIS 2019 - SEAFAST International Seminar
102

Figure 2: Scatter plots of the first two principal component vectors (F1 vs. F2) for 9 samples of Indonesian cocoa powder
according to data of pH, total fat, color, TPC, DPPH, FRAP, and Individual bioactive compound.
Table 3: Pearson Correlation coefficient between pH, total fat, color, TPC, DPPH, FRAP, Theobromine, (+)- catechin,
caffeine, and (-)-epicatechin.
Total Phenols DPPH FRAP T C Caf EC pH Color Total fat
TPC
1 0.996** 0.970** 0.745 * -0.799** 0.552 0.727* -0.898** 0.722* 0.774*
DPPH
1 0.977** 0.749 * -0.811** 0.577 0.704* -0.918** 0.693* 0.795*
FRAP
1 0.796** -0.720* 0.555 0.719* -0.863** 0.775* 0.703*
T
1 -0.615 0.524 0.538 -0.656 0.557 0.525
C
1 -0.708* -0.522 -0.871** -0.249 -0.889**
Caf
1 0.680* -0.713* 0.126 0.845**
EC
1 -0.554 0.702* 0.582
pH
1 -0.391 -0.939**
Color
1 0.178
Total
fat
1
** significant at the level of the level of correlation 0:01
* Correlation is significant at the level of 0:05
T = theobromine, C = (+) - catechins, Caf = Caffeine, EC = (-) – epicatechin
a good positive correlation to total phenol and
antioxidant capacity due to their small quantity found
in cocoa powder samples. (+)–Catechin compound
has a negative correlation with total phenol and
antioxidant capacity. That statement can be described
as the effect of epimerization from (-)-epicatechin to
(+)–Catechin structure. According to Cooper et al.,
(2008) epicatechin had a high correlation to total
phenols but not for catechin compounds. There was a
decreasing of polyphenol compounds due to a
processing of cocoa powder, but the decline has
different degrees between each polyphenolic
compounds.
Profile of Bioactive Compounds and Antioxidant Capacity of Indonesian Cocoa Powder: A Case of Food Processing Authentication
103

4 CONCLUSION
Profile of bioactive compounds and antioxidant
capacity of Indonesian cocoa powder have different
values. The total phenolic content ranged from 14.80-
79.93 mg (GAE/g) on a dry basis. DPPH antioxidant
capacity has a range of values 91.67 - 362.24 (mol
TE/g) and FRAP method has a value range 249.16 -
1000.95 (mol Fe
2+
/ g). The content of theobromine,
caffeine, catechin, epicatechin ranged from 1.89 –
3.08 (mg / g); 0.12 - 0:46 (mg / g); 0.04 – 1.10 (mg/g);
0.04 - 4.68 (mg/g), respectively. The high positive
correlation was found between TPC and antioxidant
capacity both DPPH and FRAP. Total fat and color
had a positive correlation with total phenol, however,
pH had a strong negative correlation to total phenol.
PCA analysis divides the samples based on similarity
of chemical characteristics. Left quadrant was a group
of alkalized cocoa powder and right quadrant was a
group of natural cocoa powder.
ACKNOWLEDGMENT
This research work was financially supported by the
Southeast Asean Food and Agricultural Science and
Technology (SEAFAST) center, Bogor Agricultural
University, Indonesia.
REFERENCES
Abbe, M., Ismail A. 2010. Antioxidant properties of cocoa
powder. J Food Biochem. 34: 111–128.
And´ujar, I., Recio, M.C., Giner, R.M., Rios, J.L. 2012.
Cocoa polyphenols and their potential benefits for
human health. Oxid Med Cell. Article ID 906252, 23
pages. Available from: http://dx.doi.org/10.1155/2012/
906252.
Azam, S., Hadi, N., Khan, N.U., Hadi, S.M. 2003.
Antioxidant and prooxidant properties of caffeine,
theobromine and xanthine. Med Sci Monit. 9 (9) : 325-
330
Belscak, A., Komes, D., Horzic, D., Ganic, K.K., Karlovic,
D. 2009. Comparative study of commercially available
cocoa products in terms of their bioactive composition.
Food Research Inter. 42:707-716
Benzie, I.F.F., Strain J.J. 1996. The Ferric reducing ability
of plasma as a measure of “antioxidant power”: the
FRAP assay. Analyt Biochem. 239(1): 70-76.
Bernaert, H., Blondeel, L., Allegaert, L., & Lohmueller, T.
(2012). Industrial treatment of cocoa in chocolate
production: health implication. In: Paoletti et al. (eds).
Chocolate and Health. 17-31.
Brcanovic, J.M., Aleksandra, N., Miti S.S., Stojanovi G.S.,
Manojlovi, D.D., Kali, B.M., and Jovana, N.V. 2013.
Cyclic voltammetric determination of antioxidant
capacity of cocoa powder, dark chocolate and milk
chocolate samples: correlation with spectrophotometric
assays and individual phenolic compounds. Food
Technol. Biotechnol. 51 (4): 460–470
Cooper, K.A., Donovan, J.L., Waterhouse A.L, Wiliamson
G. 2008. Cocoa and health: a decade of research. British
J. of Nutrition. 99: 1-11
Data and Information Center for Agriculture [Pusdatin].
Cocoa Commodity Outlook 2014. Jakarta (ID): Center
for Agricultural Data and Information Secretariat
General of the Ministry of Agriculture.
Directorate General of Plantation (Ditjetbun). 2015.
Statistics Commodities Cocoa Plantation Indonesia
2014 - 2016 Jakarta (ID): Directorate General of
Plantation.
Dyer, B. 2003. Alkalized cocoa powder. Retrieved on
August 15, 2010 from Website:
www.blommer.com/_documents/alkalized-cocoa-
powders-article.pdf
Franco, R., Astibia, A.O., Pinilla, E.M. 2013. Health
benefits of methylxanthines in cacao and chocolate.
Nutrients. 5(10) : 4159 – 4173.
Genovese, M.I. and Lannes. 2009. Comparison of total
phenolic content and antiradical capacity of powders
and “chocolates” from cocoa and cupuassu. Sci. Tech.
Align. 29(4).
Giacometti, J., Joli´c, S.M., Josi ´ c, D. 2015. Cocoa
processing and impact on composition. In: Preedy VR
editor. Processing and impact on active components in
food. London/Waltham/San Diego: Academic Press. p
605–12.
Joli´c, S.M, Radojˇci´c, Redovnikovi´c, I., Markovi´c,
K.,ˇSipuˇsi´c, D.I., Delonga, K.. 2011. Changes of
phenolic compounds and antioxidant capacity in cocoa
bean processing. Int J Food Tech. 46:1793–1800
Khan, N., Monagas, M., Andres-Lacueva, C., Casas, R.,
Urpí-Sardà, M., Lamuela-Raventós, R.M., Estruch, R.
2012. Regular consumption of cocoa powder with milk
increases HDL cholesterol and reduces oxidized LDL
levels in subjects at high-risk of cardiovascular disease.
Nutr Metab Cardiovasc Dis. 22:1046–1053.
Li, Y., Feng, Y., Zhu, S., Luo, C., Ma, J., Zhong, F. 2012.
The effect of alkalization on the bioactive and flavor-
related components in commercial cocoa powder. J
Food Compos Anal. 25: 17–23.
Meng, C.C., Jalil, A.M., Ismail, M. 2009. Phenolic and
theobromine contents of commercial dark, milk and
white chocolates on the malaysian market. Molecules.
14: 200-209.
Miller, K.B., Hurst, W.J., Payne, M.J., Stuart, D.A., Apgar,
J., Sweigart, D.S., Boxin, O. 2008. Impact of
Alkalization on the Antioxidant and Flavanol Content
of Commercial Cocoa Powders. J Agric Food Chem.
56: 8527–8533.
Nigam, P.S., Singh, A. 2014. Cocoa and coffee
fermentations. In: Batt CA, Tortorello ML, editors.
Encyclopedia of food microbiology. 2nd ed.
2nd SIS 2019 - SEAFAST International Seminar
104

London/Burlington/San Diego: Academic Press. p
485–92.
Oboh, H.A., dan Omoregie, I.P. 2011. Total phenolics and
antioxidant capacity of some nigerian beverages.
Nigerian J. of Basic and App. Sci. 19(1): 68-75
Pinilla, E.M., Astibia, A.O., Franco, R. 2015. The
relevance of theobromine for the beneficial effects of
cocoa consumption. Front Pharmacol. 6: 30
Prayoga, R.D., Murwani, R., Anwar S. 2013. Polyphenol
extracts from low-quality cocoa beans: antioxidant,
antibacterial and food coloring properties. Internat.
Food Res. J. 20(6), 3275-3281.
Ramli, N., Seng, R., Hassan, L.K., Said, M. 2006. Effect
of pulp preconditioning on the content of polyphenols
in cocoa beans (Theobroma cacao L.) during
fermentation. Indust. Crops Prod. 24: 87-94.
Ramli, N., Yatim, A.M., Said, M., Hok, H.C. 2001. HPLC
determination of methylxanthines and polyphenols
levels in cocoa and chocolate products. Malaysian
Journal of Analytical Sciences. 7 (2): 377-386
Ramljak, D., Romanczyk, L.J., Metheny-Barlow, L.J.,
Thompson, N., Knezevic, V., Galperin, M., Ramesh,
A., Dickson, R.B. 2005. Pentameric procyanidin from
Theobroma cacao selectively inhibits growth of human
breast cancer cells. Mol Cancer Ther. 4(4):537–546.
Rios, L.Y., Gonthier, M., Remesy, C., Mila, I., Lapierre, C.,
Lazarus, S.A., Williamson, G., Scalbert, A. 2003.
Chocolate intake increases urinary excretion of
polyphenol-derived phenolic acids in healthy human
subjects. J Clin Nutr 77: 912–918.
Sci. Tech. Align. 29(4).
Tamrin. 2012. Perubahan aktivitas antioksidan bubuk
kakao pada penyangraian vakum. Proceeding of
Departement Food Science and Technology, Faculty of
Agriculture, Haluoleo University, Kendari: Indonesia
Thomas-Barberan, F.A., Cienfuegos-Jovellanos, E., Marın,
A., Muguerza, B., Gil-izquierdo, A., Cerda, B.,
Zafrilla, P., Morillas, J., Mulero, J., Ibarra, A.,
Pasamar, M.A.A., Ramoän, D., Espın, J.C. 2007. A
new process to develop a cocoa powder with higher
flavonoid monomer content and enhanced
bioavailability in healthy humans. J. Agric. Food Chem.
55: 3926-3935
Weisburger, J.H. 2001. Chemopreventive Effects of Cocoa
Polyphenols on Chronic Diseases. New York (US):
American Health Foundation.
Profile of Bioactive Compounds and Antioxidant Capacity of Indonesian Cocoa Powder: A Case of Food Processing Authentication
105
