
Validation of Analytical Method for Determination of Adenine and
Hypoxanthine Purine Bases in Melinjo Chips by HPLC-UV
Hanifah Nuryani Lioe, Dahrul Syah, Mutiara Pratiwi and Annisa Defriana
Department of Food Science and Technology, Faculty of Agricultural Engineering and Technology,
IPB University (Bogor Agricultural), IPB Darmaga, Bogor 16680, Indonesia
Keywords: Validation, Analytical Method, Purine, Melinjo Chips, HPLC-UV.
Abstract: Melinjo chips, which is commonly consumed by Indonesian people, are considered as one of the causes which
triggers gout disease due to its purine content. The method to analyze purine in food is limitedly known by
food laboratories in Indonesia. The objective of this research was to validate the analytical method for purine
bases determination in melinjo chips by HPLC-UV. Adenine and hypoxanthine were of the known purine
bases and chosen to be analyzed due to their characteristics which cause more uric acid accumulation in the
body rather than other purine bases, guanine and xanthine. Guanine and xanthine were insoluble in the mobile
phase used in this study, so that they might not be able simultaneously analyzed with adenine and
hypoxanthine. Adenine and hypoxanthine standards were used in the instrumental performance experiment,
method linearity and recovery test. The results showed that the HPLC-UV instrument with RP-C18 column
and UV 257 nm detection had a good linearity in the concentration range of 7.81–125.00 µg/mL. The
coefficients of determination (R2) were more than 0.999 for both adenine and hypoxanthine. Adenine and
hypoxanthine were detected by HPLC-UV at retention time of 5.9–6.8 and 4.8–5.5 min respectively, and both
retention times had an acceptable precision, less than 2.0 %. Detection limit (LOD) and quantification limit
(LOQ) of the instrument were found at 0.72 and 2.39 µg/mL for analysis of adenine, while for analysis of
hypoxanthine were at 0.69 and 2.30 µg/mL, respectively. The analytical method showed a good linearity at a
concentration range of 50–800 µg/g sample with R2 more than 0.990 for both adenine and hypoxanthine
analysis. Method detection limit (MDL) of adenine and hypoxanthine analysis was 19.44 and 14.42 µg/g
respectively. Accuracy of the method was determined by a recovery test at spiking concentrations of 100,
500, and 1000 µg/g. In the analysis of adenine, the respective recovery results were 79.33%, 89.39%, and
90.37% with respective precisions were 5.19%, 4.50%, and 3.46%. While in the analysis of hypoxanthine,
the recovery results were 66.75%, 92.29%, and 100.15%, and the precisions were 2.98%, 3.15%, and 2.22%,
respectively. Based on these results, the analytical method for determination of purine bases in melinjo chips
has been validated and was found to be accurate at concentration more than 100 µg/g wet weight of sample.
1 INTRODUCTION
Purines consist of adenine and guanine found in
deoxyribonucleic acid (DNA) and ribonucleic acid
(RNA), whereas hypoxanthine and xanthine are
purine-derived natural compounds that are rarely
found as bases in DNA and RNA, but often act as
important intermediate compounds in the process of
formation and breakdown of nucleotides (Garret
2005). Since purines can be synthesized and reused
by human body, the need for purines from food is
very small. Purines from food that are absorbed by the
body but are not needed will be catabolized to
produce the final product of uric acid (Zöllner 1982).
In the research of Kaneko et al. (2014), total purines
in food were described as follows: in cereals 157 ̶ 759
µg/g, beans 188 ̶.776 µg/g, soybean products 200 ̶
2931 µg/g, dried seaweeds 154 ̶ 5917 µg/g, eggs not
detected (nd = <2 µg/g), dairy products nd ̶ 129 µg/g,
mushrooms 69 ̶ 3795 µg/g, fruits 24 ̶ 35 µg/g, beef
meat 774 ̶ 1064 µg/g, chicken meat 700 ̶ 1539 µg/g,
pork meat 814 ̶ 1197 µg/g, and fish meat 669 ̶ 2114
µg/g.
Gout or also known as gouty is a condition of the
accumulation of uric acid crystals in the joints. The
accumulation occurs due to the excess of uric acid
production or suboptimal excretion of uric acid as a
product of purine catabolism. According to the
118
Lioe, H., Syah, D., Pratiwi, M. and Defriana, A.
Validation of Analytical Method for Determination of Adenine and Hypoxanthine Purine Bases in Melinjo Chips by HPLC-UV.
DOI: 10.5220/0009978300002833
In Proceedings of the 2nd SEAFAST International Seminar (2nd SIS 2019) - Facing Future Challenges: Sustainable Food Safety, Quality and Nutrition, pages 118-126
ISBN: 978-989-758-466-4
Copyright
c
2022 by SCITEPRESS – Science and Technology Publications, Lda. All rights reserved

research results of Clifford et al. (1976a) and Clifford
and Story (1976b), adenine and hypoxanthine show a
greater impact on gouty or uric acid levels, compared
to guanine and xanthine.
The analytical method for purine base analysis in
food has rarely developed by food laboratories in
Indonesia. Melinjo (Gnetum gnemon L.) is
stigmatized to cause uric acid due to its purine
content, however a study on serum uric acid, after
consuming the product of melinjo (fried melinjo
chips), mentioned it didn’t raise the uric acid level
(Saifudin et al 2018). Considering that melinjo chips
are generally consumed by Indonesian people, an
analysis of purine content in melinjo chips is
important to give an information for consumers of the
product. Thus, there is a need for a validated
analytical method to analyze the purine content in
melinjo chips.
Purines are known able to be analyzed by high
performance liquid chromatography (HPLC)
instrument with UV detection in ppm levels (mg/kg
or µg/g). The aromatic ring functional group in purine
molecules can absorb strongly light at ultraviolet
(UV) wavelengths. This can be used for both
quantitative and qualitative analyses of purines
(Garret 2005). Reversed phase HPLC (RP-HPLC) has
been proven to be very efficient for nucleic acid
analysis (Titkova et al. 1983), and has been
commonly used to separate and quantify purine bases
(Kaneko et al. 2014).
RP-HPLC-UV method requires the hydrolysis of
nucleic acids to become nucleotides and free purine
bases using strong acids. Brulé et al. (1989)
developed a sample preparation method for purine
base analysis with RP-HPLC using acid hydrolysis.
In the research of Brulé et al. (1989), samples were
hydrolyzed using 11.6 N perchloric acid for 1 hour at
100 °C, pH was adjusted using NH4OH to obtain pH
4.0, and to mark with distilled water in a 50 mL
volumetric flask, filtered, and finally analyzed by RP-
HPLC. The purine bases were isocratically separated
with a RP-HPLC column C18 and a mobile phase of
0.1 M potassium phosphate buffer mixture and
phosphoric acid at pH 4.0.
In a research conducted by Sotelo et al. (2002)
regarding the determination of purine bases in sea
urchin gonads, samples were hydrolyzed with a
mixture of trifluoroacetic acid/formic acid (1/1, v / v)
at 90 °C for 15 min, and to mark in 250 mL
volumetric flask, and dried with a rotary vacuum
evaporator at 75 °C. The purine base was dissolved
with 10 mL buffer KH2PO4 0.3 M (pH 4.0) and
filtered using a filter membrane before being
analyzed with RP-HPLC equipped with a UV-VIS
detector at a wavelength of 255 nm. Gradient analysis
was carried out using a mobile phase buffer solution
KH2PO4 0.3 M with a pH of 4.0.
The main objective of this research was to validate
the purine base analysis method with a HPLC
instrument. In this study a method validation of the
purine base analysis was conducted on melinjo chip
sample with a HPLC instrument equipped with RP-
HPLC column and a UV-Vis detector which was set
for UV detection, called as RP-HPLC-UV method.
The purine bases chosen were adenine and
hypoxanthine which are known to have a greater
impact on the increase in uric acid in the body than
guanine and xanthine (Clifford et al 1976a). Adenine
and hypoxanthine were analyzed by RP-HPLC with
operating conditions referring to the adenosine
analysis method in royal jelly in the study of Xue et
al. (2009). The sample preparation method was
adapted from the qualitative analysis procedure for
xanthine purine base (AOAC 2012a). The melinjo
chips were hydrolyzed with 6 N HCl at 100 °C for 1
hour, neutralized with 25% NH4OH, and then treated
with aquabidest in a 10 mL volumetric flask. Finally,
the sample was passed through a SPE (Solid Phase
Extraction) column containing silica, and is injected
into a HPLC equipped with a UV-Vis detector.
2 MATERIAL AND METHOD
2.1 Materials
The materials used in this research were melinjo chips
(Sriti, Sriti Food Co., Jakarta, Indonesia). The
chemicals used for analysis include adenine and
hypoxanthine standards (98-99%, Sigma, Sigma-
Aldrich, USA), phosphoric acid 0.4% (Merck,
Germany), methanol (pa, Merck, Germany), ethanol
80% (pa, Merck, Germany), aquabidest, NH4OH
25% (Merck, Germany), HCl 37% (Merck,
Germany), and silica 60 (Merck, Germany).
Analytical balance, oven, food processor, hot
plate, magnetic stirrer, vacuum filter, spatula, vortex,
Millipore nylon filter membrane 0.45 µm, column
SPE (Solid Phase Extraction), and glasswares were
used. The analytical instruments used were pH-meter
and high performance liquid chromatography
(HPLC) LC 6A model (Shimadzu, Shimadzu Corp.,
Kyoto, Japan), equipped with a SPD-10AV model
UV-Vis detector (Shimadzu, Shimadzu Corp., Kyoto,
Japan), Chromatopac semi-automatic data recorder
(Shimadzu, Shimadzu Corp., Kyoto, Japan), and C18
column (Zorbax, Agilent Technologies, USA).
Validation of Analytical Method for Determination of Adenine and Hypoxanthine Purine Bases in Melinjo Chips by HPLC-UV
119

2.2 Method Validation
In general, this study consisted of four parts, namely
a preliminary test for the determination of retention
time precision and resolution of separation, HPLC-
UV instrument performance testing, development of
purine base analysis procedure, and validation of
purine base analysis method on melinjo chip. The
validation of the analytical method included the
specificity of the method, the linearity of the method,
the accuracy and precision of the method by recovery
test, the limit of the method detection, and the intralab
reproducibility. Adenine and hypoxanthine were the
purine bases chosen in this study.
2.3 Preliminary Retention Time
Precision and Peak Resolution Test
The preliminary test was carried out by separately
injecting the standards adenine and hypoxanthine
which had been dissolved in 0.4% (90%) phosphoric
acid and methanol (10%) at several concentrations to
determine the chromatogram profile and the retention
time of each compound. Once adenine and
hypoxanthine appeared at different retention times,
both were then re-injected in the form of a mixture to
determine the peak resolution of the two compounds.
The resolution shows the ability of the column to
separate the two peaks and is declared good if it has a
value greater than 1.50 (Zhang 2007). This test was
done in duplicate. Resolution was determined using
the equation (1).
Rs = 2 (tR-B - tR-A) / wb-A + wb-B (1)
tR-A and tR-B is the retention times of the two
peaks (compound A is the compound that was eluted
first), while wb-A and wb-B are the width of the
baseline (the bottom) of the two peaks.
The operating conditions of HPLC for analysis of
purine bases in melinjo chips refer to the adenosine
analysis method in royal jelly in Xue et al. (2009)
with modifications of the isocratic elution method and
the flow rate of mobile phase. The analysis of purine
adenine and hypoxanthine bases using HPLC with
UV-Vis detector was performed with the condition as
follows: Zorbax C18 (octadecyl silane or ODS)
column, particle size 5 µm, L 250 mm, inner
diammeter 4.6 mm, isocratic mobile phase of
phosphoric acid 0.4% in water mixed with methanol
(pro analysis) at ratio 90:10 and the pH adjusted to
4.0 by NH4OH 1 M, flow rate at 0.5 mL/min, ambient
temperature, 20 µL injection volume, and detection at
UV 257 nm.
2.4 HPLC-UV Instrument
Performance Test for the Analysis
of Adenine and Hypoxanthine
Purine Bases
Standard stock solution. Standard stock solutions of
adenine and hypoxanthine were made with a
concentration of 500 µg/mL by dissolving 0.025 g of
each standard into 50 mL of the HPLC mobile phase.
The mobile phase consists of a mixture of 0.4%
(90%) phosphoric acid and methanol pro analysis
(10%). The standards adenine and hypoxanthine were
mixed to obtain a standard mixed concentration with
a concentration of 250 µg/mL.
Instrument linearity. Linearity was tested by
injecting a serial solution of a mixture of adenine and
hypoxanthine at concentrations of 1.95, 3.91, 7.81,
15.62, 31.25, 62.50, 125.00, and 250.00 µg/mL into
HPLC with the condition above, so that the peak area
of the serial concentrations were known. Testing on
standard mixed solutions with eight different
concentrations was carried out in triplicate from three
different serial standard solutions. The HPLC results
were then used for making a calibration curve which
plotted between the concentrations (µg/mL) and the
averaged peak area, then the coefficient of
determination (R2) was calculated. Linearity is
considered good if it has R2 greater than 0.990
(AOAC 2012b).
Precision of peak area and retention time. The
precision determination of the area and retention time
was done by injecting seven times a standard mix
solution of adenine and hypoxanthine at the same
concentration into the HPLC, in this case a
concentration of 7.81 μg/mL was used. This
concentration was chosen because it gave an
acceptable recovery result (greater than 80%) at
relatively low concentration. The peak area and
retention times from the seven repeatations of
injection were calculated for their average, standard
deviation (SD), and relative standard deviation
(RSD). RSD acceptance in this test was less than
2.0% (JECFA 2006).
Instrument detection limit (limit of detection or
LOD) and quantification limit (limit of quantification
or LOQ). The LOD of instrument was determined
from the above seven injections of a standard mix
solution. Each concentration of each standard from
each injection was calculated using a calibration
curve obtained from the above test. The SD of the
concentrations obtained from the seven repeatations
of injection was calculated, then the LOD was
determined as three times of the SD, meanwhile the
LOQ was determined as ten times of the SD.
2nd SIS 2019 - SEAFAST International Seminar
120

2.5 Analytical Procedure Orientation
The sample preparation procedure for purine base
analysis in melinjo chip was using the acid hydrolysis
method adapted from AOAC (2012a), AOAC
Official Method 960.56 Microchemical Tests for
Xanthine Alkaloids, with some modifications. The
modifications were the HCl volume used to hydrolyze
the sample as well as the length of the hydrolysis
process. The operating conditions of HPLC-UV for
purine base analysis in emping melinjo samples
followed the adenosine analysis method in royal jelly
(Xue et al. 2009) with some modifications. The
modifications were made in terms of the elution
method with the isocratic mobile phase and its flow
rate. In the preparation stage, the melinjo chips that
have been mashed with a food processor were
hydrolyzed with 6 N HCl at different HCl volumes,
0.5, 1.0, and 2.0 mL at 100 °C for 1 hour, neutralized
with 25% NH4OH, and to mark with aquabidest in a
10 mL volumetric flask. Then the sample solution
was passed through a solid phase extraction (SPE)
column containing silica (approximately 1 gram,
weighed after activated in an oven 105 °C for at least
2 hours) and then it was injected into the HPLC
equipped with a UV-Vis detector with detection at
UV 257 nm as above condition.
Samples to be analyzed by HPLC-UV consist of
unspiked samples (without the addition of standards)
and spiked samples (with the addition of standards).
The standard mixture of adenine and hypoxanthine
with a concentration of 400 µg/g sample was applied.
Thus, the recoveries obtained by using procedures
with different acid hydrolysis time lengths and
volumes were determined and the procedure with the
best recovery was chosen for the method validation
below. This orientation test was done in duplicate.
Analysis of the adenine and hypoxanthine purine
bases content in the sample was compared to the
results of the standard injection only from the
instrumental performance test above. If the peak of
each purine base in the sample could be detected
proportional to its concentration, then the developed
procedure was used for the method validation stage.
2.6 Method Validation
The validation of the purine adenine and
hypoxanthine analytical method consisted of: method
specificity, linearity, accuracy and precision,
detection limit, and intralab reproducibility. Method
validation was carried out following EURACHEM
(1998).
Analytical Procedure. Sample preparation. In the
sample preparation stage, a total of 0.5 grams of
melinjo chips that have been mashed with a food
processor were weighed using an analytical balance.
Then, the sample was hydrolyzed with 6 N HCl at 100
°C for 1 hour. The 6 N HCl volume used for acid
hydrolysis was 0.5 mL (the selected volume resulting
from the above development). The hydrolyzed
sample was then neutralized with NH4OH 25%. The
solution was transferred into a 10 mL volumetric
flask and was fixed to the mark with aquabidest. The
analytical solution was passed through an SPE
column containing about 1 gram of silica before being
injected into HPLC.
Determination by HPLC. The analysis of purine
adenine and hypoxanthine bases using HPLC with
UV-Vis detector was performed isocratically
following the conditions described above. The purine
base in sample was calculated by multiplying the
concentration from calibration curve (from
instrumental performance test) with the final sample
volume (10 mL), then divided by sample weight.
Method specificity. Specificity test was done by
injecting a standard mixture of adenine and
hypoxanthine, samples without standard addition,
and samples that have been added with the standard
mixture of adenine and hypoxanthine. In this study a
standard mixed concentration of 400 μg/g of sample
was used. Thus, at least three chromatograms were
obtained. If the chromatogram shows well-separated
peaks and these peaks were not having interference
by other peaks of sample components, then the
specificity of the analytical method was considered
good.
Method linearity. This test was carried out using
samples spiked with adenine and hypoxanthine
standards at concentrations of 50, 100, 200, 400, and
800 µg/g, then sample treatment according to the
analytical procedure for the sample above was
applied to these mixtures, and then injected into the
HPLC. The linearity test of the method was carried
out in triplicate by making three series of samples
which were spiked at the specified concentrations.
After that, the method callibration curve was made,
that is a plot between the peak area and the purine
concentrations (µg/g). The linearity requirement for
the method is R2 greater than 0.990 or r greater than
0.995 (AOAC 2012b).
Accuracy by recovery test. This test was carried
out using samples spiked with standards at three
different concentrations, low (100 µg/g), medium
(500 µg/g), and high concentrations (1000 µg/g).
Each analysis was carried out at seven replications.
The percentage of recovery was using formula (2).
Validation of Analytical Method for Determination of Adenine and Hypoxanthine Purine Bases in Melinjo Chips by HPLC-UV
121
Acceptance of the recovery percentages is according
to AOAC (2012b).
Recovery
%
x100% (2)
Method precision. The data obtained in the
recovery test for accuracy at three different
concentrations were used for the determination of
method precision by calculating the RSD in each
purine analysis at low, medium, and high
concentrations. The value of RSD analysis (RSDa)
was compared to RSD Horwitz (RSDh). Good
precision was for a RSDa value smaller than RSDh.
RSDh was calculated using formula (3).
RSDh = [2 exp (1-0.5 log C)] (3)
C = Analyte concentration (in fraction of sample)
Method detection limit. The method detection
limit was determined from a plot between the
standard deviations and the concentrations of adenine
and hypoxanthine from the recovery test results at
concentrations of 100, 500, and 1000 µg/g. Through
a linear equation of the curve, the standard deviation
SD0 was determined when the concentration was
equal to zero. MDL value is three times the SD0 value
obtained. Determination of the MDL was referred to
EURACHEM (1998).
Intralab reproducibility. Intralab reproducibility
test was carried out using the same melinjo chip
sample and the same operator and laboratory, but
carried out on different weeks. The results of the
analysis were then calculated for the mean and the
RSD values. The RSD value obtained was then
compared with its RSDh. Good intralab
reproducibility was that with a smaller RSDa value
than its RSDh. In addition, the results obtained were
processed by one-way ANOVA followed by Duncan
posthoc test if there was a significant difference at 5%
level, using the IBM Statistic SPSS 20 program
between the results of analysis from different weeks.
3 RESULTS AND DISCUSSION
3.1 Retention Time and Resolution of
Adenine and Hypoxanthine
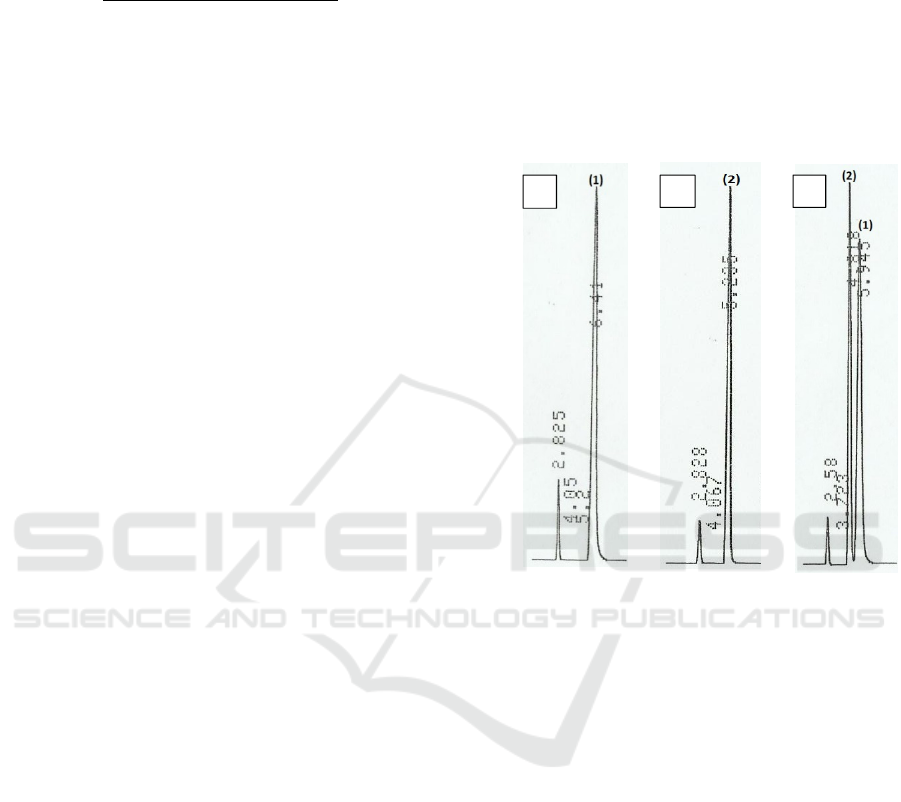
The chromatogram obtained showed that adenine
appeared at 5.9-6.8 min, meanwhile hypoxanthine
appeared at 4.8-5.5 min. The quite different retention
times of adenine and hypoxanthine gave the fact that
the two compounds could be analyzed
simultaneously. Figure 1 shows the chromatograms
of standard adenine, standard hypoxanthine, and the
mixture of adenine and hypoxanthine at 62.50 µg/mL.
The analysis of the standard mixture have a resolution
of 4.51. The resolution shows the ability of the
column to separate the two peaks and is declared good
if it has a value greater than 1.50 (Zhang 2007). Thus,
the resolution of the peak adenine and hypoxanthine
was acceptable, so that the two compounds can be
analyzed simultaneously further.
Figure 1: Chromatograms of standards adenine (A),
hypoxanthine (B), a mixture of adenine and hypoxanthine
(C) at a concentration of 62.50 µg/mL in mobile phase
solution. HPLC column was C18, and the isocratic mobile
phase was phosphoric acid 0.4% in water mixed with
methanol (pro analysis) at ratio 90:10 and the pH adjusted
to 4.0 by NH4OH 1 M. Peaks: (1) adenine, (2)
Hypoxantine.
3.2 Instrument Performance Test
Instrument linearity test results are presented in Table
1. Instrument linearity test results in the table shows
good slope precision, with RSD values less than 5%.
Meanwhile, the value of the intercept obtained
showed a lack of precision both in the analysis of
adenine and hypoxanthine with RSD values greater
than 20%. However, the linearity of the HPLC-UV
instrument is considered as good due to the R2 more
than 0.990, which means the instrument is able to
produce a linear response to the concentration of the
analyte at various levels of concentration.
Retention time (min)
A
bso
r
ba
n
ce
at
2
57
nm
A
C
B
2nd SIS 2019 - SEAFAST International Seminar
122

Table 1: The results of HPLC-UV instrument linearity test
for the analysis of adenine and hypoxanthine standards at
serial concentrations of 1.95, 3.91, 7.81, 15.62, 31.25,
62.50, 125.00, and 250.00 µg/mL.
Slope Intercept R R
2
Adenine
1 65840 92344 0.9998 0.9997
2 66281 139408 0.9999 0.9998
3 66773 44532 0.9999 0.9999
Average 66298 92095 0.9999 0.9998
SD 467 47438 5.77. 10
-5
1.00.10
-4
RSD (%) 0.70 51.51 0.01 0.01
Hypoxanthine
1 45434 103801 0.9995 0.9991
2 43748 60649 0.9998 0.9997
3 43076 92983 0.9995 0.9990
Average 44086 85811 0.9996 0.9993
SD 1215 22452 1.73.10
-4
3.79.10
-4
RSD (%) 2.76 26.16 0.02 0.04
The chromatogram precision determined in this study
covers the precision of peak area and the precision of
retention time. Each precision was shown by its RSD
value obtained from seven injections. The precision
of retention time in analysis of adenine by the HPLC-
UV was 0.67%, meanwhile the precision of peak area
was 3.18%. The similar result was obtained for
hypoxanthine, the precision of retention time was
0.96% and the precision of peak area was 2.97%. The
acceptable precision is 2.0% or less according to
JECFA (2006). The precisions of all retention times
were acceptable, however the precisions of peak area
were not. The poor peak area precision was caused by
the use of semi-automatic data recorders and printers,
so that the peak area could be affected by the feed
speed. Besides this, according to Barwick (1999), the
precision of peak area was probably influenced by the
flow rate of the mobile phase. A constant mobile
phase flow rate can only be produced by HPLC
pumps that in good condition. However, the HPLC
flow rate has been callibrated by an external
calibration service.
LOD and LOQ values obtained in the analysis of
adenine and hypoxanthine were 0.72 and 2.39 µg/mL,
respectively. Meanwhile, the LOD and LOQ values
in the hypoxanthine analysis were 0.69 and 2.30
µg/mL, respectively. As a comparison, in the research
of Sotelo et al. (2002) regarding the determination of
purine base levels in gonads of sea urchins with
HPLC instruments, the detection limits of adenine
and hypoxanthine were 0.076 and 0.060 µg/mL,
respectively, which are ten times lower than those
obtained in this current study.
The precision of the analysis results in
determining the detection limit and the quantification
limit of the instrument was determined by calculating
RSD of analysis (RSDa) and RSD Horwitz (RSDh).
The RSDa of adenine analysis (3.90%) was smaller
than 2/3 RSDh (8.12%). Similar result obtained for
hypoxanthine analysis, the RSDa value (3.97%) was
smaller than 2/3 RSDh (8.19).
3.3 Analytical Procedure Orientation
Filtering the final sample solution with silica using a
SPE column was aimed to remove impurity
components contained in the sample. In developing
this analytical procedure, samples prepared with the
addition of 6 N HCl at various volumes were injected
into the HPLC, where the samples consisted of
unspiked samples (without the addition of standards)
and spiked samples (with the addition of standards).
Each standard was added at a concentration of 400
µg/g sample which was ten times of the instrument
LOQ.
The results of sample analysis, without the
addition of spikes, using HCl volumes of 0.5, 1.0, and
2.0 mL showed that the average melinjo chips
contained adenine in the concentration range of
70.37-171.88 µg/g sample and hypoxanthine in the
concentration range of 48.37-155.58 µg/g sample.
The total of purine bases in emping melinjo was
predicted between 500-1500 µg/g. The recoveries
obtained at the use of HCl volumes of 0.5, 1.0, and
2.0 mL were presented in Tables 2. The results show
that HCl volume of 0.5 mL provides the best recovery
result of 92.99% and 113.84% for the analysis of
adenine and hypoxanthine, respectively. This was
acceptable according to AOAC (2002b), which
mentioned the acceptable recovery between 85-
110%.
Validation of Analytical Method for Determination of Adenine and Hypoxanthine Purine Bases in Melinjo Chips by HPLC-UV
123
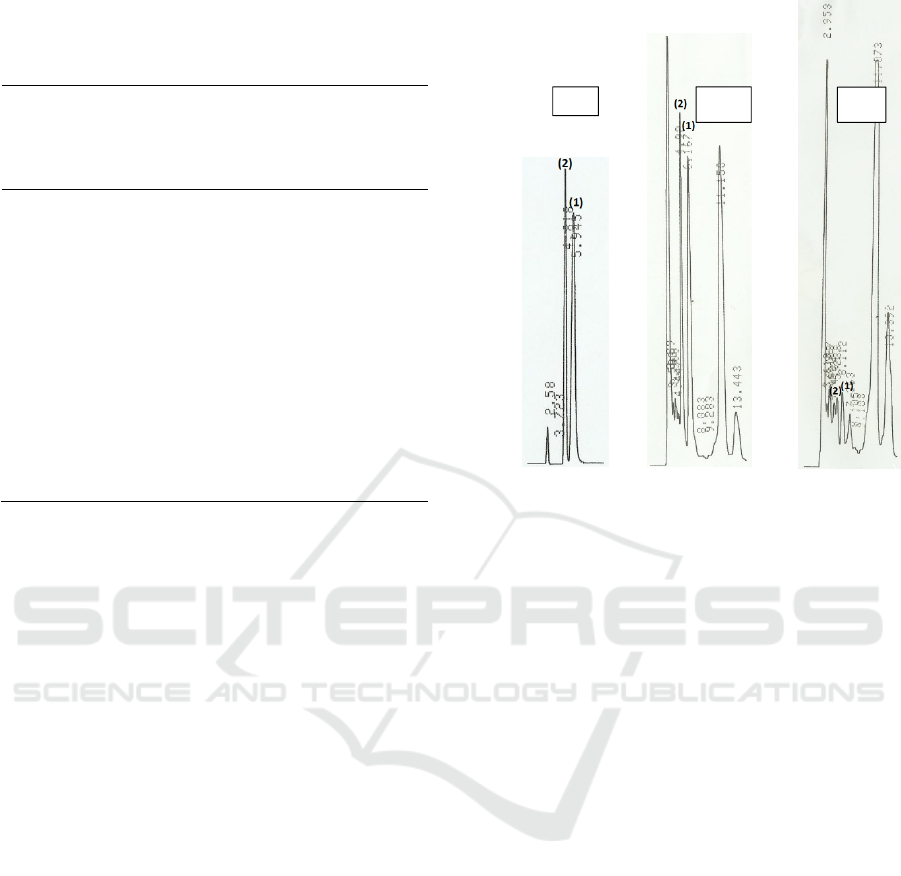
Table 2: The results of the analytical procedure orientation
of adenine and hypoxanthine analysis in melinjo chip using
different volumes of HCl for acid hydrolysis in the sample
preparation stage*.
Volume of
HCl 6 N
(mL)
Concentra
tion of
unspiked
sample
(µg/g)
Concentra
tion of
spiking
(µg/g)
Concentra
tion of
spiked
sample
(µg/g)
Recov
ery
(%)
Adenine
0.5
79.43 ±
2.61 400
451.37 ±
12.82 92.99
1.0
171.88 ±
8.85 400
495.54 ±
11.35 80.91
2.0
70.37 ±
3.48 400
559.03 ±
17.25 122.16
Hypoxant
hine
0.5
103.29 ±
12.12 400
558.64 ±
39.18 113.84
1.0
48.37 ±
4.42 400
650.55 ±
18.93 150.54
2.0
155.58 ±
0.76 400
703.58 ±
5.60 137.00
*in duplicate
3.4 Method Specificity
The chromatogram in Figure 2 shows that the peaks
of adenine and hypoxanthine could be separated to
each other, either analyzed in standard mix solution
or in melinjo chips. Both adenine and hypoxanthine
peaks were not interferred by other peaks of sample
component. Guanin and xanthine which could be
extracted during the sample preparation process,
were not be able analyzed by HPLC because they
cannot be eluted with the mobile phase used in this
study. This mentioned that the method had a good
specificity. Adenine and hypoxanthine in the melinjo
sample were detected at 5.9 ̶ 6.8 min and 4.8 ̶ 5.5 min,
respectively. In Sotelo et al. (2002) study regarding
the determination of purine bases in sea urchin
gonads by HPLC, adenine and hypoxanthine
respectively detected at about 18 and 11 min. A
considerable difference between the retention times
obtained in this study and Sotelo et al. (2002) due to
the different mobile phase used. The mobile phase
used in the Sotelo et al. (2002) study was a 0.3 M
KH2PO4 buffer solution, whereas in this study a
mixture of 0.4% phosphoric acid (90%) mixed with
methanol p.a. (10%) was as the mobile phase. In
general, hypoxanthine was detected earlier than
adenine.
Figure 2: Chromatograms of a standard mixture of adenine
and hypoxanthine (a), unspiked sample (b), and spiked
sample at spiking concentration of 400 µg/g sample (c).
Peaks: (1) adenine, (2) Hypoxanthine.
3.5 Method Linearity
The callibration curve of the method in the analysis
of adenine and hypoxanthine had a linear equation
obtained in the linearity test method for adenine
analysis is y = 3637.7x + 305030 with R and R2
values of 0.9998 and 0.9996, respectively.
Meanwhile testing conducted on hypoxanthine
yielded a curve with the equation of y = 2535.8x +
157650, while R and R2 values were 0.9978 and
0.9956, respectively. R and R2 values obtained in the
adenine and hypoxanthine tests met the requirements
set by AOAC (2012b), that is, R was greater than
0.995 or R2 was greater than 0.990. Thus, the method
used had a good linearity, which could provide a
linear response to the concentration of analytes in the
sample.
3.6 Method Accuracy and Precision
According to AOAC (2002b), the acceptable
percentages of recovery for concentrations of 100 and
500 µg/g is 85-110%, while for concentration of 1000
µg/g is 90-108%. The recovery test results were
presented in Table 3. The results at the spike of 500
and 1000 µg/g in adenine analysis met the AOAC
(2002) requirement, namely by recovery of 89.39%
A
B
C
Retention time (min)
Absorbance at 257 nm
2nd SIS 2019 - SEAFAST International Seminar
124
and 90.37%, respectively. While at 100 µg/g spiking,
the recovery did not meet the standard, which was
79.33% (less than 85%). The recovery results in
hypoxanthine analysis, were only acceptable at the
spiking concentration of 500 and 1000 µg/g, with
recoveries of 92.29% and 100.15%, respectively.
While at the spiking concentration of 100 µg/g, its
recovery was far below the AOAC standard, which
was 66.75%. This might be due to the relatively low
concentration of spikes and the analytes content
naturally in the sample (without the standards
addition). The loss of analytes during sample
preparation seems more significant in the results of
the analysis.
The precision of the analytical method was
determined through the recovery test. The precision
of the method is considered good if the RSDa value
is smaller than the RSDh. If the RSDa value is smaller
than 2/3 RSDh, then the precision of the method is
even better. Determination of the 2/3 RSDh value for
a more stringent standard is to ensure the results of
the analysis. The method precision is presented in
Table 4. In the adenine analysis with the addition of
standard at 100, 500, and 1000 µg/g, RSDa value was
smaller than RSDh, but only at concentrations of
1000 µg/g RSDa value was smaller than 2/3 RSDh.
This shows that in the analysis of adenine, the spiking
at 100 and 500 µg/g was less precise than the spiking
at 1000 µg/g. On the other hand, in the hypoxanthine
analysis, the RSDa values were all smaller than 2/3
RSDh. Thus, hypoxanthine analysis had a good
precision at all spiking studied.
Table 3: Recovery of analytical method for the
determination of adenine and hypoxanthne in melinjo chip
by HPLC-UV.
Concentration
of spiking
(µg/g)
Concentration
found in spiked
sample (µg/g)
Concentration
found in
unspiked
sample (µg/g)
Averaged
recovery
(%)
Adenine
100
222.04 ±
11.53* 142.71 ± 1.35 79.33
500
591.97 ±
26.65* 145.00 ± 4.70 89.39
1000
1044.26 ±
36.19** 140.53 ± 4.51 90.37
Hypoxanthine
100
285.30 ±
8.49* 218.55 ± 7.44 66.75
500
592.29 ±
18.67* 130.84 ± 2.74 92.29
1000
1261.64 ±
28.07**
260.12 ±
11.83 100.15
*Obtained from 7 replications
**Obtained from 5 replications
Table 4: Precision of analytical method for the
determination of adenine and hypoxanthne in melinjo chip
by HPLC-UV.
Concentration of
spiking (µg/g)
SD
(µg/g)
RSDa*
(%)
RSDh**
(%)
2/3 RSDh
(%)
Adenine
100 11.53 5.19 7.09 4.73
500 26.65 4.50 6.12 4.08
1000 36.19 3.46 5.62 3.75
Hypoxanthine
100 8.49 2.98 6.83 4.55
500 18.67 3.15 6.12 4.08
1000 28.07 2.22 5.46 3.64
*RSDa is relative standard deviation of the analysis
**RSDh is RSD Horwitz 2(1-0.5 log c) with c is a fraction
in sample
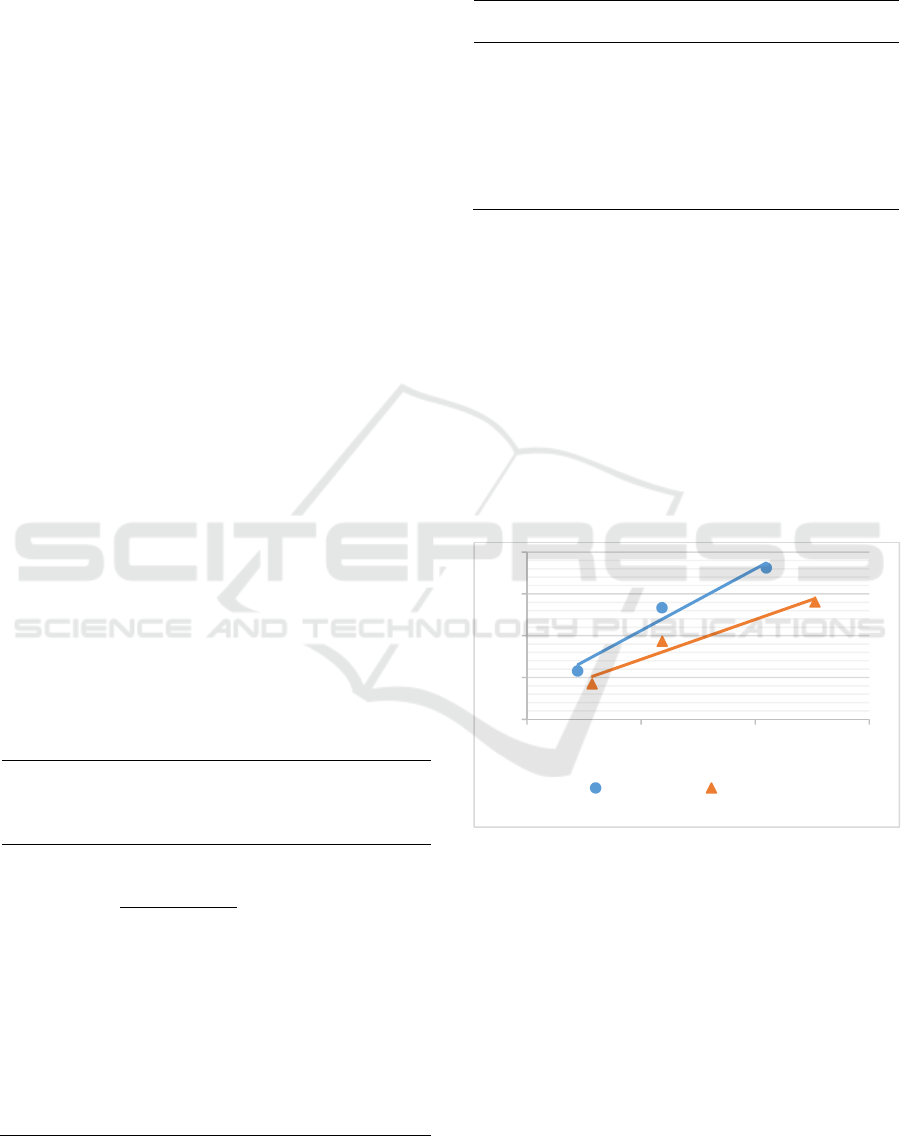
3.7 Method Detection Limit
The method detection limit was determined by
plotting the standard deviations obtained from
recovery test and the concentrations of adenine and
hypoxanthine found. Through the linear equation, the
standard deviation at zero concentration was
determined (SD0). The method detection limit is
three times the value of SD0. The linear curve is
presented in Figure 3.
Figure 3: A plot between analyte concentration (µg/g) and
its standard deviation from recovery test of adenine and
hypoxanthine analyses by HPLC-UV to determine SD0 for
calculating method detection limit (3SD0).
Based on the curve in Figure 3, the SD0 value for
adenine was 6.4794. Thus, the method detection limit
value for adenine analysis was 19.44 µg/g. While the
SD0 value for hypoxanthine was 4.8082, therefore the
method detection limit for hypoxanthine analysis was
14.42 µg/g. The curve had R2 values greater than
0.900 which was acceptable.
y = 0.0295x + 6.4794
R² = 0.9642
y = 0.0191x + 4.8082
R² = 0.9462
0
10
20
30
40
0 500 1000 1500
Standard deviation (µg/g)
Concentration (µg/g)
Adenin Hiposantin
Validation of Analytical Method for Determination of Adenine and Hypoxanthine Purine Bases in Melinjo Chips by HPLC-UV
125

3.8 Intralab Reproducibility
The values of intralab reproducibility in the analysis
of adenine and hypoxanthine were greater than the
RSDh value. Intralab reproducibility values for
adenine and hypoxanthine analyses were 34.53% and
39.89%, respectively. The results of one-way
ANOVA followed with Duncan test gave that they
were significantly different, the result from week 1
was different from the results from weeks 2 and 3.
Meanwhile, the results of hypoxanthine analysis at
weeks 1, 2, and 3 were significantly different to each
other. This might be caused by a poor area precision
observed in the instrument performance test results.
4 CONCLUSIONS
The analysis procedure for alkaloids in AOAC
Official Method 960.56 can be applied to the analysis
of the purine adenine and hypoxanthine bases in
melinjo chips with HPLC-UV. Development of the
analytical procedures carried out showed that the
analytical method using acid hydrolysis provided the
best recovery in the use of 6 N HCl volumes of 0.5
mL. The developed procedure can then be used at the
method validation stage.
In general, the method had a good performance
on all validation parameters except the intralab
reproducibility. The analytical method for the
determination of adenine and hypoxanthine in
melinjo chip by HPLC-UV was validated and gave
an accurate result at concentrations more than 100
µg/g sample.
REFERENCES
[AOAC] Association of Official Analytical Chemists,
2012a. Chapter 18, AOAC Official Method 960.56
Microchemical Tests for Xanthine Alkaloids. AOAC
International. Maryland, USA, 19th edition, page 53.
[AOAC] Association of Official Analytical Chemists,
2012b. AOAC Official Methods of Analysis, Appendix
K: Guidelines for Single Laboratory Validation of
Chemical Methods for Dietary Supplements and
Botanical. AOAC International. Maryland, USA, 19th
edition.
Barwick, V. J, 1999. Sources of uncertainty in gas
chromatography and high-performance liquid
chromatography. Journal of Chromatography 849: 13 ̶
33.
Brulé, D., Sarwar, G., Savoie, L., 1989. Effect of methods
of cooking on free and total purine bases in meat and
fish. Canadian Institute of Food Science and
Technology Journal 22: 248 ̶ 251.
Clifford, A. J., Riumallo, J. A., Young, V. R., Scrimshaw,
N. S., 1976a. Effect of oral purines on serum and
urinary uric acid of normal, hyperuricemic and gouty
humans. The Journal of Nutrition 106: 428 ̶ 434.
Clifford, A. J., Story, D. L, 1976b. Levels of purines in
foods and their metabolic effects in rats. The Journal of
Nutrition 106: 435 ̶ 442.
EURACHEM. 1998. The Fitness for Purpose of Analytical
Methods: a Laboratory Guide to Method Validation and
Related Topics. United Kingdom.
Garrett, R., Grisham, C., 2005. Nucleotides and nucleic
acid. Biochemistry. Thomson Brooks/Cole. USA, 3rd
edition, pp. 309 ̶ 340.
[JECFA] Joint Expert Committee on Food Additives, 2006.
Combined Compendium of Food Additive
Specification. Analytical Methods, Test Procedures and
Laboratory Solutions Used by and Referenced in the
Food Additive Specifications. Food and Agriculture
Organization of the United Nations. Rome, Italy,
Volume 4.
Kaneko, K., Aoyagi, Y., Fukuuchi, T., 2014. Total purine
and purine base content of common foodstuffs for
facilitating nutritional therapy for gout and
hyperuricemia. Biological and Pharmaceutical Bulletin
37: 709 ̶ 721.
Saifudin, A., Suryadini, H., Sujono, T. A., Suhendi, A.,
Tanaka, K., Tezuka, Y., 2018. Serum uric acid
concentration due to Gnetum gnemon chip
supplementation and quality changes analyses based on
its chemical constituents in post frying process. Journal
of Food Processing and Preservation 42: 1 ̶ 6.
Sotelo, M. P., Quiros, A. R. B., Hernandez, J. L., Lozano,
J. S., 2002. Determination of purine bases in sea urchin
(Paracentortus lividus) gonads by high-performance
liquid chromatography. Food Chemistry 79: 113 ̶ 117.
Titkova, N. F., Pomazanov, V. V., Kalinia, Y. T.,
Sakodysnksii, K. I. 1983. High performance liquid
chromatography of components of nucleic acid.
Zhurnal Analiticheskoi Khimii 38: 1305 ̶ 1318.
Xue, X. F., Jin, H. Z., Li, M. W., Liang, H. F., Jing, Z.,
2009. HPLC determination of adenosine in royal jelly.
Food Chemistry 115: 715 ̶ 719.
Zhang, C., 2007. Fundamentals of Environmental Sampling
and Analysis. John Wiley & Sons Inc. Hoboken, USA.
Zöllner, N., 1982. Purine and pyrimidine metabolism.
Symposium Proceeding, Nutrition Society 41: 329 ̶
342.
2nd SIS 2019 - SEAFAST International Seminar
126
