
Bayesian Networks based Policy Making in the Renewable
Energy Sector
Moldir Zholdasbayeva
1,*
, Vasilios Zarikas
1,2,†
and Stavros Poulopoulos
3,‡
1
Department of Mechanical and Aerospace Engineering, Nazarbayev University,
Kabanbay Batyr 53, Nur-Sultan 010000, Kazakhstan
2
General Department, Theory Division, University of Thessaly, Volos, Greece
3
Department of Chemical and Material Engineering, Nazarbayev University,
Kabanbay Batyr 53, Nur-Sultan 010000, Kazakhstan
Keywords: Bayesian Networks, Expert Models, Renewable Energy, Geothermal Energy, Hydro Energy.
Abstract: Extensive research on energy policy nowadays combines theory with advanced statistical tools such as Bayes-
ian networks for analysis and prediction. The majority of these studies are related to observe energy scenarios
in various economic or social conditions, but only a few of them target the renewable energy sector. Therefore,
it is crucial to design a method to understand the causal relationships between variables such as consumption,
greenhouse emissions, investment in renewables and investment in fossil fuels. This research paper aims to
present expert models using the capabilities of Bayesian networks in the renewable energy sector, considering
renewables in two countries: Germany and Italy. For this purpose, expert models are built in BayesiaLab with
supervised learning. An augmented naïve model is applied to quantitative data consisting of the consumption
rate of geothermal and hydro energy sectors. As a result, it is indicated that in the optimum case, geothermal
and hydro energy consumption will be increased in parallel with investment. It is found that, as oil price grows,
greenhouse emissions will decrease. The precision of the expert model is no less than 90%.
1 INTRODUCTION
Bayesian networks are widely being used in various
fields of study, namely in environmental (Martos et
al., 2016; Marcos et al., 2018; Ropero, Renooij and
Gaag, 2018), ecological (Barton et al., 2016; Corani
and Scanagatta, 2016; McLaughlin and Reckhow,
2017; Orun et al., 2018; Liu and Callies, 2019), sus-
tainable development (Keshtkar et al., 2013; Franco
et al., 2016), agricultural (Mukashema, Veldkamp
and Vrieling, 2014; Barton et al., 2016), mapping
(Landuyt et al., 2015; Gonzalez - Redin et al., 2016),
risk management (Gerstenberger et al., 2015; Tang et
al., 2016a, 2016b; Kabir and Papadopoulos, 2019),
reliability (Amrin, Zarikas and Spitas, 2018;
Kameshwar et al., 2019), medicine (Zarikas,
Papageorgiou and Regner, 2014; Zarikas et al., 2018)
and safety (Zarikas et al., 2013; Washington et al.,
2019). Further, the theory behind Bayesian networks
*
https://www.researchgate.net/profile/Moldir_Zholdasbayeva
†
https://research.nu.edu.kz/en/persons/vasileios-zarikas
‡
https://research.nu.edu.kz/en/persons/stavros-poulopoulos
can be applied in diverse research areas to analyze the
numerous data (Bapin and Zarikas, 2014; Amrin,
Zarikas and Spitas, 2018). It is a prognostic method
for conducting diagnostics and calculating probabili-
ties, which is useful for uncertain data (Conrady,
Jouffe and Elwert, 2014; Zarikas, 2014).
It is important to point out that the majority of
studies have been dedicated to the energy sector based
on the latest environmental report (Borunda et al.,
2016). However, with the vast volume of data, there
are a few studies related to the use of Bayesian
networks in the renewable energy sector (Res et al.,
2009; Cinar and Kayakutlu, 2010; Borunda et al.,
2016; Gambelli et al., 2017), particularly for the
energy policy cases (Kumar et al., 2010; Bhowmik et
al., 2017). Therefore, it is pivotal to develop a tech-
nique to predict future progress in this field for the
sources of energy such as geothermal energy, hydro
energy, bioenergy, solar energy, wind energy. For this
Zholdasbayeva, M., Zarikas, V. and Poulopoulos, S.
Bayesian Networks based Policy Making in the Renewable Energy Sector.
DOI: 10.5220/0008925004530462
In Proceedings of the 12th International Conference on Agents and Artificial Intelligence (ICAART 2020) - Volume 2, pages 453-462
ISBN: 978-989-758-395-7; ISSN: 2184-433X
Copyright
c
2022 by SCITEPRESS – Science and Technology Publications, Lda. All rights reserved
453

purpose, energy policies are important, so that they can
contribute to the understanding of the future market for
renewable energy production and consumption.
Case studies may be considered to be an effective
method to create energy policies (Kim et al., 2018).
For this, the algorithms in Bayesian networks can be
modified and built in relevance with structural re-
strictions of the system (Campos and Castellano,
2007; Pitchforth and Mengersen, 2013; Perreault and
Sheppard, 2019). Two approaches can be applied to
data analysis in the renewable energy sector such as
supervised and unsupervised learning. In case of un-
supervised learning, it is useful to determine the
causal relationships between variables, otherwise, su-
pervised learning allows referring to one variable at a
time (Conrady, Jouffe and Elwert, 2014). One of the
relevant studies using unsupervised learning in BNs
in this field is dedicated to forecasting the investment
in the renewable energy sector in Turkey for the years
1970 to 2007 (Cinar and Kayakutlu, 2010). Several
variables, which were expected to have even a slight
impact on energy investment, were chosen. Also,
gross domestic product, renewable energy produc-
tion, fossil fuel production, urbanization, and indus-
trialization were directly imported to Bayesian net-
work. Three scenarios were created (optimistic, stable
and pessimistic). As a result, in the optimistic sce-
nario investment in renewables grew with a gradual
decrease in greenhouse emissions. This leads to the
fact that with a high rate of industrialization process
and GDP the demand for renewables increases.
Another study in this area is related to the predic-
tion of the future market of biofuels using supervised
learning in Italy by 2030 (Gambelli et al., 2017). Two
scenarios were developed such as “best scenario” and
“worst scenario”. As an outcome, in the best scenario
biofuels would demonstrate the highest percentage of
market involvement in the near future. Nevertheless,
one requirement is needed: advanced technological
development and environmental policies should be
taken into action simultaneously.
The main aim of current research is to develop ex-
pert models (Tselykh, Tselykh and Barkovskii, 2018;
Jha, 2019)
for the renewable energy sector using a su-
pervised learning technique. Methodologies above
will be modified to create expert models, concerning
two energy sectors: hydro energy and geothermal en-
ergy. In addition, the application of Bayesian net-
works in the determination of the best scenarios for
geothermal energy shows only 2 percent of research
papers addressed this type of renewable, whilst for
hydro energy, it is 21 percent (Borunda et al., 2016).
Particularly, these studies will be concentrated on the
widely used energy source (hydro energy) and on the
least favourable one (geothermal energy). Factors as
GDP, fossil fuel and renewables consumption, green-
house emissions will be taken into account to verify
the results obtained from previous research.
In the following section, modified methods for
this research will be given and explained. K-Folds
analysis method will be discussed. In Section 3, re-
sults will be shown regarding the optimum and mini-
mum cases for the renewable energy sector with max-
imum and minimum consumption rate. In Section 4,
conclusions will be drawn regarding expert models
and the impact of selected variables on renewables.
2 METHODOLOGY
Data analysis for the identification of the optimum
and minimum cases for the renewable energy sector
is undertaken using BayesiaLab software (Conrady
and Jouffe, 2015). The optimum case is this with the
highest percentage of the increase in renewable con-
sumption and the minimum case is the less optimistic,
where a significant decrease in renewable consump-
tion will be observed by inserting evidence to a
model. Data on renewables is obtained from the offi-
cial site of OECD (Organisation for Economic Coop-
eration and Development). OECD is an organization
that provides a wide range of data on economics, wel-
fare, energy, and investment with open availability.
Specifically, data on import and export, the consump-
tion and the electricity production and price, the pro-
duction of greenhouse emissions is collected from the
dataset ‘Renewables balance’ and data on GDP is
taken from ‘Energy statistics’ for two countries (Ger-
many and Italy) for the years 1990 – 2017 (Organisa-
tion for Economic Cooperation and Development
[OECD], n.d.). The information on the investment for
both renewables and fossil fuels is extracted from
‘RD&D Budget’, whereas data on patents is from ‘Pa-
tent statistics’. Finally, data on gold and oil prices is
from ‘Main economic indicators’. Renewables such
as geothermal energy and hydro energy are used for
the preliminary analysis related to its full availability
and will be shown as separate models next sections.
2.1 Augmented Naïve Bayesian Model
To analyze those cases mentioned above, expert
models are created. The first stage for this is to
identify the discretization method and the learning
type. The supervised learning algorithm is used for
this research, considering that consumption of either
renewable type will be set as a target variable.
ICAART 2020 - 12th International Conference on Agents and Artificial Intelligence
454

Before these steps will be conducted, it can be
mentioned that the discretization type is chosen to be
“Tree” for supervised learning for “Oil_Price (RI)”,
“TRenEnergy_import (ktoe)”, “Gold_ Price (US dol-
lars)”, “TRenEnergy_export (ktoe)”,“Geothermal_-
electricity (GWh)”, “GDP”, “Investment_renewables
(millions)”, “Investment_fossilfuels (millions)”, “En-
vironPolicy (%)”, “Electricity_Price (RI)”, “GhEmis-
sions_production (tonnes)”, “Geothermal_techpa-
tents”. A tree is considered to be the most commonly
used discretization methods for supervised learning.
The major process involves using the class infor-
mation of child nodes and applying a hierarchical dis-
cretization based on the correlation. The reason be-
hind applying this type of discretization lies in the op-
timization process of correlation between the target
variable (“Geothermal_consumption (ktoe)”) and
predictor variables.
The manual discretization process is applied to
“Geothermal_consumption (ktoe)” with generating
states by choosing R2-GenOpt discretization type
based on the regression model (Montgomery and
Runger, 2014):
/
(1)
It can be clearly shown from the above formula
that a sum due to regression is over a total sum of
squares, considering that discretization is chosen for
strengthening the connection between discrete and
continuous variables. This is called genetic optimiza-
tion.
It can be noted that all variables are continuous
while supervised learning requires at least one dis-
crete target variable. Therefore, using R2-GenOpt
converts a continuous variable to a discrete one (“Ge-
othermal_consumption (ktoe)”). Values for missing
parts of the data are generated by Missing Values Im-
putation, which gives the Structural EM method, ap-
plicable to a small set for data for the purpose of this
research (Conrady, Jouffe and Elwert, 2014). The
method of Structural Expectation Maximization is
based on finding the ‘most suitable’ estimate for the
missing part of the dataset by evaluating possible
structures for the parameter.
For the strength of each arc, Pearson’s correlation
method is used by showing the strongest and the least
strong connections. Thus, the structural analysis uses
Pearson’s correlation coefficients
,
,
/
∙
(2)
for evaluating the differences between two nodes and
summation of the resultant values, which gives the
values with high precision and accuracy (Mu, Liu and
Wang, 2018).
Furthermore, a supervised learning procedure is
carried out by choosing the augmented naïve model.
It is applicable to analyze a small set of data. The
structure of the augmented naïve model is character-
ized by having similar properties as the naïve model,
but adding a higher precision and accuracy to the
model (Figure 1(b)). It is, therefore, achieved by cre-
ating new connections between the adjacent nodes
(Montgomery and Runger, 2014). In the naïve model,
nodes are considered to be independent of each other
without any correlation between neighboring nodes
(Figure 1(a)).
a)
b)
Figure 1: A simplistic naïve and augmented naïve models
(Y – target node; N1, N2, N3 – child nodes): a) naïve model;
b) augmented naïve model.
The augmented naïve model uses the famous
Bayes formula to identify joint probabilities not only
between dependent variables and one target variable,
but also correlations between several child nodes.
|
| ∙ / (3)
2.2 K-Folds Analysis
In order to demonstrate the precision of each model
presented in these studies, k-folds analysis is exe-
cuted. K-Fold cross-validation is useful in machine
learning to evaluate the precision of a machine learn-
ing model on unseen data. It is a technique in which a
particular sample of a dataset is reserved on which
there is no need to train the data. Then, the model is
tested on this sample before finalizing it. Thus, a
small reserved sample is utilised to calculate how the
model is supposed to behave in general when used to
make predictions on data, but not used during the
Bayesian Networks based Policy Making in the Renewable Energy Sector
455
training of the model. The algorithm is characterised
by a single parameter “k” denoting the number of
groups that our sample is to be split into. This is the
reason the method it is called k-fold cross-validation.
3 RESULTS AND DISCUSSIONS
In this section, the method explained previously is ap-
plied to create expert models in the renewable energy
sector for two countries: Germany and Italy. Two
sources of energy are used in predicting the optimum
and minimum cases for consumption such as geother-
mal energy and hydro energy. The dependencies be-
tween child nodes are built by an automatic calcula-
tion of correlation using supervised learning.
3.1 Augmented Naïve Bayesian Model
for Renewables in Germany
In this subsection, two expert models are presented
for geothermal energy and hydro energy in Germany.
For both cases, consumption is considered to be a tar-
get variable with the manual discretization. In case of
geothermal energy, the discretization method is cho-
sen to be “Tree” for “Gold_Price (US dollars)”,
“TRenEnergy_export (ktoe)”, “Geothermal_electri-
city (GWh)”, “GDP”, “Investment_renewables (mil-
lions)”, “Investment_fossilfuels (millions)”, “Envi-
ronPolicy (%)”, “Electricity_Price (RI)”, “GhEmis-
sions_production (tonnes)”. The type of discretiza-
tion as “Perturbed Tree” is automatically generated
states for two variables such as “TRenEnergy_Import
(ktoe)” and “Oil_Price (RI)”, whereas R2-GenOpt is
chosen for “Geothermal_techpatents”.
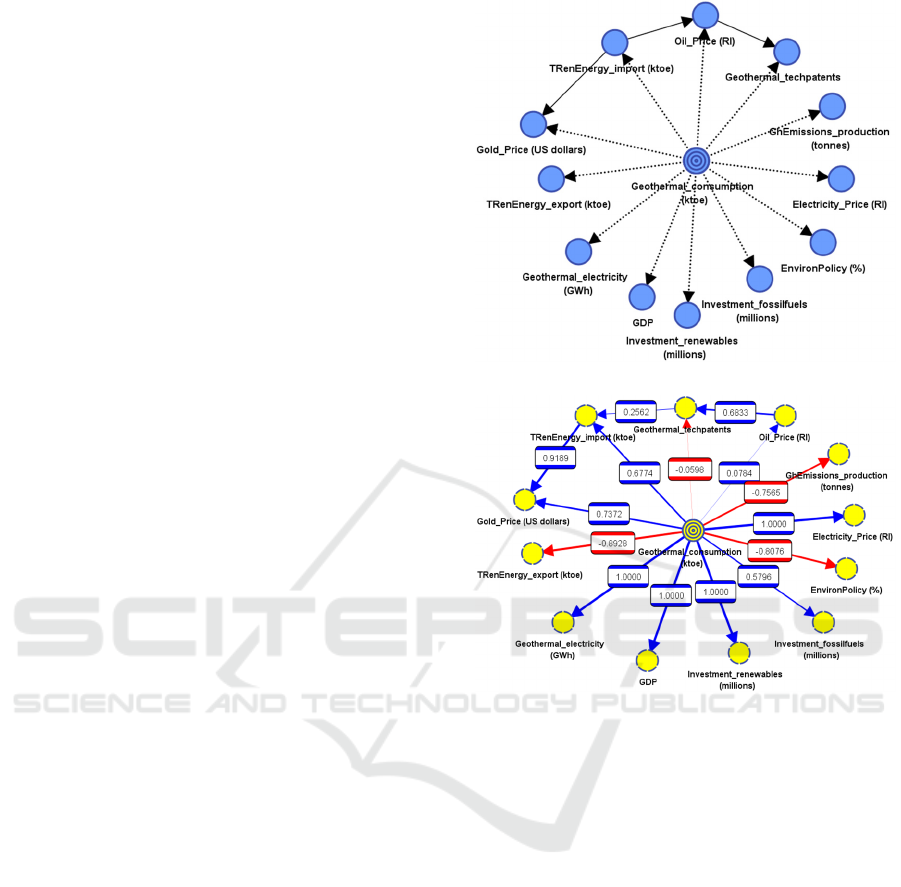
In Figure 2(a), the model for geothermal energy is
presented using the supervised learning algorithm
with a structural coefficient of one. In Figure 2(b), it
is shown that the new connection between variables
“Geothermal_techpatents” and “Oil_Price (RI)” is
created by editing the structural coefficient to 0.5.
But, the relationship between “TRenEnergy_import
(ktoe)” and “Oil_Price (RI)” is deleted. The correla-
tion between variables are shown in the same figure
(Figure 2(b)) using Pearson’s correlation, where the
strongest relationship is bounded to be between “Ge-
othermal_consumption (ktoe)” and “Investment_re-
newables (millions)”, “Geothermal_consumption
(ktoe)” and “GDP”, “Geothermal_consumption
(ktoe)” and “Geothermal_electricity (GWh)”, “Geo-
thermal_consumption (ktoe)” and “Electricity_Price
(RI)”. The least strong connection is between “Geo-
thermal_consumption (ktoe)” and “Geothermal_-
techpatents”.
a)
b)
Figure 2: Supervised learning for geothermal energy in Ger-
many: a) with the structural coefficient of 1; b) with the
structural coefficient of 0.5 and with Pearson’s correlation.
After applying the augmented naïve model for var-
iables in the geothermal energy sector, it is important
to use the joint probability to predict the optimum and
minimum cases for geothermal energy consumption.
Firstly, the optimum case for geothermal energy is ob-
served in Figure 3. By setting the evidence for the op-
timum case of “Investment_renewables (millions)” to
100%, the same percentage is obtained for the opti-
mum state of “Geothermal_consumption (ktoe)”,
whereas the minimum state of “GhEmissions_produc-
tion (tonnes)” is shown to be 80%.
Furthermore, the minimum case for geothermal en-
ergy is shown in Figure 4. By setting the evidence for
the optimum state of “Investment_fossilfuels (mil-
lions)” and the minimum state of “Gold_Price (US dol-
lars)” to 100%, the same percentage is obtained for the
minimum state of “Geothermal_consumption (ktoe)”.
The optimum state of “GhEmissions_production
(tonnes)” is described by 95.65% increase.
ICAART 2020 - 12th International Conference on Agents and Artificial Intelligence
456

Figure 3: Optimum case for geothermal energy consump-
tion in Germany.
Figure 4: Minimum case for geothermal energy consump-
tion in Germany.
Table 1: Occurrences, reliability and precision of expert
model for geothermal energy in Germany.
Occurrences
Value <=89.973 (23) >89.973 (5)
<=89.973 (22) 22 0
>89.973 (6) 1 5
Reliability
Value <=89.973 (23) >89.973 (5)
<=89.973 (22) 100.0000% 0.0000%
>89.973 (6) 16.6667% 83.3333%
Precision
Value <=89.973 (23) >89.973 (5)
<=89.973 (22) 95.6522% 0.0000%
>89.973 (6) 4.3478% 100.0000%
It can be said that the optimum case where the
consumption of geothermal energy will increase is the
state with increasing investment in renewable energy.
However, the minimum case is obtained by setting a
condition with the increasing investment in fossil
fuels and the decreasing price for gold. To verify this
expert model, k-folds analysis is undertaken as shown
in Table 1 with the precision approximately equals to
95.6%, which demonstrates a quite acceptable result
for further analysis.
A similar expert model is created for the hydro en-
ergy sector as shown in Figure 5. The discretization
type is chosen to be “Tree” for three variables such as
“Hydro_electricity (GWh)”, “GDP” and “GhEmis-
sions_production (tonnes)”. The remaining set of vari-
ables is discretized by choosing “Perturbed Tree”. It is
observed (Figure 5(b)) that the strongest correlation is
between “Hydro_consumption (ktoe)” and “Hydro
_electricity (GWh)”, “GDP” and “GhEmissions_-pro-
duction (tonnes)”. The less apparent connection is the
same as with geothermal energy. New relation-ships
are created between “TRenEnergy_Import (ktoe)” and
“Hydro_techpatents”, “TRenEnergy_-Export (ktoe)”
and “Oil_Price (RI)”, “Electricity_- Price (RI)” and
“Investment_fossilfuels (millions)”, “Oil_Price (RI)”
and “GDP”.
a)
b)
Figure 5: Supervised learning for hydro energy in Germany:
a) with the structural coefficient of 1; b) with the structural
coefficient of 0.5 and with Pearson’s correlation.
The optimum case for hydro energy is demons-
trated in Figure 6. The maximum increase of 58.33%
in “Hydro_consumption (ktoe)” is achieved by set-
ting the value for evidence for “Investment_renew-
ables (millions)” and “Hydro_techpatents” to 100%.
The minimum case for hydro energy consumption is
the same as for geothermal energy as shown in Figure 7.
Bayesian Networks based Policy Making in the Renewable Energy Sector
457

Figure 6: Optimum case for hydro energy consumption in
Germany.
Figure 7: Minimum case for hydro energy consumption in
Germany.
The optimum condition for hydro energy with the
increasing investment in renewables leads to the grad-
ual growth of hydro consumption.
At the same time, the minimum case is shown to
be quite similar to one shown with geothermal energy
case, which is explained by using the same dependent
variables. The precision (100%) of the model is des-
cribed in Table 2.
3.2 Augmented Naïve Bayesian Model
for Renewables in Italy
In this subsection, two more expert models are de-
signed for geothermal and hydro energy in Italy. A
target variable remains the same from previous analy-
sis. In terms of geothermal energy, the discretization
method is chosen to be “Tree”, except for “Geother-
mal_techpatents” R2-GenOpt is applied. The expert
model is considered to remain stable even by chang-
ing the structural coefficient to 0.5 (Figure 8(b)).
The strongest relationship is shown between
“Oil_Price (RI)” and “Coal_Price (RI)”, “Geother-
mal_consumption (ktoe)” and “Geothermal_electri-
city (GWh)”, “Geothermal_consumption (ktoe)” and
“TRenEnergy_Import (ktoe)”. The weakest connec-
tion is between “GhEmissions_production (tonnes)”
and “EnvironPolicy (%)”.
Table 2: Occurrences, reliability and precision of the model
for hydro energy in Germany.
Occurrences
Value <=1636.371(10) >1636.371 (18)
<=1636.371 (10) 10 0
>1636.371 (18) 0 18
Reliability
Value <=1636.371 (10) >1636.371 (18)
<=1636.371 (10) 100.0000% 0.0000%
>1636.371 (18) 0.0000% 100.0000%
Precision
Value <=1636.371 (10) >1636.371 (18)
<=1636.371 (10) 100.0000% 0.0000%
>1636.371 (18) 0.0000% 100.0000%
a)
b)
Figure 8: Supervised learning for geothermal energy in
Italy: a) with the structural coefficient of 1; b) with the
structural coefficient of 0.5 and with Pearson’s correlation.
By giving evidence (100%) to “Investment_re-
newables (millions)” and “Geothermal_techpatents”,
“Geothermal_consumption (ktoe)” is indicated at the
maximum state of 94.94% for the case with optimum
ICAART 2020 - 12th International Conference on Agents and Artificial Intelligence
458

conditions. The optimum states for “Geothermal_-
electricity (GWh)” and “TRenEnergy_import (ktoe)”
are described by the same percentage as for “Geother-
mal_consumption (ktoe)”, explained by a high corre-
lation (Figure 9).
Figure 9: Optimum case for geothermal energy consump-
tion in Italy.
The minimum case is described by 60% of
probability of decreased geothermal consumption by
giving evidence to “Coal_Price (RI)” and
“Investment_fossilfuels (millions)”. Therefore,
“GhEmissions_production (tonnes)” is maximized,
explained by the opposite correlation with “Geo-
thermal_consumption (ktoe)” (Figure 10).
Figure 10: Minimum case for geothermal energy consump-
tion in Italy.
In addition, the growth in investment for renew-
ables has a slight effect on environmental policy,
whereas GDP increases. The precision of this expert
model created for the geothermal energy sector in It-
aly is 92.3%, which is considered to be relevant to
these studies (Table 3).
Further, the augmented naïve model has been ap-
plied to the hydro energy sector in Italy. The most ob-
vious connection is described between “Hydro_con-
sumption (ktoe)” and “Hydro_electricity (GWh)”,
whereas the weakest one is between “Hyd-ro_con-
sumption (ktoe)” and “EnvironPolicy (%)”.The rela-
tionships between “Coal_Price (RI)” and “Hyd-
ro_techpatent”, “Oil_Price (RI)” and “GDP” are crea-
ted by changing the structural coefficient as shown in
Figure 11(b).
Table 3: Occurrences, reliability and precision of the model
for geothermal energy in Italy.
Occurrences
Value <=4258.527 (13) >4258.527 (15)
<=4258.527 (12) 12 0
>4258.527 (16) 1 15
Reliability
Value <=4258.527 (13) >4258.527 (15)
<=4258.527 (12) 100.0000% 0.0000%
>4258.527 (16) 6.2500% 93.7500%
Precision
Value
<=4258.527
(13)
>4258.527 (15)
<=4258.527 (12) 92.3077% 0.0000%
>4258.527 (16) 7.6923% 100.0000%
a)
b)
Figure 11: Supervised learning for hydro energy in Italy: a)
with the structural coefficient of 1; b) with the structural co-
efficient of 0.5 and with Pearson’s correlation.
In the optimum case, adding evidence to “Invest-
ment_renewables (millions)” and “Hydro_techpa-
Bayesian Networks based Policy Making in the Renewable Energy Sector
459

tents” leads to 100% probability of the maximum state
of “Hydro_consumption (ktoe)”. It can be, therefore,
mentioned that the price for electricity reaches its max-
imum state for the optimum situation (Figure 12).
Figure 12: Optimum case for hydro energy consumption in
Italy.
In the minimum case, setting evidence to
“Coal_Price (RI)” and “Investment_fossilfuels (mil-
lions)” leads to 100% probability for minimum level
of hydro energy consumption (Figure 13).
Figure 13: Minimum case for hydro energy consumption in
Italy.
From figures, it is obvious that GDP has a clear
impact on the consumption rate of hydro energy. The
precision of the expert model for hydro energy in Italy
equals to 100 % according to Table 4.
Table 4: Occurrences, reliability and precision of the model
for hydro energy in Italy.
Occurrences
Value <=3648.495 (18) >3648.495 (10)
<=3648.495 (18) 18 0
>3648.495 (10) 0 10
Reliability
Value <=3648.495 (18) >3648.495 (10)
<=3648.495 (18) 100.0000% 0.0000%
>3648.495 (10) 0.0000% 100.0000%
Precision
Value <=3648.495 (18) >3648.495 (10)
<=3648.495 (18) 100.0000% 0.0000%
>3648.495 (10) 0.0000% 100.0000%
4 CONCLUSIONS
Bayesian networks have been a well-known tool used
in diverse areas of science and technology. However,
its usage could be extended in the renewable energy
policy sector using the expert model.
At this work, the renewable sources such as geo-
thermal energy and hydro energy were taken into con-
cern as one of the widespread and the least preferable
types of renewables, respectively. Two expert models
were created using the augmented naïve method. Ini-
tially, structural coefficient was equal to one, then in
order to increase the precision, it was taken as a half
of value. This resulted in new causal connections. It
was noticeable that editing the structural coefficient
might give some robustness to the system, however it
was suggested to use the range no less than 0.1 and no
more than 1.
From the analysis, it was shown that the consump-
tion of geothermal energy in Germany could be opti-
mized by the increasing investment in renewables,
which proves the previous research works. Green-
house emissions were decreased to 80% for the opti-
mized case. On the other hand, the minimum case
demonstrated that the increasing investment in fossil
fuels and the cheapest price for gold resulted in a sit-
uation with the minimized state for geothermal en-
ergy consumption.
In terms of hydro energy in Germany, it was only
a slight increase in hydro consumption as a response
for the growing number of technical patents and the
investment. The minimum case showed that similar
results as for geothermal energy source, which was
explained by using the same input variables.
In case of Italy, the increasing number of tech-
nical patents and the investment in geothermal energy
lead to a considerable increase in geothermal con-
sumption, whereas a gradual change in environmental
policy could be noticed. For the minimum case, the
evidence was set to a coal price, which resulted in the
worst scenario (minimum case) for this type of renew-
able. As for hydro energy consumption, it was indi-
cated that its optimum case was set by giving the max-
imum evidence to technical patents, whereas the min-
imum situation was involved the decrease in the coal
price and the increased emissions.
Therefore, from the obtained results and precision
data, it can be said that Bayesian Networks is a suita-
ble tool for data analysis in renewable energy policy
making. Methods in previous sections will be deve-
loped further as a small set of data only was utilized
during this research. Furthermore, it is crucial to ex-
tend this method applying to other sources of renew-
able energy such as solar, wind and bio.
ICAART 2020 - 12th International Conference on Agents and Artificial Intelligence
460

REFERENCES
Amrin, A., Zarikas, V. and Spitas, C. (2018) ‘Reliability
analysis and functional design using Bayesian networks
generated automatically by an “Idea Algebra” frame-
work’, Reliability Engineering and System Safety. Else-
vier Ltd, 180 (July), pp. 211–225. doi: 10.1016/j. ress.
2018.07.020.
Bapin, Y. and Zarikas, V. (2014) ‘Probabilistic Method for
Estimation of Spinning Reserves in Multi-connected
Power Systems with Bayesian Network-based Re-
scheduling Algorithm’, Proceedings of the 11th Inter-
national Conference on Agents and Artificial Intelli-
gence, pp. 840–849. doi: 10.5220/ 0007577308400849.
Barton, D. N. et al. (2016) ‘Assessing ecosystem services
from multifunctional trees in pastures using Bayesian
belief networks’, Ecosystem Services, 18, pp. 165–174.
doi: 10.1016/j.ecoser.2016.03.002.
Barton, D. N. et al. (2016) ‘Diagnosing agrosilvopastoral
practices using Bayesian networks’, Agroforestry Sys-
tems, 91(2), pp. 325–334. doi: 10.1007/s10457-016-
9931-1.
Bhowmik, C. et al. (2017) ‘Optimal green energy planning
for sustainable development : A review’, Renewable
and Sustainable Energy Reviews. Elsevier Ltd, 71
(December 2016), pp. 796–813. doi: 10. 1016/ j.rser.
2016. 12.105.
Borunda, M. et al. (2016) ‘Bayesian networks in renewable
energy systems : A bibliographical survey’, Renewable
and Sustainable Energy Reviews. Elsevier, 62, pp. 32–
45. doi: 10.1016/j.rser.2016. 04.030.
Campos, L. M. De and Castellano, J. G. (2007) ‘Bayesian
network learning algorithms using structural re-
strictions’, 45, pp. 233–254. doi: 10.1016/ j.ijar. 2006.
06.009.
Cinar, D. and Kayakutlu, G. (2010) ‘Knowledge-Based
Systems Scenario analysis using Bayesian networks : A
case study in energy sector’, Knowledge-Based Sys-
tems. Elsevier B.V., 23(3), pp. 267–276. doi: 10.1016/
j.knosys. 2010.01.009.
Conrady, S., Jouffe, L. and Elwert, F. (2014) ‘Causality for
Policy Assessment and Impact Analysis Directed Acy-
clic Graphs and Bayesian Networks for Causal’, (No-
vember). doi: 10.13140/2.1. 2350. 1763.
Corani, G. and Scanagatta, M. (2016) ‘Environmental Mo-
delling & Software Air pollution prediction via multi-
label classification’, 80. doi: 10.1016/ j.envsoft.2016.
02.030.
Franco, C. et al. (2016) ‘Environmental Modelling & Soft-
ware A Bayesian Belief Network to assess rate of
changes in coral reef ecosystems’, Environmental Mo-
delling and Software. Elsevier Ltd, 80, pp. 132–142.
doi: 10.1016/j.envsoft.2016.02.029.
Gambelli, D. et al. (2017) ‘Third generation algae biofuels
in Italy by 2030
: A scenario analysis using Bayesian
networks’, 103(April 2016), pp. 165–178. doi:
10.1016/j.enpol.2017.01.013.
Gerstenberger, M. C. et al. (2015) ‘Bi-directional risk as-
sessment in carbon capture and storage with Bayesian
Networks’, International Journal of Greenhouse Gas
Control. Elsevier Ltd, 35, pp. 150–159. doi:
10.1016/j.ijggc. 2015. 01.010.
Gonzalez-Redin, J. et al. (2016) ‘Spatial Bayesian belief
networks as a planning decision tool for mapping eco-
system services trade-offs on forested landscapes’, En-
vironmental Research, 144, pp. 15-26. doi:
10.1016/j.envres.2015.11.009
Jha, S. K. (2019) ‘A comprehensive search for expert clas-
sification methods in disease diagnosis and prediction’,
(April 2018). doi: 10.1111 /exsy. 12343.
Kabir, S. and Papadopoulos, Y. (2019) ‘Applications of
Bayesian networks and Petri nets in safety, reliability,
and risk assessments : A review’, Safety Science. Else-
vier, 115(April 2018), pp. 154–175. doi: 10.1016/
j.ssci.2019.02.009.
Kameshwar, S. et al. (2019) ‘Probabilistic decision-support
framework for community resilience: Incorporating
multi-hazards, infrastructure interdependencies, and re-
silience goals in a Bayesian network’, Reliability Engi-
neering & System Safety, 191, 106568. doi:
10.1016/j.ress.2019.106568
Keshtkar, A. R. et al. (2013) ‘Application of Bayesian net-
works for sustainability assessment in catchment mod-
eling and management (Case study : The Hablehrood
river catchment)’, Ecological Modelling. Elsevier B.V.,
268, pp. 48–54. doi: 10.1016/ j.ecolmodel.2013.08.003.
Kim, J. et al. (2018) ‘Sustainable Technology Analysis of
Artificial Intelligence Using Bayesian and Social Net-
work Models’. doi: 10.3390/ su10010115.
Kumar, A. et al. (2010) ‘Renewable energy in India : Cur-
rent status and future potentials’, (October). doi:
10.1016/j.rser.2010.04.003.
Landuyt, D. et al. (2015) ‘Environmental Modelling &
Software a GIS plug-in for Bayesian belief networks :
Towards a transparent software framework to assess
and visualise uncertainties in ecosystem service map-
ping’, Environmental Modelling and Software. Elsevier
Ltd, 71, pp. 30–38. doi: 10.1016/ j.envsoft. 2015. 05.
002.
Liu, Z. and Callies, U. (2019) ‘Implications of using chem-
ical dispersants to combat oil spills in the German Bight
e Depiction by means of a Bayesian network *’, Envi-
ronmental Pollution. Elsevier Ltd, 248, pp. 609–620.
doi: 10.1016/j.envpol.2019. 02.063.
Marcos, D. et al. (2018) ‘Ecotoxicology and Environmental
Safety Assessing mercury pollution in Amazon River
tributaries using a Bayesian Network approach’, Eco-
toxicology and Environmental Safety. Elsevier Inc.,
166(June), pp. 354–358. doi: 10.1016/j.ecoenv. 2018.
09.099.
Martos, A. et al. (2016) ‘Towards successful environmental
performance of sustainable cities : Intervening sectors.
A review’, Renewable and Sustainable Energy Re-
views. Elsevier, 57, pp. 479–495. doi: 10.1016/ j.rser.
2015.12.095.
McLaughlin, D., and Reckhow, K. (2017) ‘A Bayesian net-
work assessment of macroinvertebrate responses to nu-
trients and other factors in streams of the Eastern Corn
Belt Plains, Ohio, USA’, Ecological Modelling, 345,
pp. 21-29. doi: 10.1016/j.ecolmodel.2016.12.004
Bayesian Networks based Policy Making in the Renewable Energy Sector
461

Montgomery, D. C. and Runger, G. C. (2014) Applied Sta-
tistics and Probability for Engineers. 6th edn. John
Wiley & Sons Inc.
Mu, Y., Liu, X. and Wang, L. (2018) ‘A Pearson's correla-
tion coefficient based decision tree and its para-llel im-
plementation’, Information Sciences. Elsevier Inc., 435,
pp. 40–58. doi: 10.1016/ j.ins.2017.12.059.
Mukashema, A., Veldkamp, A. and Vrieling, A. (2014) ‘In-
ternational Journal of Applied Earth Observation and
Geoinformation Automated high resolution mapping of
coffee in Rwanda using an expert Bayesian network’,
International Journal of Applied Earth Observations
and Geoinformation. Elsevier B.V., 33, pp. 331–340.
doi: 10.1016/ j.jag.2014.05.005.
Organisation for Economic Cooperation and Development.
(n.d). Retrieved from https:// stats. oecd .org/
Orun, A. et al. (2018) ‘Use of Bayesian inference method
to model vehicular air pollution in local urban areas’,
Transportation Research Part D. Elsevier, 63(May),
pp. 236–243. doi: 10.1016/ j.trd.2018.05.009.
Perreault, L. and Sheppard, J. (2019) ‘International Journal
of Approximate Reasoning Compact structures for con-
tinuous time Bayesian networks’, International Journal
of Approximate Reasoning. Elsevier Inc., 109, pp. 19–
41. doi: 10.1016/ j.ijar. 2019.03.005.
Pitchforth, J. and Mengersen, K. (2013) ‘Expert Systems
with Applications A proposed validation framework for
expert elicited Bayesian Networks’, Expert Systems
with Applications. Elsevier Ltd, 40(1), pp. 162–167.
doi: 10.1016/j.eswa. 2012. 07.026.
Res, C. et al. (2009) ‘Applying Bayesian modelling to as-
sess climate change effects on biofuel production’, 40,
pp. 249–260. doi: 10.3354/ cr00833.
Ropero, R. F., Renooij, S. and Gaag, L. C. Van Der (2018)
‘Discretizing environmental data for learning Bayesian-
network classifiers’, Ecological Modelling. Elsevier
B.V., 368, pp. 391–403. doi: 10.1016/ j.ecolmodel.
2017.12.015.
Tang, C. et al. (2016a) ‘Risk analysis of emergent water
pollution accidents based on a Bayesian Network’,
Journal of Environmental Management. Elsevier Ltd,
165, pp. 199–205. doi: 10.1016/ j.jenvman. 2015.
09.024.
Tang, C. et al. (2016b) ‘Risk forecasting of pollution acci-
dents based on an integrated Bayesian Network and wa-
ter quality model for the South to North Water Transfer
Project’, Ecological Engineering. Elsevier B.V., 96, pp.
109–116. doi: 10.1016/ j.ecoleng.2015.11.024.
Tselykh, A., Tselykh, L. and Barkovskii, S. (2018)
‘Knowledge discovery using maximization of the
spread of influence in an expert system’, (April 2017),
pp. 1–19. doi: 10.1111/exsy. 12312.
Washington, A. et al. (2019) ‘Adoption of a Bayesian Be-
lief Network for the System Safety Assessment of Re-
motely Piloted Aircraft Systems’, Safety Science, 118,
pp. 654-673. doi: 10.1016/j.ssci.2019.04.040
Zarikas, V. et al. (2013) ‘Statistical survey of elevator acci-
dents in Greece’,
Safety Science. Elsevier Ltd, 59, pp.
93–103. doi: 10.1016 /j.ssci .2013. 05.001.
Zarikas, V. (2014) ‘Modeling decisions under uncertainty
in adaptive user interfaces’, (May 2007). doi: 10.1007/
s10209-007-0072-1.
Zarikas, V. et al. (2018) ‘Medical Decision Support Tool
from a Fuzzy-Rules Driven Bayesian Network’,
2(Icaart), pp. 539–549.
Zarikas, V., Papageorgiou, E. and Regner, P. (2014) ‘Ar-
ticle approach for medical decision support’, 0(0). doi:
10.1111/exsy.12089.
ICAART 2020 - 12th International Conference on Agents and Artificial Intelligence
462
