
Linear Model Adjustment and Approximate Approach for Creating
Minimal Overhead Wires Network for Vehicle Schedules
Dobroslav Grygar
a
and Michal Kohni
b
Department of Mathematical Methods and Operations Research, Faculty of Management Science and Informatics,
University of Zilina, Univerzitna 8215/1, 010 26 Zilina, Slovakia
Keywords:
Battery Assisted Trolleybus, Exact Approach, Mathematical Model, Optimization, Schedule, Route.
Abstract:
Nowadays, there is a significant effort in reducing the environmental impact caused by public transport. This
goal can be achieved in many ways. One possible way is in using battery-assisted trolleybuses in cities.
Therefore this paper deals with the question of how to create a minimum overhead contact network for such
vehicles operation. The article presents the mathematical model of such a problem and tests the impact of
the version with the modified condition. It also proposes a suboptimal way to propose needed vire network
for operation selected vehicle schedules using individual routes. As benchmarks, some vehicle schedules in
Zilina were selected.
1 INTRODUCTION
The European Union is currently calling for the
reduction of the environmental impact caused by
carbon-dioxide emissions. It can be assumed that
the trend of implementation of battery-assisted trol-
leybuses in cities will grow soon. The technology
of battery-assisted trolleybus combines the benefits of
classical trolleybus with movement freedom of stan-
dard buses. The dasic idea is illustrated in Figure 1.
Figure 1: The basic idea of battery assisted trolleybus oper-
ation. [Vossloh Kiepe] (Bartomiejczyk, 2017).
We have developed the mathematical model to
create a minimal network of overhead wires that
would be sufficient for deployment and operation of
a
https://orcid.org/0000-0002-5834-6624
b
https://orcid.org/0000-0002-9421-4899
such battery-assisted trolleybuses for individual bus
lines (Grygar and Kohani, 2019b). Next logical step
in our research is to use this model to solve the prob-
lem with longer and more complex vehicle schedules.
This paper introduces the mathematical model of ex-
act optimization for individual routes. We are also
dealing with the question, how to improve the effec-
tivity of our mathematical model. Therefore, we will
compare the adjusted version of the linear model with
the original formulation.
With this model, we are able to optimize all of the
service trips in the vehicle schedule individually. Us-
ing correct parameters, we ensure that a vehicle will
be able to complete all tours in schedule (Grygar and
Kohani, 2019a).
This approach can be considered as a heuristic al-
gorithm extension to the previous research. Based on
this approach, it is possible to optimize the schedule
of a vehicle without regard to its length. Although
obtained results are based on an exact approach to op-
timizing the individual routes, it is necessary to con-
sider the coverage of individual schedules as a heuris-
tic result. We are using real data from the public trans-
port system. The data was obtained from the public
transport provider (DPMZ) in Zilina (Grygar and Ko-
hani, 2019a).
This paper is written with the following structure.
First, we mention the current state of the art in Section
2. Then, in the next section of the paper, we formulate
the problem. After that, Section 4 describes the data
Grygar, D. and Kohni, M.
Linear Model Adjustment and Approximate Approach for Creating Minimal Overhead Wires Network for Vehicle Schedules.
DOI: 10.5220/0008966501870193
In Proceedings of the 9th International Conference on Operations Research and Enterprise Systems (ICORES 2020), pages 187-193
ISBN: 978-989-758-396-4; ISSN: 2184-4372
Copyright
c
2022 by SCITEPRESS – Science and Technology Publications, Lda. All rights reserved
187

conversion approach. Section 5 explains the mathe-
matical model of the problem and studied condition
modification. Lastly, Section 6 introduces performed
benchmarks and explains the collected results.
2 STATE OF THE ART
Traditional trolleybuses have been used for several
years in public transport in some cities in Slovakia. To
deploy trolleybuses, it is necessary to cover all routes
with continuous overhead wires (Pisko, 2017). An
interesting alternative is in using battery-assisted trol-
leybuses.
The battery-assisted trolleybuses are considered
as the most cost-effective electrically powered pub-
lic transport technology solution (Bergk et al., 2016),
(Rogge et al., 2015) and (Yang et al., 2014).
In our previous research, we published the analy-
sis in the topic of limiting factors of battery-assisted
trolleybuses (Grygar et al., 2019). This study is
based on valuable information papers from other au-
thors. Vehicle technology is well cowered in real de-
ployment observations by (Bartomiejczyk, 2017) and
(Bartomiejczyk et al., 2013). Information about lifes-
pan of traction batteries and temperature impact can
be found in (Ghlich et al., 2014), (Montoya et al.,
2017), (Rice et al., 2017), (Ritter et al., 2016), (Rogge
et al., 2015) and (Saft, 2016).
Unfortunately, there are no studies available to ad-
dress the problem of building an optimal overhead
wires network for battery-assisted trolleybuses in a
big graph. We can get inspiration from articles deal-
ing with the deployment of induction lines for pas-
senger cars. This task is considered similar (He
et al., 2016), (Hwang et al., 2018) and (Ushijima-
Mwesigwa et al., 2017). Our proposed model is
based on a modification of the model presented in
(Ushijima-Mwesigwa et al., 2017).
There are published many works about scheduling
electric vehicles in public transport. For example pa-
per (Kooten Niekerk et al., 2017) extends traditional
scheduling problem by using electric vehicles. Fur-
thermore, there is better paper (Janovec and Kohni,
2019) also deals with this topic. Authors use more
realistic linear model and it is tested with real word
benchmarks from Zilina, Slovakia.
Our problem can be basically explained as lo-
cation problem on edges. There are many papers
dealing with all sorts of standard location problems
(Jaosikova and Jankovic, 2018), (Janosikova et al.,
2017), (Kvet, 2019) or (Janacek and Kvet, 2016). We
may explore options on how to use a similar approach
to our problem in future research.
3 THE PROBLEM
FORMULATION
In our research, we often deal with the problem of
designing network systems, such as rescue or distri-
bution systems. In such tasks, we can meet with an
unlimited or limited capacity problem. When solving
a standard location problem, we are usually selecting
locations for centres in network nodes (Janek and Ko-
vaikov, 1999). These can be tasks oriented to placing
shops, warehouses, stations, hospitals and so on. The
centres capacity or distribution times are represented
as model conditions. Objective function is often ori-
ented to minimizing the total cost (Janek et al., 2015).
Our problem can be formulated as a location prob-
lem on edges. So we are trying to create a minimal
network of overhead wires that would be enough for
deployment and operation of battery-assisted trolley-
buses technology. The building cost of required over-
head contact wires represents a big part of the cost of
the entire transport system. Therefore, we are about
to minimize it (Grygar et al., 2019).
In the current state of our research, we have to ex-
plore options on how to cover whole vehicle sched-
ules with overhead contact lines using current model
formulation. So, we introduce the suboptimal ap-
proach to optimize selected vehicle schedules. From a
computational point of view, the proposed mathemat-
ical model is inadequate for solving large scale tasks
with commercial solver like XPRESS IP. The options
of efficient conditions modifications need to be also
explored.
The data conversion process is an important part
of solving the formulated problem. After data con-
version, we can start the process of finding exact so-
lutions for different datasets using selected IP solver.
4 DATA CONVERSION
To prepare data for solving using formulated model,
we need to perform the transformation of the road
network to another form. The process converts the
road network graph to road segment graph for each
route. In this transformation, we also convert edges
form road segment graph to nodes in the road seg-
ment graph and vice versa. This transformation is il-
lustrated in Figure 2 (Grygar and Kohani, 2019b).
State of Charge (SOC) represents actual state en-
ergy in a vehicles battery pack in %. Battery assisted
trolleybus starts a journey with an initial SOC. SOC of
a vehicle is calculated depending on whether a charg-
ing wire is built on the road segment (Grygar and Ko-
hani, 2019b).
ICORES 2020 - 9th International Conference on Operations Research and Enterprise Systems
188

Figure 2: Creation of road segments graph from road net-
work graph. a) Example of the road network graph. Bus
line (with stops 1, 3, 7, 6) is marked with the orange line.
Nodes are bus stops and edges are road segments. b) road
segment graph created for the mentioned bus line. Nodes
are road segments, AN is artificial node representing SOC
of a vehicle after compleating the trip (Grygar and Kohani,
2019b).
In the next phase, the state of charge graph is cre-
ated for each line. Vehicle SOC graph illustration is
in Figure 3. The mentioned graph represents all pos-
sible combinations of vehicles SOC. These options
are combinations of individual segments coverage of
a bus line by overhead charging wires. SOC graph
contains only these combinations where the vehicle
can pass whole route (Grygar and Kohani, 2019b).
Figure 3: State of charge graph. Rows represent individ-
ual charge level and nodes are road segments. Transitions
between charge level are marked with 1 of the vehicle is
charged from wires and with 0 if not. The y
(
s) and x
(
r, i)
are decision variables, and w
(
r, s, i) input data (individual
feasible combinations of charging). (Grygar and Kohani,
2019b).
5 MATHEMATICAL MODEL
FORMULATION
In this section, we describe the original version of the
linear model of our problem. Then we will describe
the proposed adjustment of the model.
We define set of all routes R, and set I
r
as feasi-
ble alternatives for route r and then set off all used
segments S. The number of segments n and routes m.
After that x
r,i
∈ {0, 1} is decision variable of selec-
tion of alternative i for route r. And is decision vari-
able y
s
∈ {0, 1} of segment s in graph will or won’t be
covered by overhead charging wire.
Input combinations w
r,s,i
∈ {0, 1} for route r on
segment s for alternative i is charging line needed.
Lastly the number of feasible alternatives a
r
for route
r and cost of building charging wires c
s
for segment
s.
min
n
∑
s=1
c
s
· y
s
, (1)
a(r)
∑
i=1
x
r,i
= 1 f or r = 1..m, (2)
n · y
s
≥
m
∑
r=1
a(r)
∑
i=1
x
r,i
· w
r,s,i
f or s = 1..n, (3)
y
s
∈ {0, 1} f or s = 1..n, (4)
x
r,i
∈ {0, 1} f or r = 1..m; i = 1..a(r). (5)
The objective function 1 for the problem of mini-
mizing the total building cost. Constraint 2 serve for
choosing one combination for all routes on the line.
Constraint 3 ensures that we install a charging line if
at least one route requires an installation. The obliga-
tory constraints are 4 and 5.
5.1 Edited Mathematical Model
As we have presented in the already published re-
search, this formulation of the mathematical model is
not suitable for larger-scale tasks. Therefore, we de-
cided to make a change to the condition 3. Original
conditions 3 were formulated for each route.
Modification of the condition 3 results in the fol-
lowing condition 6.
y
s
≥
a(r)
∑
i=1
x
r,i
· w
r,s,i
f or s = 1..n; r = 1..m. (6)
This change does not change the meaning of the
model. Conditions 6 are formulated for each service
trip and also for each route. It results in an increase
in the number of conditions when solving a task using
IP-solver XPRESS. We will study the impact of this
change on the solving process of the problem using
the following computational tests.
Linear Model Adjustment and Approximate Approach for Creating Minimal Overhead Wires Network for Vehicle Schedules
189
6 THE BENCHMARKS AND
COMPUTATIONAL TESTS
We obtained data from the public transport company
(DPMZ) in Zilina, Slovakia. Two vehicle sched-
ules were selected. For each benchmark, two-vehicle
schedules were selected.
Our model is able to solve the problem for sin-
gle bus routes only. Therefore, it was necessary to
ensure that the vehicle starts and ends individual jour-
neys on the line with the same level of SOC. There-
fore, we choose the rule that every service trip must
end with SOC of at least 60 %, and every service trip
start’s with SOC of 60 %. The solution found using
this parameter setting will mean that a vehicle is able
to overcome the entire schedule. However, it is not
guaranteed to find the optimal solution to the original
problem. All input parameters related to vehicle are
listed in Table 1.
As it was mentioned before, we also studied the
impact of model adjustment. We tested both models
using the same benchmarks.
Table 1: Battery assisted trolleybus parameters settings se-
lected for all benchmark runs.
Parameter Value Unit
Min SOC 20 %
Max SOC 80 %
Battery capacity 50 kWh
Energy consuption 1.5 kWh/km
Initial SOC 60 %
Minimal SOC on route end 60 %
Charging time 30 s/1kWh
Travel speed 30 km/h
We used workstation with the following hard-
ware specifications. Processor Intel Core i5-7200U
2,5Ghz with 3,10Ghz turbo boost (two cores and
four threads), paired with 16 GB of DDR4 2133MHz
RAM. We selected IP-solver XPRESS IVE as soft-
ware tool for solving this problem.
6.1 Benchmark 4 4a and 5 1a
In the first benchmark, we selected two schedules.
The first schedule of a vehicle named 4 4a, which
serves 10 service strips. Mainly trips of lines 4 and
14, but the schedule is starting with a shortened ser-
vice strip of line 1 and once also servers line 5. The
second schedule 5
1a serves 10 service trips on line
5. Selected schedules are presented in Table 2. Indi-
vidual routes from selected schedules are illustrated
in Figure 4.
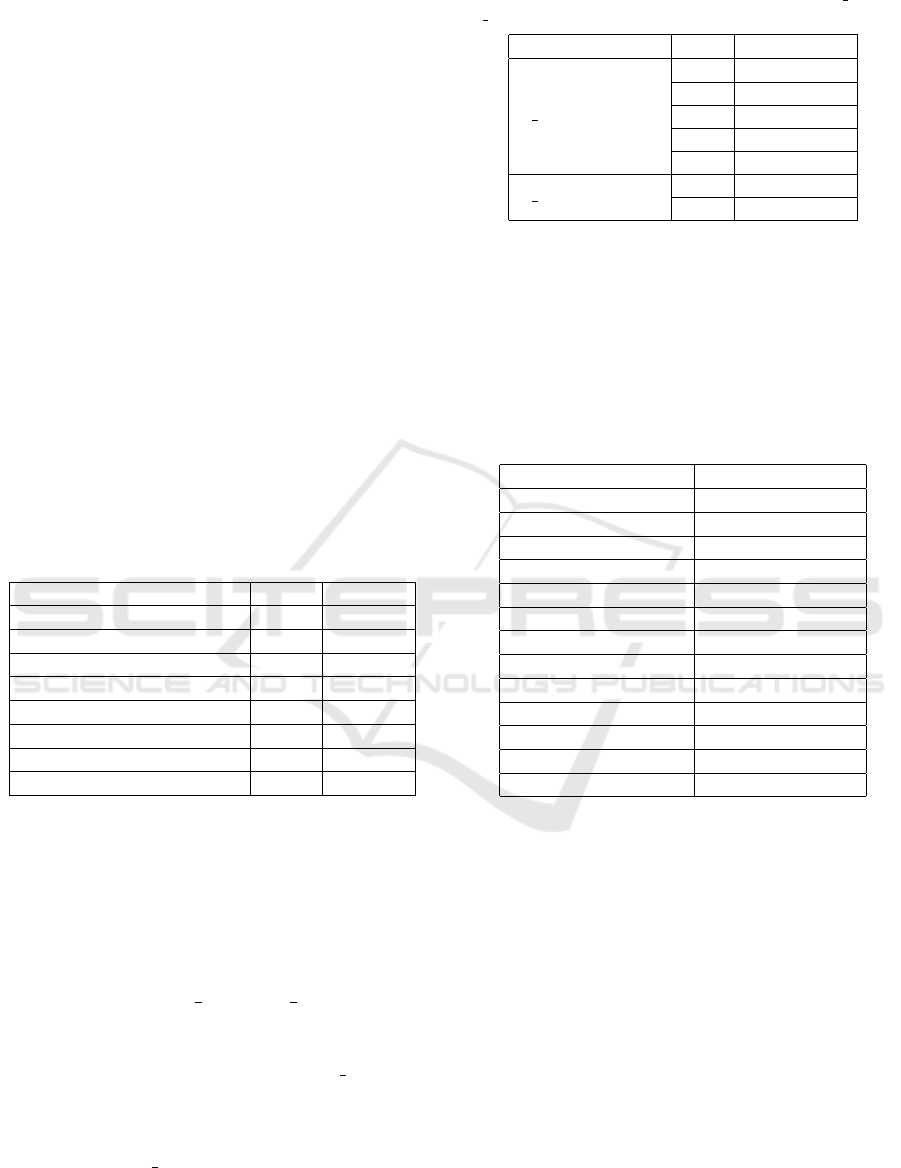
Table 2: Selected schedules for the benchmark 4 4a and
5 1a. The lines cowered by schedules are presented.
Vehicle schedule Line Stops count
4 4a
4 20
14 20
1m 13
5a 16
5b 15
5 1a
5a 16
5b 15
According to the optimal solution of the bench-
mark, 7477m of road segments were selected for
building overhead charging lines. The total length
of all road segments were 35566m, which means that
approximately 21% were selected. Selected road seg-
ments are listed in Table 3 and visually illustrated in
Figure 4.
Table 3: Selected road segments in optimal solution.
Starting node Ending node
Halkova Policia
Policia Hurbanova
Hurbanova Zeleznicna stanica
Sv. Cyrila a Metoda Obchodna
Jasenova Limbova
Polna Hlinska
Matice slovenskej Fatranska
Stefanikovo namestie Zeleznicna stanica
Hurbanova Policia
Mostna Hlinska
Polna Smrekova
Smrekova Limbova
Limbova Jasenova
According to benchmark results in Table 4, it is
clear, that adjustment of the model had a positive im-
pact on the process of solving the given problem. As
we can see the number of constraints increased, while
the number of variables stays the same. After the
pre-solve process, the number of variables decreased
significantly specifically using edited model formula-
tion. Pre-solve in IP solver attempts to simplify the
problem by detecting and removing redundant con-
straints, tightening variable bounds, etc.
Moreover, using the original model formulation
the solver was unable to successfully finish the bench-
mark run, because of lack of available RAM. On the
other hand, the optimal solution was found using the
edited model. Running time was also shorter using
the edited model.
ICORES 2020 - 9th International Conference on Operations Research and Enterprise Systems
190

Figure 4: Illustration of bus lines 1, 4, 5 and 14 in Zilina.
Selected edges for installing overhead charging wires are
marked as red.
Table 4: Models comparation.
Original
model
Edited
model
Constraints (initial) 76 336
Constraints (pre-solved) 76 336
Variables (initial) 3816093 3816093
Variables (pre-solved) 2099867 1482018
Running time (s) 6134 3248
Objective
function value
7478 7477
Optimal solution
out of
memory
yes
6.2 Benchmark 24 5 and 26 3
In second benchmark we also selected two schedules
presented in Table 5.
The first schedule of a vehicle named 24 5, which
serves 14 service strips. Mainly trips of line 24, but
also serves shortened service strip on line 30. The
second schedule 26 3 serves 11 service trips on line
26. Individual routes from selected schedules are il-
lustrated in Figure 5.
In this case, according to benchmark results in Ta-
ble 6, we can tell that the optimal solution was found
using both models. The optimization process was
Table 5: Selected vehicle schedules.
Vehicle schedule Line Stops count
25 5
24 20
24 7
30 6
26 3
26a 17
26b 18
26 9
Table 6: Models comparation.
Original
model
Edited
model
Constraints (initial) 108 380
Constraints (pre-solved) 107 379
Variables (initial) 4020976 4020976
Variables (pre-solved) 2295378 1106005
Running time (s) 800 1299
Objective
function value
10566 10566
Optimal solution yes yes
faster using the original model formulation.
The optimal solution of the second benchmark
tells that 10566m of road segments were selected for
building overhead charging lines. The total length of
all road segments were 53984m, which means that ap-
proximately 19.6% were selected. Selected road seg-
ments are listed in Table 7 and visually illustrated in
Figure 5.
Table 7: Selected road segments in optimal solution.
Starting node Ending node
Priehradna Furdekova
Hurbanova Zeleznicna stanica
Zeleznicna stanica Stefanikovo namestie
Predmestska Kosicka TESCO hyp.
Kosicka TESCO hyp. Pri celulozke
Potoky Dolna trnovska
Pri celulozke Kosicka TESCO hyp.
Predmestska Stefanikovo namestie
Stefanikovo namestie Zeleznicna stanica
Zeleznicna stanica Hurbanova
Kysucka Namestie hrdinov
Jastrabia Vrania
Vrania Jastrabia
Kysucka Zeleznicna stanica
Internatna Univerzitna
Internatna Vysokoskolakov plavaren
7 CONCLUSIONS
We can expect that the demand for the inclusion of as-
sisted trolleybuses technology in urban transport will
have an increasing trend. In this case, reliable ways of
solving related problems need to be researched (Gry-
gar et al., 2019).
This paper briefly explains the required data con-
version approach and mathematical model required
for creating a minimal network of overhead wires that
Linear Model Adjustment and Approximate Approach for Creating Minimal Overhead Wires Network for Vehicle Schedules
191

Figure 5: Illustration of bus lines 24, 26 and 30 in Zilina.
Selected edges for installing overhead charging wires are
marked as red.
would be enough for deployment and operation of
such battery-assisted trolleybuses.
Performed computational tests demonstrate the
suboptimal approach on how to solve this problem
for selected vehicle schedules. According to the first
benchmark, we can see, that performed condition ad-
justment in the model can be beneficial for solving
similar problems. The presented solutions show that
around 20% coverage was needed for the operation
of such vehicles. We can see, that selected segments
were mostly in the centre of the city. This is caused
by the fact that most of the bus lines connect the city
centre with other areas.
We will try to improve our approach to future re-
search. Vehicle SOC needs to be preserved from the
end of a route to start of next one. After that, we will
be able to find optimal solutions for vehicle schedules.
Lastly, the route’s nodes number can have a seri-
ous impact on the solvability of the problem. There-
fore, in future research, we will try to combine nearby
route segments or simplify the peripheral edges (Gry-
gar and Kohani, 2019b). We will also investigate
other methods of creating a more efficient model.
Heuristic approach options may need to be considered
for large scale tasks as well.
ACKNOWLEDGEMENTS
The authors would like to thank VEGA 1/0689/19
”Optimal design and economically efficient charging
infrastructure deployment for electric buses in pub-
lic transportation of smart cities” and APVV-15-0179
Reliability of emergency systems on infrastructure
with uncertain functionality of critical elements.
REFERENCES
Bartomiejczyk, M. (2017). Practical application of in mo-
tion charging: Trolleybuses service on bus lines. 2017
18th International Scientific Conference on Electric
Power Engineering (EPE), pages 1–6.
Bartomiejczyk, M., Stskala, V., Hrbac, R., and Poom, M.
(2013). Trolleybus with traction batteries for au-
tonomous running.
Bergk, F., Biemann, K., Lambrecht, U., Ptz, R., and
Landinger, H. (2016). Potential of in-motion charging
buses for the electrification of urban bus lines. Jour-
nal of Earth Sciences and Geotechnical Engineering,
6:347–362. Scienpress Ltd.
Ghlich, D., Kunith, A., and Ly, T. (2014). Technology as-
sessment of an electric urban bus system for berlin.
WIT Transactions on The Built Environment, 138:13.
20th International Conference on Urban Transport and
the Environment, Portugal.
Grygar, D. and Kohani, M. (2019a). Covering of the battery
assisted trolleybus fleet schedules by minimal over-
head wires network. The 13th International Confer-
ence on Multiple Objective Programming and Goal
Programming (MOPGP), Marrakech, Morocco. In
print.
Grygar, D. and Kohani, M. (2019b). Data conversion and
exact approach to overhead wires network minimisa-
tion for the battery assisted trolleybus fleet. The 15th
International Symposium on Operations Research in
Slovenia — 25th 27th September 2019, Bled, Slove-
nia.
Grygar, D., Kohani, M., Stefun, R., and Drgona, P. (2019).
Analysis of limiting factors of battery assisted trolley-
buses. Transportation Research Procedia, 40:229 –
235. TRANSCOM 2019 13th International Scientific
Conference on Sustainable, Modern and Safe Trans-
port.
He, F., Chen, Z., and Yin, Y. (2016). Optimal deployment
of charging lanes for electric vehicles in transportation
networks. Transportation Research Part B: Method-
ological, 91:344 – 365.
Hwang, I., Jang, Y., Ko, Y., and Lee, M. (2018). System
optimization for dynamic wireless charging electric
vehicles operating in a multiple-route environment.
IEEE Transactions on Intelligent Transportation Sys-
tems, 19(6):1709–1726. cited By 7.
Janacek, J. and Kvet, M. (2016). Sequential approximate
approach to the p-median problem. Computers & In-
dustrial Engineering, 94.
Janek, J., Kohni, M., Szendreyov, A., and ubo Buzna
(2015). Diskrtna optimalizcia. EDIS vydavatestvo
ilinskej univerzity. Fakulta riadenia a informatiky,
ilinsk univerzita, Katedra matematickch metd a oper-
anej analzy.
Janek, J. and Kovaikov, J. (1999). Porovnanie prstupov za-
loench na dulnom prstupe pre rieenie umiestovacch
loh. Komunikcie - Vedeck listy ilinskej univerzity,
pages 4–8. Vydanie: 2/99.
Janosikova, L., Jankovic, P., and Kvet, M. (2017). Improv-
ICORES 2020 - 9th International Conference on Operations Research and Enterprise Systems
192

ing emergency system using simulation and optimiza-
tion.
Janovec, M. and Kohni, M. (2019). Exact approach to
the electric bus fleet scheduling. Transportation Re-
search Procedia, 40:1380 – 1387. TRANSCOM 2019
13th International Scientific Conference on Sustain-
able, Modern and Safe Transport.
Jaosikova, L. and Jankovic, P. (2018). Emergency medical
system design using kernel search. 2018 IEEE Work-
shop on Complexity in Engineering (COMPENG),
pages 1–6.
Kooten Niekerk, M., Akker, J., and Hoogeveen, J. (2017).
Scheduling electric vehicles. Public Transport, 9.
Kvet, M. (2019). Fast approximate algorithm for robust
emergency system design. pages 1–6.
Montoya, A., Guret, C., Mendoza, J. E., and Villegas, J. G.
(2017). The electric vehicle routing problem with
nonlinear charging function. Transportation Research
Part B: Methodological, 103:87 – 110. Green Urban
Transportation.
Pisko, M. (2017). Vyehradsk iniciatva pre transparentn
mestsk spolonosti. Prpadov tdia, Slovensko, Dopravn
podnik Bratislava, a.s., Transparency International
Slovensko.
Rice, D., Sderholm, T., and Mortensen, O. W. (2017).
Trolleybus extension to laksevg. Teknisk Forprosjekt.
Hordaland Fykeskommune.
Ritter, A., Elbert, P., and Onder, C. (2016). Energy saving
potential of a battery-assisted fleet of trolley buses.
IFAC-PapersOnLine, 49(11):377 – 384. 8th IFAC
Symposium on Advances in Automotive Control AAC
2016.
Rogge, M., Wollny, S., and Sauer, D. U. (2015). Fast charg-
ing battery buses for the electrification of urban pub-
lic transporta feasibility study focusing on charging
infrastructure and energy storage requirements. Ener-
gies, 8(5):4587–4606.
Saft (2016). Sth ni-cd battery range - high power for hybrid
electric vehicles and automated guide vehicles. Saft
Industrial Battery Group. France.
Ushijima-Mwesigwa, H., Khan, M. Z., Chowdhury, M. A.,
and Safro, I. (2017). Optimal installation for electric
vehicle wireless charging lanes. Clemson University,
Clemson SC, USA. School of Computing, Department
of Civil Engineering.
Yang, S. C., Li, M., Lin, Y., and Tang, T. Q. (2014). Elec-
tric vehicle’s electricity consumption on a road with
different slope. Physica A Statistical Mechanics and
its Applications, 402:41–48.
Linear Model Adjustment and Approximate Approach for Creating Minimal Overhead Wires Network for Vehicle Schedules
193
