
Guidelines for Effective Automatic Multiple Sclerosis Lesion
Segmentation by Magnetic Resonance Imaging
Giuseppe Placidi
1 a
, Luigi Cinque
2
and Matteo Polsinelli1
1
1
A
2
VI-Lab, c/o Department of Life, Health and Environmental Sciences, University of L’Aquila, Coppito 2 AQ, 67100, Italy
2
Department of Computer Science, Sapienza University of Rome, Via Salaria 113 RM, 00198, Italy
Keywords:
Image Identification, Image Segmentation, Multiple Sclerosis, MRI, Convolutional Neural Networks.
Abstract:
General constraints for automatic identification/segmentation of multiple sclerosis (MS) lesions by Magnetic
Resonance Imaging (MRI) are discussed and guidelines for effective training of a supervised technique are pre-
sented. In particular, system generalizability to different imaging sequences and scanners from different man-
ufacturers, misalignment between images from different modalities and subjectivity in generating labelled im-
ages, are indicated as the main limitations to high accuracy automatic MS lesions identification/segmentation.
A convolutional neural network (CNN) based method is used by applying the suggested guidelines and pre-
liminary results demonstrate the improvements. The method has been trained, validated and tested on publicly
available labelled MRI datasets. Future developments and perspectives are also presented.
1 INTRODUCTION
Multiple sclerosis (MS) is a degenerative disease of
the brain and spinal cord which can vary greatly be-
tween patients in severity and symptoms (Steinman,
1996). The majority of patients transit into a progres-
sive phase consisting in an unremitting and progres-
sive accumulation of disability. Actually there is no
cure for MS and existing therapies focus on symp-
tomatic management and prevention of further dam-
age, with variable effectiveness, though recent ad-
vancements are promising. MS origins are not well
understood but characteristic signs of tissue damages
are recognizable, such as white matter lesions and
brain atrophy or shrinkage due to degeneration. These
signs can be observed by MRI which is a special tool
to follow-up MS patients with reduced invasiveness
due to the usage of specific contrast agents. In fact,
focal lesions in the brain and spinal cord are primar-
ily visible in the white matter on structural MRI ob-
servable as hyperintensities on T2-weighted images,
proton-density images (PD), or fluid-attenuated inver-
sion recovery images (FLAIR), and as hypointensi-
ties, or “black holes”, on T1-wheighted images (Fil-
ippi et al., 2019). These imaging procedures are all
performed in a single MRI examination and the corre-
sponding slices (hundreds) are all used for MS moni-
toring and follow-up (also comparisons with previous
examinations are necessary). Identification of the le-
a
https://orcid.org/0000-0002-4790-4029
sions affecting the white matter and their count and
volume calculation by MRI have become well es-
tablished protocols for assessing the disease progres-
sion and pharmacological efficacy. For this reason,
MRI is currently used routinely in clinical practice:
imaging markers are capable to capture volumetric
changes but need to be assisted by an expert, either
human or automatic. However, the richness of MRI
parameters/imaging modalities if, by one side, con-
stitutes an advantage for gathering fundamental infor-
mation about MS lesions, by the other it makes the de-
sign of efficient automatic experts a real challenge be-
cause images and, hence, the corresponding features,
change with magnetic field strength, imaging parame-
ters, sequences and scanners from different manufac-
turers (Siemens, Philips, GE, etc.). To these modifi-
cations, a trained human eye suddenly adapts but an
automatic expert has to be deeply trained before its
adaptation. But, is this really necessary?
In what follows we describe some guidelines
for automatic segmentation of MS lesions identifica-
tion/segmentation by MRI and discuss how to allow
an automatic system to perform at best. Moreover, we
present a strategy to improve lesion identification and
segmentation. To the best of our knowledge, the pro-
posal of preliminary conditions for correct MS lesion
identification/segmentation by MRI is new and nec-
essary to obtain better performance from automatic
methods. The manuscript is structured as follows:
Section 2 provides the related work, Section 3 dis-
cusses some critical points and presents the guide-
570
Placidi, G., Cinque, L. and Polsinelli, M.
Guidelines for Effective Automatic Multiple Sclerosis Lesion Segmentation by Magnetic Resonance Imaging.
DOI: 10.5220/0009150705700577
In Proceedings of the 9th International Conference on Pattern Recognition Applications and Methods (ICPRAM 2020), pages 570-577
ISBN: 978-989-758-397-1; ISSN: 2184-4313
Copyright
c
2022 by SCITEPRESS – Science and Technology Publications, Lda. All rights reserved

lines, Section 4 shows the effects of using the pro-
posed guidelines on a benchmark automatic method
and Section 5 concludes the paper and presents future
developments.
2 RELATED WORK
MRI is considered the gold standard for identifica-
tion and evaluation of MS lesions affecting white mat-
ter, thanks to its richness ofparameters, which allow
to highlight lesions with respect to the healthy tissue
also by using specific contrast agents (Di Giuseppe
et al., 2001; Placidi, 2012). Hundreds of MRI slices
composing a single 3D examination are usually anal-
ysed by expert radiologists: the operation is time
consuming, subjective and difficult to be carried out
without errors due to the huge number of evaluations
and comparisons required for each of the identified
lesions. Moreover, additional evaluations and com-
parisons are required between the current examina-
tion and previous ones to quantify the progression of
disease (Placidi et al., 2003). In fact, both the num-
ber of new lesions occurring after the last control and
the increment in extension of the old lesions are use-
ful parameters to define the status of disease. This
pushes the development of automatic lesion identifi-
cation/segmentation strategies.
Regarding automatic segmentation of MS lesions
by MRI, several attempts have been done with suc-
cess, though the variability of MS lesions in size,
shape, intensity and localization make automatic and
accurate identification and segmentation really chal-
lenging (Garc
´
ıa-Lorenzo et al., 2013; Danelakis et al.,
2018; Commowick et al., 2018). Though classical
techniques, based on shapes (Franchi et al., 2009;
Maurizi et al., 2009), could be effective, a partic-
ular attention to deep neural networks is necessary,
due to their accuracy in solving computer-vision tasks
with low manual intervention with respect to other
approaches. The great advantage of deep learning is
that the feature set would be no longer defined by the
user but learned directly by the system from the train-
ing images. This is a useful property because it is
often difficult for people to characterize features that
best serve to separate healthy tissue from MS lesions.
From the perspective of deep learning application, the
high dimensionality of the MR images, the difficulty
of obtaining reliable ground truth and the high ac-
curacy required for clinical practice, all contribute to
make MS lesion identification/segmentation a worthy
test application. CNN have demonstrated breaking
performance also in brain imaging segmentation (Yoo
et al., 2014; Vaidya et al., 2015; Valverde et al., 2017).
In particular, Yoo et al. were the first to propose an
automated learning approach for MS lesion segmen-
tation. Besides the architecture of the used system,
the interesting innovations were that 3D patches of
the MRI volume were used. In 2015, Vaidya et al.
proposed a method that used 3D CNNs to learn fea-
tures by different datasets of the same patient: T1-
w, T2-w, PD and FLAIR MRIs. The method pro-
posed in (Valverde et al., 2017) has proven to use ef-
ficiently the information carried on by different MRI
imaging modalities by reducing the number of param-
eters (and hence the training set) through the usage of
two CNNs in cascade, trained separately. To date, the
method presented in (Valverde et al., 2017) represents
for MS lesion segmentation one of the benchmark
architectures. In fact, a comparative study of algo-
rithms for MS lesion segmentation for MICCAI2016
international challenge (http://www.miccai2016.org),
presented in (Commowick et al., 2018), demonstrated
that the method in (Valverde et al., 2017) was estab-
lished as one of the most effective for MS lesion seg-
mentation, though the best method was that obtained
by creating a consensus between the results of all the
compared methods. However, though advanced com-
puter vision techniques have been compared in (Com-
mowick et al., 2018), the results were modest with re-
spect to other field of applications. In what follows we
discuss the reasons of poor results and suggest guide-
lines to allow better efficacy for automatic strategies.
3 GENERAL CONSIDERATIONS
AND GUIDELINES
DEFINITION
Though MRI is considered a gold standard, the cor-
rect interpretation of MS lesions through MRI is still
a subject of debate (Filippi et al., 2019) due to the
fact that MS lesions can be easily misdiagnosed or
erroneously interpreted (confused with other diseases
and/or artifacts and/or tissue modifications with age)
also by expert, trained radiologists and guidelines for
radiologists are continuously updated to overcome
misdiagnosis (Filippi et al., 2019; Thompson et al.,
2018). Moreover, in (Filippi et al., 2019) it is also
affirmed that misdiagnosis also depends on the used
MRI scanner. As a consequence, expert radiologists
often disagree when performing independent diagno-
sis of the same data, both due to the ambiguity be-
tween MS lesions and other diseases and because
they could have gathered their experience on different
scanners. This disagreement is confirmed in (Com-
mowick et al., 2018) where data contained into the
Guidelines for Effective Automatic Multiple Sclerosis Lesion Segmentation by Magnetic Resonance Imaging
571

MICCAI2016 dataset from 53 patients were inter-
preted by 7 independent radiologists: the resulting la-
belled version of the MRI images were obtained by
producing a consensus between them. This repre-
sent the first fact which distinguish MS interpretation
with respect to other computer vision problems: the
problem is not uniquely defined. This, obviously, re-
flects on the performance of any potential automatic
strategy because also the ground-truth used for train-
ing could confuse it. In addition, other important
considerations have to be done regarding data them-
selves for which we continue to refer to the MIC-
CAI2016 dataset (Commowick et al., 2018), being
one of the most important benchmark datasets actu-
ally available to test automatic MS lesion identifica-
tion/segmentation strategies. MICCAI2016 dataset
is composed by MRI images collected with different
imaging modalities (PD,T1-w, T2-w and 3D FLAIR),
from different centres, with 4 different scanners per-
forming at different magnetic fields (one at 1.5 T and
three at 3T), by three different manufactures (Philips,
Siemens and GE). Data for the challenge were divided
in two groups: those from 15 patients were furnished
labelled to the participants to train their methods (at
the end of the process, the participants were asked to
provide their code for internal test); those from 38 pa-
tients were maintained secret and used by the person-
nel of the challenge to evaluate the performance of
the methods participating to the challenge. The first
group contained patients from all the centres and from
all the scanners except one, the GE scanner, whose
data were maintained obscured to verify the robust-
ness of the algorithms when using a scanner differ-
ent from those used for training. Data were furnished
both in unpreprocessed and in preprocessed form.
The unpreprocessed form consisted of raw data, as
produced by scanners, while preprocessed data con-
sisted in performing the following steps:
• Denoising of each modality;
• Rigid registration of each modality on the FLAIR
image;
• Brain extraction (skull stripping) from T1-w im-
age and applied to other modalities;
• Bias field correction of each modality.
For the methods used in different steps, please re-
fer to (Commowick et al., 2018). Any participant
group, for its strategy, was free to use or not the all
imaging modalities and to choice between unprepro-
cessed or preprocessed data. In fact, some of them
decided to use a reduced set of imaging modalities
and/or to use unpreprocessed data. The evaluated 13
identification/segmentation strategies were all tested
by using F1-score and Dice-score, the first to test the
capability in identifying a lesion and the second for
measuring the capability in segmenting correctly a le-
sion (being both identification and segmentation nec-
essary parameters to establish the progression of the
disease). Results demonstrated that any of the pre-
sented methods performed worse than the worst hu-
man radiologist (compared with the ground-truth ob-
tained by merging the identification/segmentation by
the 7 radiologists) both in F1-score and in Dice-score
that these performances got worse when the methods
were tested on data from the secret scanner (GE), on
which no strategy was trained before. The identifi-
cation/segmentation results slightly improved if the
output of all strategies were merged in a consensus:
in this way, the results were almost comparable with
those of the worst human expert.
Besides the considerations in (Commowick et al.,
2018), some important aspects have to be under-
lined (Roy et al., 2018):
1. MS lesion identification/segmentation depends,
among other factors, on imaging scanners due to
differences in imaging parameters, temporization,
features, magnetic field values and homogeneity,
etc., which could have more influence on auto-
matic methods than on human experts because hu-
mans use also other implicit information (clinical
or anatomical concepts, etc.) to evaluate the im-
age content: a huge increment of data for train-
ing should be necessary to include differences be-
tween scanners into an automatic system;
2. MS lesion identification/segmentation depends
on the used data pre-processing strategy which
should be part of the method itself: the indis-
tinct free usage of data (preprocessed or unprepro-
cessed) could greatly affect the convergence of the
method and the training dataset dimension;
3. An MS lesion identification/segmentation strategy
depends on the imaging modalities it uses (FLAIR
and T2-w images are more informative than PD
or T1-w (Filippi et al., 2019): the indistinct usage
of all the modalities to train an automatic strategy
probably results in a decrement of convergence
speed and has to imply an increment of the dataset
used for training.
The previous considerations found their confirma-
tion in the contrasting results reported in (Commow-
ick et al., 2018): the methods performance decreased
when used on data from a previously unseen scanner;
methods which used preprocessed data were not all
better than those using unpreprocessed data; methods
using all the imaging modalities were not always bet-
ter than those using just some imaging modalities.
To better explain these apparently strange be-
ICPRAM 2020 - 9th International Conference on Pattern Recognition Applications and Methods
572

haviours, please consider data presented in Figures 1
and 2, where some images, from the MICCAI2016
dataset, collected by different scanners are reported
for all the imaging modalities, both before (Figure
1) and after preprocessing (Figure 2). For the same
images, an horizontal line of data (red line) is also
plotted below (Figure 1b and Figure 2b). As can
be noted, unpreprocessed data show relevant differ-
ences between scanners (though data allowed to dif-
ferent patients, it is clearly visible the ratio between
the amplitude of different tissues in the same image
are different for the two scanners, as it is also con-
firmed by comparing the image corresponding to the
same imaging sequences): these differences, which
distinguish MRI from CT (where images from differ-
ent scanners are scalable in amplitude and easily com-
pared), are due to different imaging parameters opti-
mization by different manufacturers, though using the
same imaging sequences.
In Figure 2, the situation after preprocessing, an
amplitude normalization between different images
has occurred. In fact, the images of different scan-
ners are more similar than those before preprocess-
ing. However, from Figure 2b it can be observed
that the preprocessing step produced a variation on
the baseline of some of the images (the signal out-
side the brain, which should be zero, has a level well
above zero). Moreover, each image was normalized
independently from the other: this implied a modi-
fication which has been different from one image to
the other, thus introducing substantial differences also
on data from the same scanner. Finally, the ampli-
tude ratio between different tissues in the same im-
age has not been rightly corrected and, in some cases,
differences between data coming from different scan-
ners were increased. This is probably the reason why
some automatic strategies, though using preproessed
data, performed worse than those using original, un-
preprocessed, data. Finally, from both Figure 1 and
2, it can be noted that the information carried on by
different imaging modalities regarding MS lesions is
completely different: iperintense regions on FLAIR
images which are also iperintense on the correspond-
ing T2-w images surely indicate MS lesions (Filippi
et al., 2019). The other imaging modalities (T1-w and
PD) do not add anything more and, often, their con-
tent is confusing and not clearly interpretable (as in
the MS lesions indicated by the green arrows, both in
Figure 1 and Figure 2).
Form the above considerations, the following
guidelines could be derived:
1. The training of the method should be done on data
from a single scanner (also humans adapt to the
scanner they normally use): when data from dif-
ferent scanners need to be interpreted and, may
be, compared, the system has to be trained sepa-
rately to each scanner (in this way, the training set
can be reduced, the procedure shortened and the
performance increased);
2. A preprocessing strategy, consisting in the rigid
registration of each modality on the FLAIR im-
age, is necessary to obtain images of differ-
ent modalities which are spatially correspondent.
Other forms of preprocessing, especially those
consisting in amplitude corrections, have to be
performed on the whole volume and not differ-
ently on each single slice. Moreover, preprocess-
ing has to become part of the automatic segmen-
tation method;
3. The image modalities to be used in the identifi-
cation/segmentation process have to be chosen in
advance to avoid useless/confusing information,
unjustified increment of the training dataset, con-
vergence deceleration and performance reduction
(FLAIR and T2-w images are sufficient).
In what follows, we show how, by applying
the previously defined guidelines, it is possible to
improve the performance of a lesion segmentation
method.
4 MS LESION IDENTIFICATION/
SEGMENTATION
Being a benchmark method, we have used the super-
vised CNN-based paradigm presented in (Valverde
et al., 2017) that has also been used, in a modified
version, in (Placidi et al., 2019). In particular, by fol-
lowing the previously defined guidelines, we operated
the following choices:
1. the dataset used for training, validation and test
was the MICCAI2016 dataset but just using data
from a single 3T scanner (Philips manufacturer);
2. raw, unpreprocessed, data were preprocessed by
performing rigid registration of each modality on
the FLAIR image followed by brain extraction
(skull stripping) from T1-w image and applied to
other modalities;
3. only FLAIR and T2-w imaging modalities were
used for identification/segmentation. In this way,
we provided a simpler task to the system, thus
reducing the dimension of the training, labelled,
dataset. The images selected from the dataset
were distributed in three subsets: 800 for train-
ing, 200 for validation and 100 for test. A scheme
Guidelines for Effective Automatic Multiple Sclerosis Lesion Segmentation by Magnetic Resonance Imaging
573

PD
T1
T2
FLAIR
PhilipsSiemens
PD T1 T2 FLAIR
PhilipsSiemens
a)
b)
Figure 1: Raw, unprocessed, data from different scanners (rows) and from different imaging modalities (columns). Images
are reported in (a) and plots of a single row of the images (along the red line) are shown in (b). The position of a lesion along
the red line is indicated by an arrow. The shrinkage of the FLAIR image from Siemens scanner is due to a different (greater)
dimension of the voxel in the horizontal direction.
of the assembly used for MS lesion identifica-
tion/segmentation is reported in Figure 3.
The method is based on a cascade of two CNNs.
The low variation in contrast of MRI images, the use
of images from just one scanner and the reduction of
imaging modalities, allow simple network architec-
tures and a reduction of the training set dimension.
The system consists of a 7-layers architecture for each
of the two CNNs. Each network is composed by two
stacks of convolution and max-pooling layers with 32
and 64 filters, respectively. Convolutional layers are
followed by a fully-connected layer of size 256 and
a soft-max fully connected layer of size 2 whose out-
put is the probability of each voxel to belong to a le-
sion. For a complete settlement of the used parame-
ters, please refer to (Valverde et al., 2017). MS lesions
are calculated using 3D neighboring patch features.
The used 3D patches are cubic, 11x11x11 voxels. The
splitting in two different CNNs allows to separate the
training procedure in two and this allows a reduction
of the number of parameters without reducing accu-
racy. To reorder data balance for training, that is to
equilibrate the number of “positive” patches (contain-
ing lesions) with “negative” patches (containing no le-
sions, much greater than the other), the dataset used
for training consists of the whole dataset of positive
patches and of an equal number of randomly selected
negative, healthy patches. In this way, the first net-
work (CNN1) is trained by using the resulting bal-
anced dataset and then tested on the whole dataset,
thus obtaining a list of probabilities for each voxel of
each patch to be “positive” (part of a lesion). Af-
ter that, a balanced dataset is created by using the
previous test results and by considering as positive
all patches containing voxels whose probability is
greater than 0.5. As for the previous balanced training
dataset, negative patches (those in which all voxels
had probability <0.5), are randomly selected to be the
same number of “positive” patches. The second net-
work (CNN2) is trained from scratch with the dataset
resulting from CNN1. Once the whole pipeline is
trained, new unseen MRI volumes can be processed
using the same, two stage, architecture. The dataset
is first decomposed in patches and, then, all volume
patches are evaluated using CNN1. CNN1 discards
all voxels with low probability (< 0.5). The rest of
ICPRAM 2020 - 9th International Conference on Pattern Recognition Applications and Methods
574
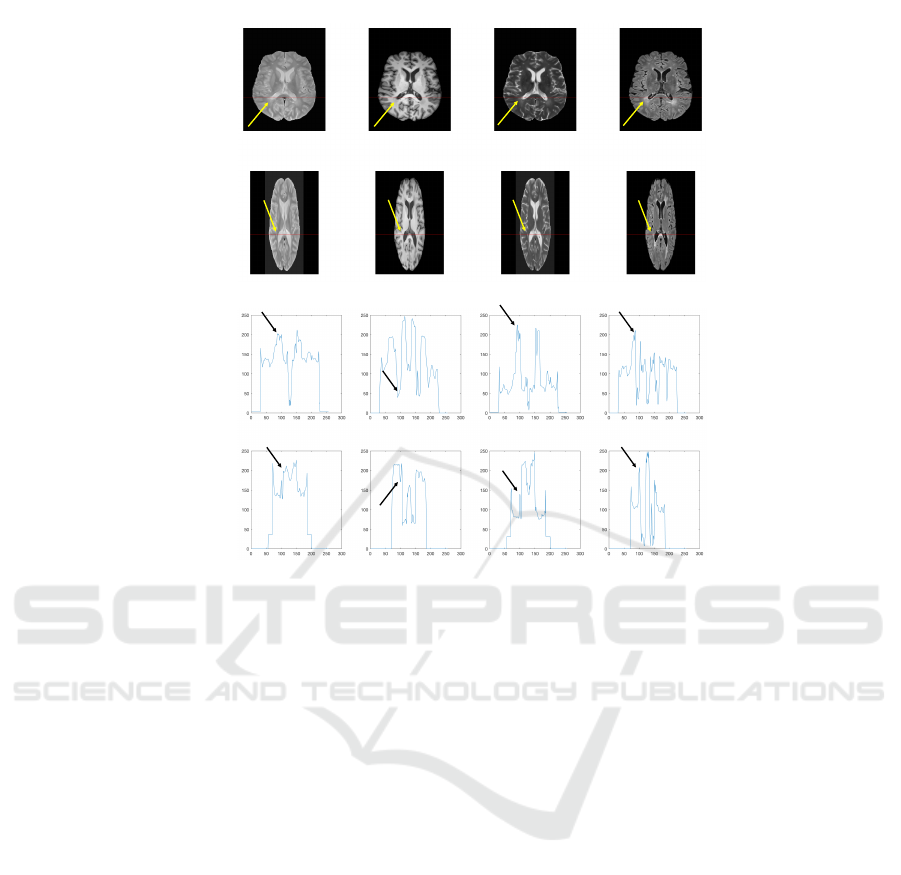
PD T1 T2 FLAIR
PhilipsSiemens
PD T1 T2 FLAIR
PhilipsSiemens
a)
b)
Figure 2: Data of Figure 1 after preprocessing. Images are reported in (a) and plots of a single row of the images (along the
red line) are shown in (b). The position of a lesion along the red line is indicated by an arrow. Images have been also reshaped
after their co-registration.
the voxels, included into corresponding patches, are
re-evaluated by CNN2 to obtain the final probabilis-
tic lesion mask. Resulting binary masks (ones where
lesion are present, zeros elsewhere) are computed by
thresholding the probability lesion masks (prob > 0.5
are considered lesions). Finally, an additional false
positive reduction is performed by discarding binary
connected regions with very low number of positive
voxels (this number is calculated with respect to the
minimal volume of the lesions used for testing). The
method had an average F1 score of 0.68 and an av-
erage Dice score of 0.71 (about 25% better than the
original method (Valverde et al., 2017) and 15% bet-
ter than the modified method in (Placidi et al., 2019)
without using any artificial strategy for increasing the
training dataset of patches. The improvement with
respect to (Placidi et al., 2019), relevant if we con-
sider that it has been obtained with half of the imag-
ing modalities, is mainly due to the fact that it has
been obtained by training the method on data from
a single scanner and just from the most significant
imaging modalities, which simplifies the identifica-
tion/segmentation process. Moreover, these results
are significant because they allow to overcome the
score of the automatic ”Team fusion” and also of the
worst human expert (Commowick et al., 2018), thus
making automatic identification/segmentation accept-
able for MS diagnosis/analysis. In order to show the
results on the images, Figure 4 reports the worst-case
automatic identification/segmentation: the method al-
lows a discrete identification of the lesions (false pos-
itives are in red) and a good segmentation (false neg-
atives are in blue).
5 CONCLUSION
We have discussed some limitations that occur when
using automatic identification/segmentation of MS le-
sions by MRI data: the richness of imaging param-
eters and internal variability of MRI scanners make
the problem ambiguous and difficult. By consider-
ing these limitations we have extracted a set of basic
guidelines that the training dataset should have in or-
der to avoid confusion when training a supervised au-
tomatic identification/segmentation strategy. Finally,
we have applied these guidelines and used them while
performed training of a CNN-based strategy used as
a benchmark. The results are better than those ob-
tained without using the constraints on the training
Guidelines for Effective Automatic Multiple Sclerosis Lesion Segmentation by Magnetic Resonance Imaging
575

T2 W
CNN1
Conv – pool
layers
Fully
connected
Image
Patch
Flair
Image
Patch
CNN2
Conv – pool
layers
Fully
connected
Training
dataset
Figure 3: Two stage CNNs architecture used for identification/segmentation of MS lesions. Input of the system are the
registered volumes by FLAIR and T2-w images. Training of CNN2 is made with a separated dataset.
a) b)
Figure 4: MS lesion identification/segmentation on one of
the images (FLAIR) by MICCAI2016 used for test. In (a),
the ground-truth identification/segmentation is reported in
green; in (b), the same image is reported with indicated, in
colors, the voxels identified/segmented by the method: the
voxels rightly identified/segmented are indicated in green;
in red are those wrongly identified as lesions (false posi-
tive); in blue those are those wrongly recognized as healthy
tissue (false negative).
dataset, thus making the automatic method similar, in
performance, to a human expert. Moreover, we have
obtained a faster convergence of the method with re-
spect to use it with data from multiple scanners and/or
when using data from indistinct imaging modalities.
Future work will be dedicated to train the method
also by using the other imaging modalities in order to
test the effective usefulness of these modalities in the
MS identification/segmentation process. Moreover,
the method will be also trained on data coming from
different scanners in order to quantify the contribu-
tion of the scanner on the identification/segmentation
process and to verify if the method is generalizable to
different scanners. Finally, due to the reduction of the
dimension of the problem (data from just one scanner
and from two imaging modalities) we want to inves-
tigate the optimization of the method by proposing a
CNN-based approach defined on the whole image and
not on patches: this would be preferable for training
the method also regarding the position of the lesions
inside the image (white matter) and to reduce outliers.
REFERENCES
Commowick, O., Istace, A., Kain, M., Laurent, B., Leray,
F., Simon, M., Pop, S. C., Girard, P., Ameli, R., Ferr
´
e,
J.-C., et al. (2018). Objective evaluation of multiple
sclerosis lesion segmentation using a data manage-
ment and processing infrastructure. Scientific reports,
8(1):13650.
Danelakis, A., Theoharis, T., and Verganelakis, D. A.
(2018). Survey of automated multiple sclerosis le-
sion segmentation techniques on magnetic resonance
imaging. Computerized Medical Imaging and Graph-
ics, 70:83–100.
Di Giuseppe, S., Placidi, G., and Sotgiu, A. (2001). New ex-
perimental apparatus for multimodal resonance imag-
ICPRAM 2020 - 9th International Conference on Pattern Recognition Applications and Methods
576

ing: initial epri and nmri experimental results. Physics
in Medicine & Biology, 46(4):1003.
Filippi, M., Preziosa, P., Banwell, B. L., Barkhof, F., Cic-
carelli, O., De Stefano, N., Geurts, J. J., Paul, F., Re-
ich, D. S., Toosy, A. T., et al. (2019). Assessment
of lesions on magnetic resonance imaging in multiple
sclerosis: practical guidelines. Brain, 142(7):1858–
1875.
Franchi, D., Gallo, P., Marsili, L., and Placidi, G. (2009). A
shape-based segmentation algorithm for x-ray digital
subtraction angiography images. Computer methods
and programs in biomedicine, 94(3):267–278.
Garc
´
ıa-Lorenzo, D., Francis, S., Narayanan, S., Arnold,
D. L., and Collins, D. L. (2013). Review of au-
tomatic segmentation methods of multiple sclerosis
white matter lesions on conventional magnetic reso-
nance imaging. Medical image analysis, 17(1):1–18.
Maurizi, A., Franchi, D., and Placidi, G. (2009). An op-
timized java based software package for biomedical
images and volumes processing. pages 219–222.
Placidi, G. (2012). MRI: essentials for innovative technolo-
gies. CRC Press.
Placidi, G., Cinque, L., Polsinelli, M., Splendiani, A., and
Tommasino, E. (2019). Automatic framework for
multiple sclerosis follow-up by magnetic resonance
imaging for reducing contrast agents. In International
Conference on Image Analysis and Processing, pages
367–378. Springer.
Placidi, G., Sabatini, M., Gallucci, M., and Sotgiu, A.
(2003). A calculation method for semi automatic fol-
low up of multiple sclerosis by magnetic resonance
eco planar perfusion imaging. Studies in Health Tech-
nology and Informatics, 95:164–169.
Roy, S., Butman, J. A., Reich, D. S., Calabresi, P. A., and
Pham, D. L. (2018). Multiple sclerosis lesion segmen-
tation from brain mri via fully convolutional neural
networks. arXiv preprint arXiv:1803.09172.
Steinman, L. (1996). Multiple sclerosis: a coordinated im-
munological attack against myelin in the central ner-
vous system. Cell, 85(3):299–302.
Thompson, A. J., Banwell, B. L., Barkhof, F., Carroll,
W. M., Coetzee, T., Comi, G., Correale, J., Fazekas,
F., Filippi, M., Freedman, M. S., et al. (2018). Di-
agnosis of multiple sclerosis: 2017 revisions of the
mcdonald criteria. The Lancet Neurology, 17(2):162–
173.
Vaidya, S., Chunduru, A., Muthuganapathy, R., and Krish-
namurthi, G. (2015). Longitudinal multiple sclero-
sis lesion segmentation using 3d convolutional neural
networks. Proceedings of the 2015 Longitudinal Mul-
tiple Sclerosis Lesion Segmentation Challenge, pages
1–2.
Valverde, S., Cabezas, M., Roura, E., Gonz
´
alez-Vill
`
a,
S., Pareto, D., Vilanova, J. C., Rami
´
o-Torrent
`
a, L.,
Rovira,
`
A., Oliver, A., and Llad
´
o, X. (2017). Improv-
ing automated multiple sclerosis lesion segmentation
with a cascaded 3d convolutional neural network ap-
proach. NeuroImage, 155:159–168.
Yoo, Y., Brosch, T., Traboulsee, A., Li, D. K., and Tam, R.
(2014). Deep learning of image features from unla-
beled data for multiple sclerosis lesion segmentation.
In International Workshop on Machine Learning in
Medical Imaging, pages 117–124. Springer.
Guidelines for Effective Automatic Multiple Sclerosis Lesion Segmentation by Magnetic Resonance Imaging
577
