
Bank Credit Risk Management based on Data Mining Techniques
Fabio Martinelli
1
, Francesco Mercaldo
1,3
, Domenico Raucci
2
and Antonella Santone
3
1
Institute for Informatics and Telematics, National Research Council of Italy, Pisa, Italy
2
Department of Economic Studies, G. d’Annunzio University, Chieti-Pescara, Italy
3
Department of Biosciences and Territory, University of Molise, Pesche (IS), Italy
Keywords:
Bank Credit Risk Management, Credit Risk Assessment, Probability of Default, Loan Repayment Prediction,
Machine Learning, Classification, Association Rules, Data Mining.
Abstract:
In last years, data mining techniques were adopted with the aim to improve and to automatise decision-making
processes in a plethora of domains. The banking context, and especially the credit risk management area, can
benefit by extracting knowledge from data, for instance by supporting more advanced credit risk assessment
approaches. In this study we exploit data mining techniques to estimate the probability of default with regard
to loan repayments. We consider supervised machine learning to build predictive models and association rules
to infer a set of rules by a real-world data-set, reaching interesting results in terms of accuracy.
1 INTRODUCTION AND
BACKGROUND
The granting of loans by banks requires an accurate
assessment of the applicants’ creditworthiness. In
fact, when customer default, the bank suffers losses
of principal and interest, the interruption of cash flow
and an increase in collection costs. Credit Risk Man-
agement (CRM) is one of the core processes in banks
aimed at assessing, measuring, and controlling the
risks arising from the Probability of Default (PD) in
loan repayments. This process affects their strategic
and operational approaches regarding the diversifica-
tion of the loan portfolio and pricing, the most effi-
cient allocation of capital, the assessment of capital
and liquidity adequacy requirements, the commercial
policies for granting loans to customers, and so on
(Van Gestel and Baesens, 2008; Saunders and Allen,
2010). In recent years, these intrinsic factors of CRM
complexity have increased following the evolution of
legislation aimed at dealing with international finan-
cial crises and the potential default risks of banks
(Wilson et al., 2010; Giovannoni et al., 2016). In the
European context, the main measures in this area con-
cerned, among others: the new capital requirements
introduced in 2010 by “Basel III” (as a voluntary reg-
ulatory framework developed by the Basel Commit-
tee for Banking Supervision - BCBS), which will be
further strengthened in 2021 by “Basel IV”; the “Prin-
ciples for an Effective Risk Appetite Framework” is-
sued in 2013 by the Financial Stability Board; the new
measures on internal banking control systems, which
intensified “second level” control activities on credit
performance monitoring (EBA, 2011); the “Guidance
to banks on Non-Performing Loans” issued in 2017
by the European Central Bank; the new “Expected
loss approach” introduced by IFRS 9 - Financial in-
struments - which also impacted the managerial as-
sessments of the credit risk variables and the clas-
sification of the creditworthiness of customers. De-
spite the different perspectives, these measures affect
all phases of the bank CRM process. In particular,
they aim at strengthening the credit risk measurement
systems, with a significant impact on the calculation
of capital adequacy to be allocated to banking assets,
including loans granted, based on the risk weighs as-
signed to various exposures. In this way, for credit
risk, the Basel III framework provides a range of
options included between the standardized approach,
which weights bank exposure based on each bor-
rower’s external credit risk rating, and the Internal
Rating-Based (IRB) approach. The latter, provided in
a “foundation” and “advanced” version, allows banks
to rely on the different degrees of sophistication of
their internal measurement systems of the borrower’s
credit risk. Thus, their assessments of the customer’s
credit quality are directly reflected in the minimum
amount they must hold for capital adequacy require-
ments. These credit risk measurement systems, and in
particular the IBR ones, must support the bank CRM
Martinelli, F., Mercaldo, F., Raucci, D. and Santone, A.
Bank Credit Risk Management based on Data Mining Techniques.
DOI: 10.5220/0009371808370843
In Proceedings of the 6th International Conference on Information Systems Security and Privacy (ICISSP 2020), pages 837-843
ISBN: 978-989-758-399-5; ISSN: 2184-4356
Copyright
c
2022 by SCITEPRESS – Science and Technology Publications, Lda. All rights reserved
837

by providing increasingly sophisticated credit risk es-
timates associated, in particular, with the PD, which
measures the probability that the borrower will de-
fault in the next 12 months, the Loss Given Default
(LGD), which measures the amount of exposure that
will be lost if default occurs, and the Exposure At De-
fault (EAD), which measures for loan commitments
the amount of the facility that is likely to be drawn
if default occurs. The analysis of these credit risk
factors varies according to the role attributed by each
bank’s CRM to a series of variables that affect the as-
sessment of the applicant’s creditworthiness and the
related cost of the loan. These elements regarding
the type of client (private, corporate, public organi-
zations, etc.), the value of the collaterals, the role of
the customer in the commercial policies of the bank,
and other characteristics of the borrower’s credit his-
tory. In the case of a company, the assessments of
these factors are supported by quantitative parameters
(such as financial ratios), by qualitative parameters
(such as sector statistical indicators, or market posi-
tion of the company), by analyzing his dealing with
banking system and, above all, the credit history of
the company with the lending bank in order to de-
fine a credit score and estimate the PD (Van Gestel
and Baesens, 2008; Saunders and Allen, 2010). In
this framework, there are several approaches to credit
risk measurement used by banks, with a range of op-
tions variously investigated by the literature (Allen
and Powell, 2011; Altman et al., 2004; Onay and
¨
Ozt
¨
urk, 2018), which start from the external credit
ratings models, provided by companies specializing
in credit analysis, and extend to the models of multi-
ple discriminant credit scoring analysis pioneered by
Altman (Altman, 1968). However, recent data mining
and machine learning techniques allow banks to de-
velop more advanced models to forecast credit risks,
encouraging increasing investments in related predic-
tive analytics applications to support the CRM ap-
proaches (FBS, 2017). In fact, a “data-driven” bank
can take advantage of the enormous growth in data
in many perspectives, by extracting useful knowledge
from them to improve decision-making processes. In
other words, data mining represents the core of the
knowledge discovery process (Mackinnon and Glick,
1999) and their transformation into useful knowledge
has become a critical success factor in the manage-
ment of all companies, including banking (Chitra and
Subashini, 2013). Indeed, in the financial interme-
diation sector, the recent phenomenon of “FinTech”
is revolutionizing the drivers of consolidated business
models and the traditional market players (Goldstein
et al., 2019). In detail, data mining techniques can be
adopted in solving business problems by finding pat-
terns, associations and correlations which are hidden
in the business information stored in data-base (Fraw-
ley et al., 1992). In this way, literature has investi-
gated the effectiveness of data mining in bank CRM
through the use of different techniques such as ma-
chine learning (Lessmann et al., 2015), neural net-
works (Angelini et al., 2008), or hybrid models (Tsai
and Chen, 2010), in order to develop advanced risk
modeling approaches to estimate PD, or build early
warning models, or manage non-performing loans, or
analyze patterns and trends to predict how clients can
react to adjustments in interest rates, etc. (Saunders
and Allen, 2010; Kruppa et al., 2013; Chitra and Sub-
ashini, 2013; Bruno et al., 2015; Bj
¨
orkegren and Gris-
sen, 2018). The paper aims to contribute to this re-
search field by proposing some prediction models to
increase the reliability of credit risk assessments in
support of bank CRM. Our data mining techniques
i.e., supervised machine learning algorithms (Mer-
caldo et al., 2017; Mercaldo et al., 2016; Maiorca
et al., 2017; Martinelli et al., 2017b; Martinelli et al.,
2017a), are exploited to reduce the percentage of un-
safe borrowers. In detail, our aim is to investigate
the adoption of these techniques to develop more ad-
vanced credit risk measurement to tackle the problem
of estimating the PD on loan repayments. The main
difference with respect to the current state-of-the-art
is that we compare four different machine learning al-
gorithms. We provide explainability by exploiting lift,
curve and calibration plots. Our investigation shows
that these data mining techniques can significantly
improve credit scoring models used by banking man-
agement and provide more accurate information to the
loan decision-making process. This produces further
benefits, not only in the analysis of credit risks, but
also in the potential savings in the costs and time of
evaluation of loan applications and in the reduction of
uncertainty for lending officers given the higher levels
of knowledge extracted from previous loans granted.
The paper proceeds as follows: in next section we de-
scribe the proposed method, Section 3 presents the ex-
perimental analysis aimed to asses the proposed data
mining-based approach and, finally, conclusion and
future works are drawn in last section.
2 ESTIMATING THE PD ON
LOAN REPAYMENTS
The main aim of the following proposal is the appli-
cation of data mining techniques in the CRM domain
to improve banking credit risk assessment processes,
in particular, in particular with regard to estimate the
PD in loan repayments. In detail in this paper we con-
ForSE 2020 - 4th International Workshop on FORmal methods for Security Engineering
838

sider supervised machine learning techniques. In su-
pervised learning, the algorithm builds a mathemati-
cal model from a set of data that contains both the in-
puts and the desired outputs. For example, if the task
were determining whether an image contained a cer-
tain object, the training data for a supervised learning
algorithm would include images with and without that
object (the input), and each image would have a label
(the output) designating whether it contained the ob-
ject. In a nutshell, supervised machine learning builds
a model that makes predictions based on evidence in
the presence of uncertainty. A supervised learning al-
gorithm takes a known set of input data and known
responses to the data (output) and trains a model to
generate reasonable predictions for the response to
new data. The supervised techniques demonstrated
their effectiveness in several area, from diagnosis pre-
diction (Mercaldo et al., 2017; Brunese et al., 2020)
to malware detection (Cimitile et al., 2017a; Canfora
et al., 2018).
The first step for the adoption of a machine learn-
ing solution is the selection of a feature vector with
the correspondent label: in this way it is possible to
build the model (and evaluating the model on feature
vector without labels).
Figure 1 shows the proposed approach data
mining-based for estimating the PD in loan repay-
ments. As required by data mining techniques, we
infer knowledge from data, this is the reason why we
start from the data (i.e., Loan Data in Figure 1).
In this work we consider following features to
build a model for predicting loan repayment i.e., we
represent a new loan request by considering the fea-
tures in Table 1.
Table 1: The feature set.
# Feature Description
1 APPLICANT 0 = defaulting applicant in loan
repayment or with high PD;
1 = applicant paid loan
2 LOAN Amount of the loan request
3 MORTDUE Amount due on existing mortgage
4 VALUE Value of current property
5 REASON DebtCon = debt consolidation;
HomeImp = home improvement
6 JOB Occupational categories
7 YOJ Years at present job
8 DEROG Number of major derogatory reports
9 DELINQ Number of delinquent credit lines
10 CLAGE Age of oldest credit line in months
11 NINQ Number of recent credit inquiries
12 CLNO Number of credit lines
13 DEBTINC Debt-to-income ratio
The feature Application in the column #1 of Table
1 is the prediction i.e., the idea is to build a binary
classifier aimed to discriminate between between ap-
plicant fulfilling the payment (marked by the 1 value)
and a defaulting applicant in loan repayment or with
high PD (marked by the 0 value) in relation to a new
loan application.
For the supervised classification task, we exploit
four different classification algorithms (Jordan and
Mitchell, 2015; Mitchell, 1999):
• kNN: In the k-nearest neighbors algorithm an ob-
ject is classified by a plurality vote of its neigh-
bors, with the object being assigned to the class
most common among its k nearest neighbors;
• Random Forest: This represents an ensemble
learning method for classification, regression and
other tasks that operates by constructing a mul-
titude of decision trees at training time and out-
putting the class that is the mode of the classes;
• Neural Network: This algorithm considers struc-
tures connected in a way similar to neurons, this
neurons are able to send messages to each other to
output the predicted label;
• Naive Bayes: This algorithm in belonging to the
family of simple probabilistic classifiers based
on applying theorem of Bayes with strong inde-
pendence assumptions between the features under
analysis.
The classification analysis consists of building
several classifiers to evaluate the considered feature
vector (shown in Table 2) to discriminate between
paid and defaulted loan applicants (i.e., the Model
Building & Evaluation in Figure 1).
In this step, for training the classifiers, we defined
T as a set of labeled messages (M, l), where each M is
the label associated to paid and defaulted loan appli-
cants l ∈ {0, 1}. For each M we built a feature vector
F ∈ R
y
, where y is the number of the features used in
training phase (y = 12).
For the learning phase, we use a k-fold cross-
validation: the data-set is randomly partitioned into
k subsets. A single subset is retained as the validation
data-set for testing the model, while the remaining
k − 1 subsets of the original data-set are used as train-
ing data. We repeated the process for k = 10 times;
each one of the k subsets has been used once as the
validation data-set. To obtain a single estimate, we
computed the average of the k results from the folds.
We evaluate the effectiveness of the classification
method exploiting the following procedure:
1. build a training set T⊂D;
2. Build a testing set T
0
= D÷T;
3. Run the training phase on T;
4. Apply the learned classifier to each element of T
0
.
Bank Credit Risk Management based on Data Mining Techniques
839

Figure 1: The proposed method.
Each classification was performed using 80% of
the data-set as training data-set and 20% as testing
data-set employing the full feature set exploiting the
kNN, the Random Forest, the Neural Network and the
Naive Bayes classification algorithms.
To evaluate the model exhibiting the best perfor-
mances we consider:
• Lift Curve: Lift is a measure of the performance
of a targeting model at predicting or classifying
cases as having an enhanced response (with re-
spect to the population as a whole), measured
against a random choice targeting model. A tar-
geting model is doing a good job if the response
within the target is much better than the average
for the population as a whole. Lift is simply the
ratio of these values: target response divided by
average response;
• ROC Analysis: A receiver operating characteris-
tic curve, or ROC curve, is a graphical plot that
illustrates the diagnostic ability of a binary classi-
fier system as its discrimination threshold is var-
ied. The ROC curve is created by plotting the true
positive rate (TPR) against the false positive rate
(FPR) at various threshold settings;
• Confusion Matrix: Is a table that allows visual-
ization of the performance of an algorithm. In
this table, each row of the matrix represents the
instances in a predicted class while each column
represents the instances in an actual class (or vice
versa); the name stems from the fact that it makes
it easy to understanding whether the model is con-
fusing two classes (i.e. commonly mislabeling
one as another);
• Calibration Plot: It basically shows the match be-
tween the classifiers’ probability predictions and
actual class probabilities. A calibration plot is a
graph where the conditional distribution of the ob-
servations, given the forecast probability, is plot-
ted against the forecast probability. The distri-
butions for perfectly reliable forecasts are plot-
ted along the 45-degree diagonal. Calibration plot
may also be referred to as reliability diagrams.
3 EXPERIMENTAL ANALYSIS
In the section we present the results of our experiment
to demonstrate the effectiveness of data mining for
estimating the PD in loan repayments.
The experimental analysis is divided into two
phases: he first step is the classification analysis,
where we compute several metrics as indicators about
the effectiveness of the proposed method. In the sec-
ond step we show several plots to compare the pro-
posed models.
To evaluate the proposed method, we consider a
financial data-set freely available for research pur-
poses
1
. In detail the data-set was considered for
the PKDD’99 Discovery Challenge
2
. Moreover, for
the experiments we consider the Orange
3
toolkit, a
1
https://sorry.vse.cz/
∼
berka/challenge/
2
https://sorry.vse.cz/
∼
berka/challenge/PAST/index.html
3
https://orange.biolab.si/
ForSE 2020 - 4th International Workshop on FORmal methods for Security Engineering
840

Python open source software for data mining and data
visualization.
3.1 Classification Analysis
We consider four metrics in order to evaluate the
results of the classification: Precision, Recall, F-
Measure and Accuracy.
The precision has been computed as the propor-
tion of the examples that truly belong to class X
among all those which were assigned to the class. It
is the ratio of the number of relevant records retrieved
to the total number of irrelevant and relevant records
retrieved:
Precision =
t p
t p+ f p
where tp indicates the number of true positives
and fp indicates the number of false positives.
The recall has been computed as the proportion
of examples that were assigned to class X, among all
the examples that truly belong to the class, i.e., how
much part of the class was captured. It is the ratio of
the number of relevant records retrieved to the total
number of relevant records:
Recall =
t p
t p+ f n
where tp indicates the number of true positives
and fn indicates the number of false negatives.
The F-Measure is a measure of a test’s accuracy.
This score can be interpreted as a weighted average
of the precision and recall:
F-Measure = 2 ∗
Precision∗Recall
Precision+Recall
The Accuracy is defined as the ratio of number
of correct predictions to the total number of input
samples:
Accuracy =
t p+tn
t p+tn+ f p+ f n
where tp indicates the number of true positives, tn
indicates the number of true negatives, fp indicates the
number of false negatives and fn indicates the number
of false negatives.
Table 2 shows the results we obtained for the com-
puted metrics.
As shown by results in Table 2 the Random Forest
model is the one obtaining the best performances, in
fact it obtains an accuracy equal to 0.998. The algo-
rithm with the lowest performances is the Naive Bayes
one, with an accuracy equal to 0.760. The kNN and
the Neural Network algorithms respectively reach an
accuracy equal to 0.919 and 0.943.
Table 2: Classification Results.
Algorithm Precision Recall F-measure Accuracy
Random Forest 0.998 0.998 0.998 0.998
kNN 0.916 0.919 0.916 0.919
Neural Network 0.945 0.943 0.945 0.943
Naive Bayes 0.749 0.760 0.754 0.760
Figure 2: Lift curve.
3.2 Models Assessment
In the follow we show the plots related to the lift (in
Figure 2) and roc curve (in Figure 3).
From both the plots represented in Figures 2 and
3 it emerges the confirmation that the classification
algorithm obtaining the best performances is the Ran-
dom Forest one: in fact its trend is the one that differs
most from the diagonal.
In Figure 4 the calibration plot is shown.
We confirm the effectiveness of the Random For-
est algorithm also from the calibration plot analysis,
in fact the Random Forest trend is the one more fo-
cused on the 45-degree diagonal.
With the aim to better understand in detail the per-
formance obtained from the best algorithm, In Figure
Figure 3: Roc curve.
Bank Credit Risk Management based on Data Mining Techniques
841
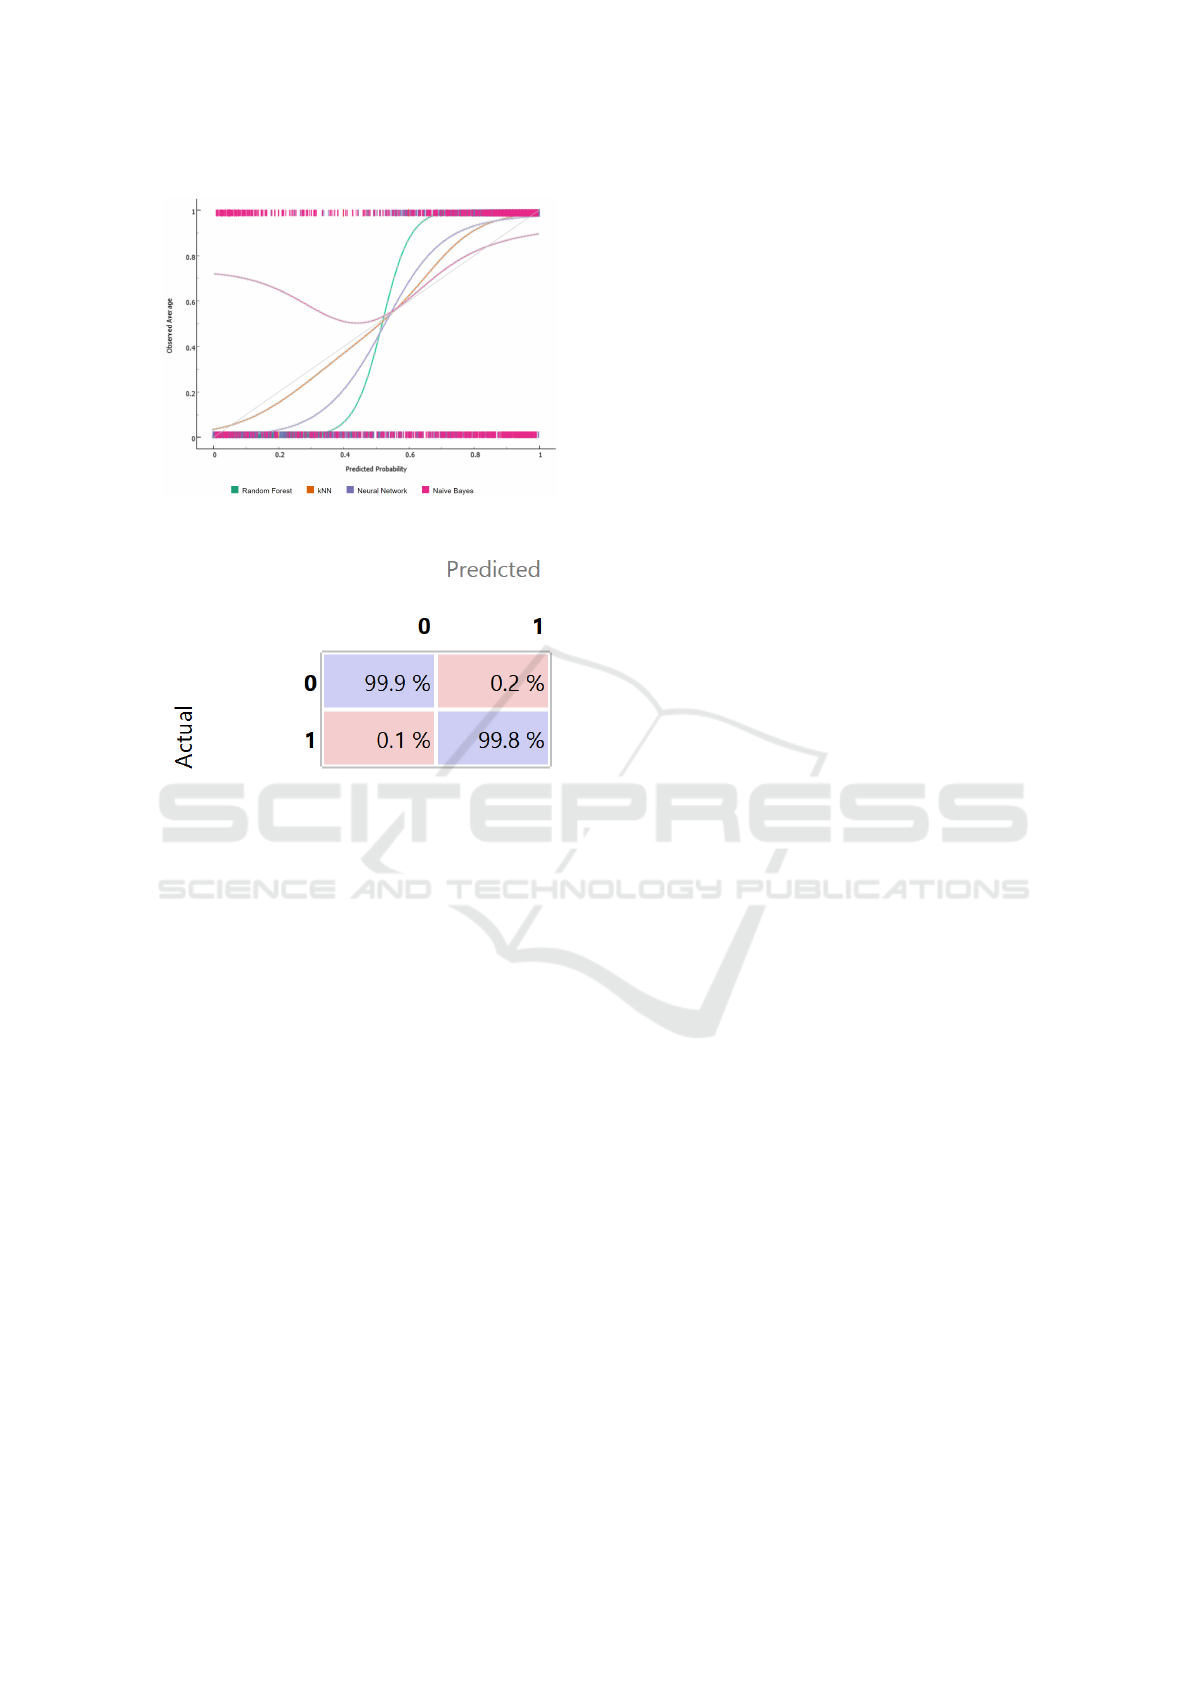
Figure 4: Calibration plot.
Figure 5: Confusion Matrix.
5 we show the confusion matrix related to the Random
Forest model.
The confusion matrix in Figure 5 shows percent-
age of instances correctly classified (in the purple
boxes) and the percentage of instances misclassified
(in the pink boxes): for the defaulted loan applicants
class (i.e. 0) we obtain the 99.9% of instances cor-
rectly detected (while the remaining 0.1% is erro-
neously classified as belonging to the 1 class), while
for the paid loan applicants class (i.e., 1), the proposed
method reaches a percentage equal to 99.8% of in-
stances correctly detected with the 0.2% of instances
misclassified.
These results are symptomatic of the potential of
the techniques analyzed to pursue greater effective-
ness in banking processes of credit risk assessment,
and in particular in estimating the PD on loan repay-
ments.
4 CONCLUSION AND FUTURE
WORK
In this paper a method aimed at estimating the PD
on repayments of bank loans, using data mining tech-
niques, is proposed. In particular, we exploit super-
vised machine learning techniques to infer knowledge
from a set of data related to a financial data-set. We
evaluate four different supervised machine learning
algorithms and we empirically demonstrate that the
model which obtains best predictive performances is
the one built using the Random Forest algorithm.Our
investigation suggests that the banking context, and
in particular the CRM area, can benefit from the ex-
traction of knowledge from the proposed data mining
techniques, by supporting more effective and efficient
credit risk assessment approaches. In fact, as shown
by the results, these techniques can provide more ac-
curate information to the loan decision-making pro-
cess, with significant improvements not only in risk
analysis but also in potential cost savings and in the
time of evaluation of loan applications. As future
work, we plan to apply formal verification techniques
(Francesco et al., 2014; Ceccarelli et al., 2014; Can-
fora et al., 2018; Cimitile et al., 2017b; Santone,
2002; Santone, 2011; Barbuti et al., 2005; Gradara
et al., 2005), to reach better prediction results for es-
timating the PD on loan repayments.
ACKNOWLEDGMENTS
This work has been partially supported by MIUR -
SecureOpenNets and EU SPARTA and CyberSANE
projects.
REFERENCES
Allen, D. and Powell, R. (2011). Credit risk measurement
methodologies.
Altman, E., Resti, A., and Sironi, A. (2004). Default re-
covery rates in credit risk modelling: a review of the
literature and empirical evidence. Economic Notes,
33(2):183–208.
Altman, E. I. (1968). Financial ratios, discriminant anal-
ysis and the prediction of corporate bankruptcy. The
journal of finance, 23(4):589–609.
Angelini, E., di Tollo, G., and Roli, A. (2008). A neural
network approach for credit risk evaluation. The quar-
terly review of economics and finance, 48(4):733–755.
Barbuti, R., De Francesco, N., Santone, A., and Vaglini, G.
(2005). Reduced models for efficient ccs verification.
Formal Methods in System Design, 26(3):319–350.
Bj
¨
orkegren, D. and Grissen, D. (2018). Behavior revealed
in mobile phone usage predicts loan repayment. Avail-
able at SSRN 2611775.
Brunese, L., Mercaldo, F., Reginelli, A., and Santone, A.
(2020). An ensemble learning approach for brain can-
cer detection exploiting radiomic features. Computer
methods and programs in biomedicine, 185:105134.
ForSE 2020 - 4th International Workshop on FORmal methods for Security Engineering
842

Bruno, E., Iacoviello, G., and Lazzini, A. (2015). On the
possible tools for the prevention of non-performing
loans. a case study of an italian bank. Corporate Own-
ership and Control, 5(1):7–19.
Canfora, G., Martinelli, F., Mercaldo, F., Nardone, V., San-
tone, A., and Visaggio, C. A. (2018). Leila: formal
tool for identifying mobile malicious behaviour. IEEE
Transactions on Software Engineering.
Ceccarelli, M., Cerulo, L., and Santone, A. (2014). De
novo reconstruction of gene regulatory networks from
time series data, an approach based on formal meth-
ods. Methods, 69(3):298–305.
Chitra, K. and Subashini, B. (2013). Data mining tech-
niques and its applications in banking sector. Interna-
tional Journal of Emerging Technology and Advanced
Engineering, 3(8):219–226.
Cimitile, A., Martinelli, F., and Mercaldo, F. (2017a). Ma-
chine learning meets ios malware: Identifying mali-
cious applications on apple environment. In ICISSP,
pages 487–492.
Cimitile, A., Martinelli, F., Mercaldo, F., Nardone, V.,
and Santone, A. (2017b). Formal methods meet mo-
bile code obfuscation identification of code reorder-
ing technique. In Enabling Technologies: Infrastruc-
ture for Collaborative Enterprises (WETICE), 2017
IEEE 26th International Conference on, pages 263–
268. IEEE.
EBA (2011). European banking authority,eba guidelines on
internal governance, london. http://webhome.cs.uvic.
ca/
∼
bmkapron/ccs.html.
FBS (2017). Financial stability board , artificial intelligence
and machine learning in financial services. available
at: http://www. fsb. org/2017/11/artificialintelligence-
and-machine-learning-in-financialservice/.
Francesco, N. d., Lettieri, G., Santone, A., and Vaglini, G.
(2014). Grease: a tool for efficient “nonequivalence”
checking. ACM Transactions on Software Engineer-
ing and Methodology (TOSEM), 23(3):24.
Frawley, W. J., Piatetsky-Shapiro, G., and Matheus, C. J.
(1992). Knowledge discovery in databases: An
overview. AI magazine, 13(3):57–57.
Giovannoni, E., Quarchioni, S., and Riccaboni, A. (2016).
The role of roles in risk management change: The
case of an italian bank. European Accounting Review,
25(1):109–129.
Goldstein, I., Jiang, W., and Karolyi, G. A. (2019). To fin-
tech and beyond. The Review of Financial Studies,
32(5):1647–1661.
Gradara, S., Santone, A., and Villani, M. L. (2005). Using
heuristic search for finding deadlocks in concurrent
systems. Information and Computation, 202(2):191–
226.
Jordan, M. I. and Mitchell, T. M. (2015). Machine learn-
ing: Trends, perspectives, and prospects. Science,
349(6245):255–260.
Kruppa, J., Schwarz, A., Arminger, G., and Ziegler, A.
(2013). Consumer credit risk: Individual probabil-
ity estimates using machine learning. Expert Systems
with Applications, 40(13):5125–5131.
Lessmann, S., Baesens, B., Seow, H.-V., and Thomas,
L. C. (2015). Benchmarking state-of-the-art classi-
fication algorithms for credit scoring: An update of
research. European Journal of Operational Research,
247(1):124–136.
Mackinnon, M. J. and Glick, N. (1999). Applications:
Data mining and knowledge discovery in databases–
an overview. Australian & New Zealand Journal of
Statistics, 41(3):255–275.
Maiorca, D., Mercaldo, F., Giacinto, G., Visaggio, C. A.,
and Martinelli, F. (2017). R-packdroid: Api package-
based characterization and detection of mobile ran-
somware. In Proceedings of the Symposium on Ap-
plied Computing, pages 1718–1723. ACM.
Martinelli, F., Marulli, F., and Mercaldo, F. (2017a). Eval-
uating convolutional neural network for effective mo-
bile malware detection. Procedia Computer Science,
112:2372–2381.
Martinelli, F., Mercaldo, F., and Saracino, A. (2017b).
Bridemaid: An hybrid tool for accurate detection of
android malware. In Proceedings of the 2017 ACM on
Asia Conference on Computer and Communications
Security, pages 899–901. ACM.
Mercaldo, F., Nardone, V., and Santone, A. (2017). Dia-
betes mellitus affected patients classification and diag-
nosis through machine learning techniques. Procedia
computer science, 112:2519–2528.
Mercaldo, F., Nardone, V., Santone, A., and Visaggio, C. A.
(2016). Hey malware, i can find you! In Enabling
Technologies: Infrastructure for Collaborative Enter-
prises (WETICE), 2016 IEEE 25th International Con-
ference on, pages 261–262. IEEE.
Mitchell, T. M. (1999). Machine learning and data mining.
Communications of the ACM, 42(11).
Onay, C. and
¨
Ozt
¨
urk, E. (2018). A review of credit scoring
research in the age of big data. Journal of Financial
Regulation and Compliance, 26(3):382–405.
Santone, A. (2002). Automatic verification of concur-
rent systems using a formula-based compositional ap-
proach. Acta Informatica, 38(8):531–564.
Santone, A. (2011). Clone detection through process alge-
bras and java bytecode. In IWSC, pages 73–74. Cite-
seer.
Saunders, A. and Allen, L. (2010). Credit risk management
in and out of the financial crisis: new approaches to
value at risk and other paradigms, volume 528. John
Wiley & Sons.
Tsai, C.-F. and Chen, M.-L. (2010). Credit rating by hybrid
machine learning techniques. Applied soft computing,
10(2):374–380.
Van Gestel, T. and Baesens, B. (2008). Credit Risk Man-
agement: Basic concepts: Financial risk components,
Rating analysis, models, economic and regulatory
capital. OUP Oxford.
Wilson, J. O., Casu, B., Girardone, C., and Molyneux, P.
(2010). Emerging themes in banking: Recent liter-
ature and directions for future research. The British
Accounting Review, 42(3):153–169.
Bank Credit Risk Management based on Data Mining Techniques
843
