
The Comparison of Algorithms for Life-threatening Cardiac
Arrhythmias Recognition
Anatoliy P. Nemirko
a
, Liudmila A. Manilo, Boris E. Alekseev,
Anastasia A. Sokolova
b
and Zafar M. Yuldashev
c
Department of Biomedical Engineering, Saint-Petersburg Electrotechnical University "LETI",
Str. Professora Popova 5, 197376 Saint-Petersburg, Russian Federation
Keywords: Electrocardiogram, Arrhythmia, Spectrum, Classification, Fourier Transform.
Abstract: During the clinical monitoring of the human heart activity the main goal is to detect heart arrhythmias and
capture their precursors as early as possible. And we decided to apply 2 seconds gliding window for life-
threatening cardiac arrhythmias recognition. All types of arrhythmias were grouped into six classes depending
on their danger to the human life. And these classes were separated in two parts: threatening humans’ life and
others. As a classification features Fourier transform with spectrum up to 15 Hz were picked. In this paper we
describe the formed dataset of ECG fragments and compare efficiency of different simple classification
algorithms for this two-class problem. The following algorithms were tested: k-nearest neighbours, nearest
convex hull algorithm, nearest mean and SVMs with different kernels. The results appeared to be sufficiently
appropriate.
1 INTRODUCTION
Perspective intelligent outpatient monitoring systems
aim not only at long-term electrocardiogram
monitoring by also providing doctors and patients
with alarms based on the results of its online analysis.
Prominent applications of such systems include
detection of various life-threatening disorders such as
severe arrhythmia and/or ischaemia events as well as
signatures of such conditions as stroke and cardiac
arrest. Such as ventricular fibrillation (flutter) and
tachycardia in 40% of cases lead to cardiac arrest
(Wik et al., 2003). Electric defibrillation is only
effective therapy for these disorders. For the
successful implementation of life-threatening cardiac
arrhythmias recognition algorithms and their online
performance, the keynote requirements include
reliability and detection time (Moraes et al., 2002;
Meng et al., 2016). A large number of algorithms
have already been developed and tested using various
classifiers and features to solve this problem. In (Xu
et al., 2018), authors have made a review and
a
https://orcid.org/0000-0001-6459-626X
b
https://orcid.org/0000-0002-8380-4850
c
https://orcid.org/0000-0003-1075-3420
comparison of these algorithms and methods
proposed in the last decades.
Different features of life-threatening cardiac
arrhythmias (Cheng and Dong, 2017) were proposed
for the algorithms of their detection: morphology
analysis (Arafat et al., 2011; Amann et al., 2006;
Monte et al., 2011), spectral analysis (Barro et al.,
1989; Dzwonczyk et al., 1990), time-frequency
analysis (Millet-Roig et al., 1999), complexity
measure (Zhang et al., 1999; Roopaei et al., 2010),
wavelet analysis (Rasooli et al., 2015; Balasundaram
et al., 2013; Li et al., 2011), empirical mode
decomposition (EMD) (Arafat et al., 2009; Anas et
al., 2011; Kaur and Singh, 2013), sequential detection
methods (Anas et al., 2010; Thakor et al., 1990),
machine learning (Verma and Dong, 2016). However,
the authors used different databases and datasets for
their methods testing. In (Amann et al., 2005) the
majority of these methods were tested under the same
conditions by using open published annotated
databases, and it was shown that they could not
achieve the proclaimed performance.
402
Nemirko, A., Manilo, L., Alekseev, B., Sokolova, A. and Yuldashev, Z.
The Comparison of Algor ithms for Life-threatening Cardiac Arrhythmias Recognition.
DOI: 10.5220/0009374904020407
In Proceedings of the 13th International Joint Conference on Biomedical Engineering Systems and Technologies (BIOSTEC 2020) - Volume 1: BIODEVICES, pages 402-407
ISBN: 978-989-758-398-8; ISSN: 2184-4305
Copyright
c
2022 by SCITEPRESS – Science and Technology Publications, Lda. All rights reserved
The current standard for clinical monitoring
systems is to determine the onset of ventricular
fibrillation in 5 seconds after the episode starting
.
However, when it comes to such a dangerous heart
conditions, every second saved can have a huge
impact on a patient's health and life.
Based on these statements, the following task was
set: to reduce the detection time of the classification
algorithm of dangerous arrhythmias and,
additionally, to try to determine the occurrence of
non-dangerous violations that are highly likely to
evolve into dangerous ones. They are related to
precursors.
2 DATABASE AND
PPEPROCESSING
We used «The MIT-BIH Malignant Ventricular
Ectopy Database» (Goldberger et al., 2000). It
contains 22 two-channel annotated ECG recordings
each of about 30 minutes duration, with a sampling
frequency of 360 Hz. The recordings obtained from
the patients who experienced various types of heart
disorders: ventricular ectopic beats (bigeminy,
trigeminy, couples and groups), atrial tachycardia,
atrial fibrillation, pirouette tachycardia, ventricular
tachycardia, ventricular flutter and ventricular
fibrillation. For each of the signals, a set of
annotations was manually verified according to time
points of heart rhythm changing.
The recordings of this database were used as the
initial data for the formation set of two-second
segments in our own database. The process of this
database creation is described below.
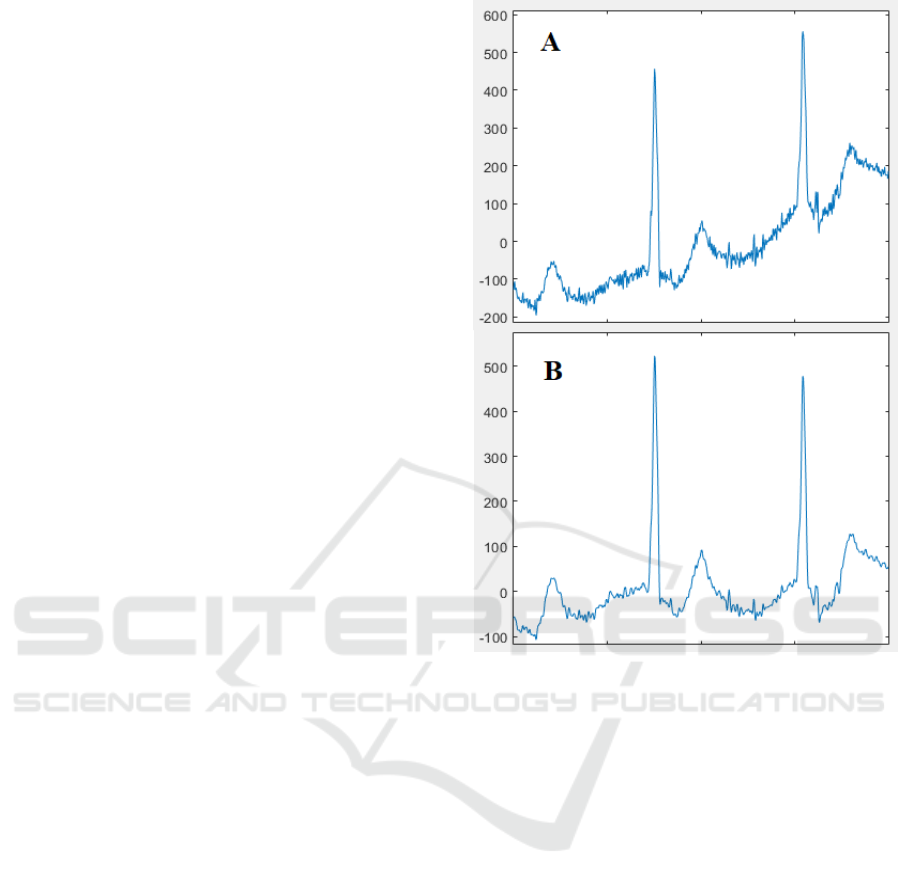
The signals represented in the original database
are obtained using professional electrocardiographs
and are almost free of power grid noise or high-
frequency noises. However, there is still a noticeable
baseline drift corrupting some parts of the signal
(fig. 1 A).
Before creating our database of two-second
fragments, the initial signals were processed using a
median filter with a window of 1.3 seconds, which
has removed the baseline drift. Remnants of electrical
network interference and high-frequency noise (such
as a myographic noise) with a frequency more than
50 Hz were removed using a high-order digital low-
pass filter with a cutoff frequency of 45 Hz. Figure 1
shows a fragment of ECG recording, which contains
the baseline drift and high-frequency interference (A)
and after their reductions (B).
Figure 1: ECG fragment before preprocessing (A) and
after (B).
3 NOVEL CLASSIFIER DATASET
ACCORDING TO
ARRHYTHMIA SEVERETY
The separation of ECG fragments into 6 classes was
proposed. The base for novel classifier set was their
potential danger to the life and health of the patient.
Classes are listening according to the descending
order of the danger:
• Class 1: ventricular flutter and ventricular
fibrillation.
• Class 2: pirouette tachycardia.
• Class 3: ventricular tachycardia.
• Class 4: bigeminy, high degree of ventricular
ectopic activity, ventricular rhythm.
• Class 5: atrial fibrillation, supraventricular
disorders, nodular rhythm.
• Class 6: normal rhythm, single extrasystoles.
The Comparison of Algorithms for Life-threatening Cardiac Arrhythmias Recognition
403
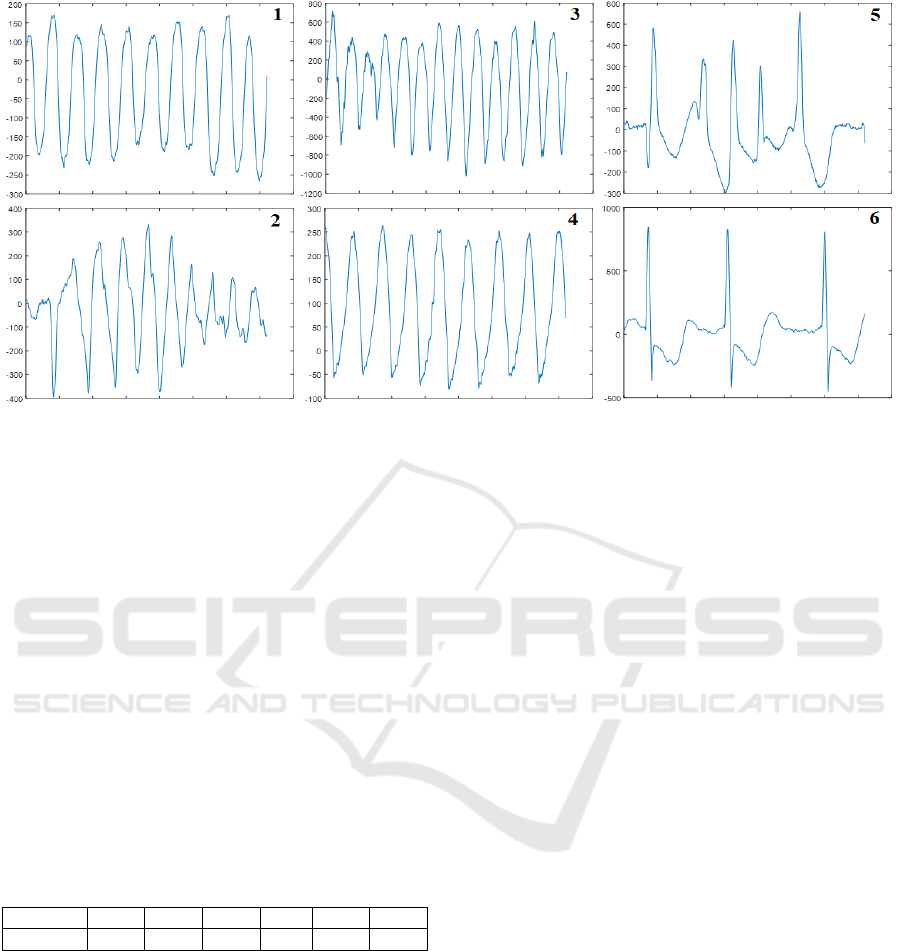
Figure 2: Examples of the representatives of each class.
Figure 2 shows typical ECG fragments for
representation of each class.
The aim of this research was the detection of life-
threatening arrhythmias in a much shorter time than
common practices.
We used 2 seconds window to analyze ECG
fragments for arrhythmias recognition. This window
time duration allows investigating at least two QRS
and RR interval between them for classes 4 and 6, and
several waves for classes 1-3 and 5.
During the creation of new sets of two-second
fragments from the original signals, 1000 fragments
were cut, so that in each of the six previously
designated classes there were at least 90 objects.
The table 1 presents number of two-second
nonoverlapping fragments from the MIT-BIH
database for each class.
Table 1: Number of analysed fragments.
Class 1 2 3 4 5 6
Quantit
y
220 113 183 90 133 261
Then we have consolidated above certain classes
in two groups: life-threatening arrhythmias (Classes
1-3) and their precursors (Classes 4-6).
Thus, the testing of all considered algorithms was
carried out on a two-class recognition – "life-
threatening violations" and "others".
To truthfully check the quality of classification
algorithms tested further, it was necessary to ensure
an equal number of objects of each class in the
training and test data sets. Thus, 90 fragments of six
classes were included in the set, forming 2 enlarged
groups of 270 objects.
The Fourier transform of the fragments was used
as the features supplied to the classifiers. It was
picked as a widely spread characteristics with high
interpretability. Since the duration of the studied
fragments is 2 seconds, the frequency step of the
spectrum is 0.5 Hz.
At the initial stage of the work it was planned to
use the union of harmonics in pairs to obtain a
reduced spectrum with a step of 1 Hz, but the first
results showed a significant decline in the accuracy of
the algorithms when combining harmonics and as a
result, 30 harmonics (up to 15 Hz) seemed to be the
best in terms of information amount/computing
difficulty ratio. Thus, they were used in the
experiments.
4 APPLIMENTATION
DIFFERENT ALGORITHMS TO
ARRHYTHMIAS
RECOGNITION AND RESULTS
4.1 Algorithms
Four classification algorithms were investigated in
the study.
The K nearest neighbour classifier (kNN) is based
on determining the most common class among the k
nearest known objects to the one being classified.
Testing different k’s revealed k = 6 to be the best
option.
NDNSNT 2020 - Special Session on Non-invasive Diagnosis and Neuro-stimulation in Neurorehabilitation Tasks
404
Light nearest convex hull classifier (LNCH)
represents classes in the form of convex hulls. The
classification algorithm determines the position of the
new object relative to these shells (Nalbantov and
Smirnov, 2010; Nemirko, 2019). This method
requires the biggest amount of computing among all
tested ones, since it requires the calculation of a large
number of projections of objects in n-dimensional
space for each classified object.
As for the nearest mean method, the decision on
whether an object belongs to a class is made on the
basis of the euclidean distances from the object to the
centres of the classes – their generalized objects.
Finally, the well-known method of support
vectors with several variants of kernels was used in
the study. Tested kernels are: linear, quadratic, cubic
and Gaussian one.
4.2 Results and Discussion
To avoid overfitting of some algorithms, cross-
validation was used during all tests.
Standard metrics of sensitivity (Se), specificity
(Sp) and overall accuracy (OA) were used to
determine the efficiency of the algorithms.
To test whether preprocessing has any impact on
accuracy, additional tests using not-preprocessed data
were conducted. The results are shown in the table 2.
The best results are marked bold.
Table 2: Quality metrics of investigated algorithms applied
to data without preprocessing.
Al
g
orithm Se S
p
OA
kNN, k = 6 91,1% 96,7% 93,3%
LNCH 86,7% 91,1% 88,9%
Nearest mean 78,9% 93,3% 86,1%
Linear SVM 91,5% 94,4% 93,0%
Quadratic SVM 95,9% 93,7% 94,8%
Cubic SVM 95,9% 93,7% 94,8%
Gaussian SVM 94,8% 94,4% 94,6%
Based on the obtained kNN results, we can
conclude the unequal dispersion of objects within the
studied classes: the low sensitivity of the algorithm is
explained by the presence of a large number of
outliers in the class of "life-threatening arrhythmias".
For the same reason the light nearest convex hull
classifier shows poor results, as its’s data quality
requirements are the biggest.
Accuracy of the same algorithms after signal
preprocessing are shown in the table 3.
It is interesting how the overall accuracy
decreased after removing the zero drift from the
signals. This is probably due to the much greater
Table 3: Quality metrics of investigated algorithms applied
to data after preprocessing.
Algorithm Se Sp OA
kNN, k = 6 89,6% 95,9% 92,8%
LNCH 85,6% 90,0% 88,8%
Nearest mean 78,5% 93,7% 86,1%
Linear SVM 91,1% 91,9% 91,5%
Quadratic
SVM
95,6% 93,3% 94,4%
Cubic SVM 95,9% 93,7% 94,8%
Gaussian SVM 94,1% 94,4% 94,3%
prevalence of zero drift precisely during occurrences
of life-threatening arrhythmias.
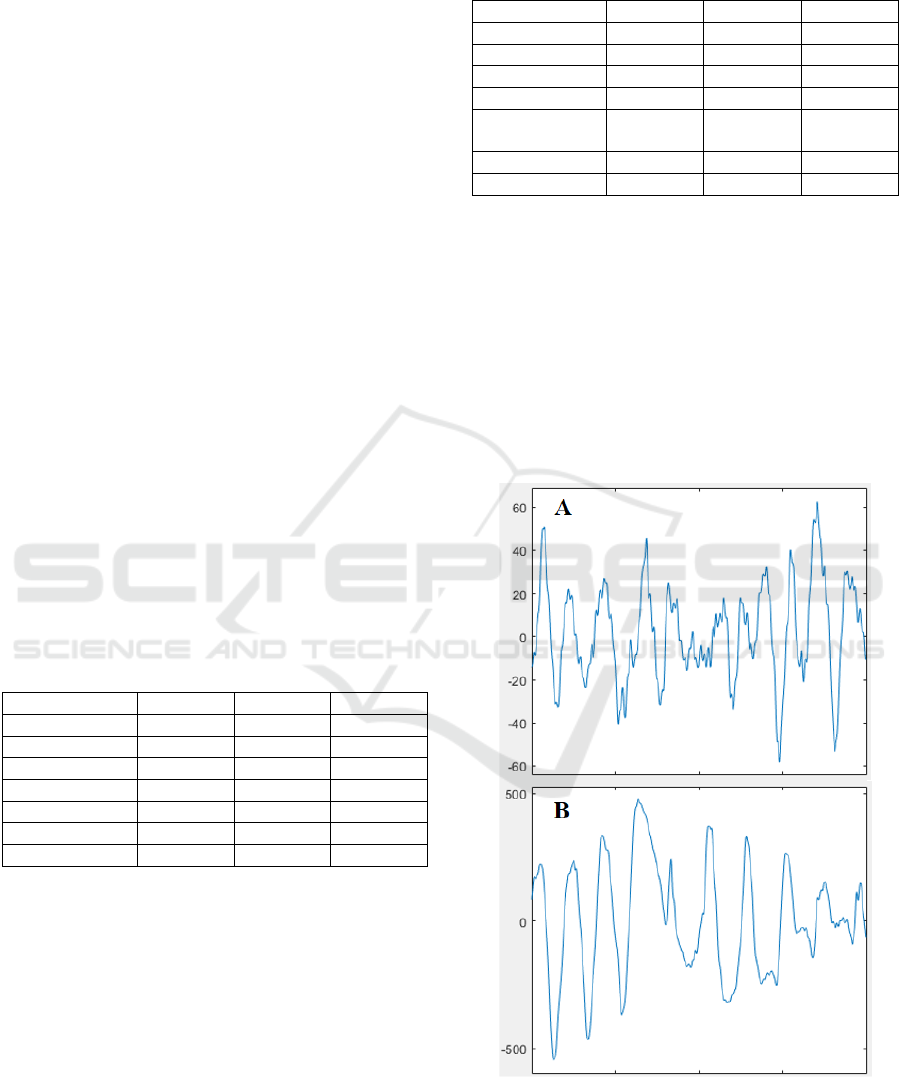
After reviewing the objects that gave an error on
most algorithms, 2 similar cases were identified that
could not be correctly classified in the frequency
domain. Examples of such fragments are shown in
figure 3.
The first error source is significantly irregular
ventricular fibrillation, giving a blurred spectrum
similar to that of a normal ECG (figure 3A). The
second case is transitions within the analysed
Figure 3: The examples of most common error sources:
significantly irregular ventricular fibrillation (A) and
transitions between different rhythm types (B).
The Comparison of Algorithms for Life-threatening Cardiac Arrhythmias Recognition
405

segment. This situation is typical for episodes of the
pirouette form of ventricular tachycardia, appearing
for a very short period of time before the start of
ventricular tachycardia itself (figure 3B). Both of
these cases do not give a significant peak in their
Fourier transform, which is typical for "pure" life-
threatening arrhythmias.
To improve the quality of the features, describing
such aperiodic signals, the use of Wavelet transform
or high-order statistics can be a good choice.
5 CONCLUSIONS
The novel classifier dataset of two-second fragments
of electrocardiograms containing all of the most
common rhythm disorders has been created. The
fragments were grouped into 6 classes according to
the degree of their danger to human life.
Transition to two-class problem of separation of
life-threatening arrhythmias from background rhythm
and low-risk violations was made.
The resulting two-class problem was solved using
kNN, LNCH, nearest mean and SVM with different
kernels methods. As a result of the classification
quality assessment, the low sensitivity of non-SVM
methods was revealed.
After reviewing the objects that gave errors
regardless of the algorithm used, 2 types of fragments
were identified, which classification in the frequency
domain seems difficult.
ACKNOWLEDGEMENTS
This research was supported by Russian Foundation
for Basic Research (RFBR), research projects
19-29-01009 and 18-29-02036.
REFERENCES
Wik, L., Hansen, T. B., Fylling, F., Steen, T., Vaagenes, P.,
Auestad, B. H., & Steen, P. A., 2003. Delaying
defibrillation to give basic cardiopulmonary
resuscitation to patients with out-of-hospital ventricular
fibrillation: a randomized trial. Jama, 289(11): 1389-
1395.
Moraes, J. C. T. D. B., Blechner, M., Vilani, F. N., & Costa,
E. V., 2002. Ventricular fibrillation detection using a
leakage/complexity measure method. In Computers in
Cardiology, IEEE, pages 213-216.
Meng, O., Xia, D. E. L. I. N. G., Zhang, Q. I. A. N. G., &
Zhang, Z. A. I. G. U. O., 2016. Detection Ventricular
Tachycardia and Fibrillation using the Lempel-Ziv
complexity and Wavelet transform. WSEAS Trans.
Inform. Science and App, 13: 118-125.
Xu, Y., Wang, D., Zhang, W., Ping, P., & Feng, L., 2018.
Detection of ventricular tachycardia and fibrillation
using adaptive variational mode decomposition and
boosted-CART classifier. Biomedical Signal
Processing and Control, 39: 219-229.
Cheng, P., & Dong, X., 2017. Life-threatening ventricular
arrhythmia detection with personalized features. IEEE
access, 5: 14195-14203.
Arafat, M. A., Chowdhury, A. W., & Hasan, M. K., 2011.
A simple time domain algorithm for the detection of
ventricular fibrillation in electrocardiogram. Signal,
Image and Video Processing, 5(1): 1-10.
Amann, A., Tratnig, R., & Unterkofler, K., 2006. Detecting
ventricular fibrillation by time-delay methods. IEEE
Transactions on Biomedical Engineering, 54(1): 174-
177.
Monte, G. E., Scarone, N. C., & Liscovsky, P. O., 2011. A
novel time-domain signal processing algorithm for real
time ventricular fibrillation detection. In Journal of
Physics: Conference Series, (Vol. 332, No. 1,
p. 012015). IOP Publishing.
Barro, S., Ruiz, R., Cabello, D., & Mira, J., 1989.
Algorithmic sequential decision-making in the
frequency domain for life threatening ventricular
arrhythmias and imitative artefacts: a diagnostic
system. Journal of biomedical engineering, 11(4): 320-
328.
Dzwonczyk, R., Brown, C. G., & Werman, H. A., 1990.
The median frequency of the ECG during ventricular
fibrillation: its use in an algorithm for estimating the
duration of cardiac arrest. IEEE Transactions on
Biomedical Engineering, 37(6): 640-646.
Millet-Roig, J., Rieta-Ibanez, J. J., Vilanova, E., Mocholi,
A., & Chorro, F. J., 1999. Time-frequency analysis of a
single ECG: to discriminate between ventricular
tachycardia and ventricular fibrillation. In Computers in
Cardiology 1999, Vol. 26 (Cat. No. 99CH37004): 711-
714. IEEE.
Zhang, X. S., Zhu, Y. S., Thakor, N. V., & Wang, Z. Z.,
1999. Detecting ventricular tachycardia and fibrillation
by complexity measure. IEEE Transactions on
biomedical engineering, 46(5): 548-555.
Roopaei, M., Boostani, R., Sarvestani, R. R., Taghavi, M.
A., & Azimifar, Z., 2010. Chaotic based reconstructed
phase space features for detecting ventricular
fibrillation. Biomedical Signal Processing and Control,
5(4): 318-327.
Rasooli, M., Foomany, F. H., Balasundaram, K., Masse, S.,
Zamiri, N., Ramadeen, A., & Beheshti, S., 2015.
Analysis of electrocardiogram pre-shock waveforms
during ventricular fibrillation. Biomedical Signal
Processing and Control, 21: 26-33.
Balasundaram, K., Masse, S., Nair, K., & Umapathy, K.,
2013. A classification scheme for ventricular
arrhythmias using wavelets analysis. Medical &
biological engineering & computing, 51(1-2): 153-164.
NDNSNT 2020 - Special Session on Non-invasive Diagnosis and Neuro-stimulation in Neurorehabilitation Tasks
406

Li, Y., Bisera, J., Weil, M. H., & Tang, W., 2011. An
algorithm used for ventricular fibrillation detection
without interrupting chest compression. IEEE
Transactions on Biomedical Engineering, 59(1): 78-86.
Arafat, M. A., Sieed, J., & Hasan, M. K., 2009. Detection
of ventricular fibrillation using empirical mode
decomposition and Bayes decision theory. Computers
in Biology and Medicine, 39(11): 1051-1057.
Anas, E. M. A., Lee, S. Y., & Hasan, M. K., 2011.
Exploiting correlation of ECG with certain EMD
functions for discrimination of ventricular fibrillation.
Computers in biology and medicine, 41(2): 110-114.
Kaur, L., Singh, V., 2013. Ventricular fibrillation detection
using empirical mode decomposition and approximate
entropy. Intern. Journal of Emerging Technology and
Advanced Engineering, 3 (5): 260-268.
Anas, E. M. A., Lee, S. Y., & Hasan, M. K., 2010.
Sequential algorithm for life threatening cardiac
pathologies detection based on mean signal strength
and EMD functions. Biomedical engineering online,
9(1): 43.
Thakor, N. V., Zhu, Y. S., & Pan, K. Y., 1990. Ventricular
tachycardia and fibrillation detection by a sequential
hypothesis testing algorithm. IEEE Transactions on
Biomedical Engineering, 37(9): 837-843.
Verma, A., & Dong, X., 2016. Detection of ventricular
fibrillation using random forest classifier. Journal of
Biomedical Science and Engineering, 9(05): 259.
Amann, A., Tratnig, R., & Unterkofler, K., 2005.
Reliability of old and new ventricular fibrillation
detection algorithms for automated external
defibrillators. Biomedical engineering online, 4(1): 60.
Goldberger, A. L., Amaral, L. A., Glass, L., Hausdorff, J.
M., Ivanov, P. C., Mark, R. G., & Stanley, H. E., 2000.
PhysioBank, PhysioToolkit, and PhysioNet:
components of a new research resource for complex
physiologic signals. Circulation, 101(23): e215-e220.
Nalbantov, G., & Smirnov, E., 2010. Soft nearest convex
hull classifier. In Proceedings of the 2010 conference
on ECAI 2010: 19th European Conference on Artificial
Intelligence, pages 841-846. IOS Press.
Nemirko, A. P., 2019. Lightweight Nearest Convex Hull
Classifier. Pattern Recognition and Image Analysis,
29(3): 360-365.
The Comparison of Algorithms for Life-threatening Cardiac Arrhythmias Recognition
407
