
A Reference Process Model for Machine Learning Aided Production
Quality Management
Alexander Gerling
1,2,3
, Ulf Schreier
1
, Andreas Hess
1
, Alaa Saleh
1,2,3
, Holger Ziekow
1
and Djaffar Ould Abdeslam
2,3
1
Business Information Systems, Furtwangen University of Applied Science, 78120 Furtwangen, Germany
2
IRIMAS Laboratory, Université de Haute-Alsace, 68100 Mulhouse, France
3
Université de Straßbourg, France
{alexander.gerling, alaa.saleh, djaffar.ould-abdeslam}@uha.fr
Keywords: Reference Model, Machine Learning, Assembly Line, Manufacturing, Requirements.
Abstract: The importance of machine learning (ML) methods has been increasing in recent years. This is also the reason
why ML processes in production are becoming more and more widespread. Our objective is to develop a ML
aided approach supporting production quality. To get an overview, we describe the manufacturing domain
and use a visualization to explain the typical structure of a production line. Within this section we illustrate
and explain the as-is process to eliminate an error in the production line. Afterwards, we describe a careful
analysis of requirements and challenges for a ML system in this context. A basic idea of the system is the
definition of product testing meta data and the exploitation of this knowledge inside the ML system. Also, we
define a to-be process with ML system assistance for checking production errors. For this purpose, we
describe the associated actors and tasks as well.
1 INTRODUCTION
Machine learning (ML) systems have already
successfully been used to predict outcomes in
production (Hirsch et al., 2019; Wang et al., 2018;
Wu et al., 2017). In 2035, ML is going to have the
biggest impact for manufacturing (Mehta and Hamke,
2019). Currently, only 12 percent of companies
operating in the sector of manufacturing use ML for
their production (Stübinger, 2019). Numerous use
cases for various aims are possible. One promising
area is the evaluation of test data from quality
management in production. It is a widespread best
practice for companies to test the results of
production steps, record these data and evaluate them.
When products are getting complex, many features of
parts are tested quite early in the production process.
Additional, information about the production status is
tracked, which represent if a test could be
successfully passed. However, due to the inherent
complexity of the manufacturing process, it is a
challenge to determine the relation between
intermediate measurements and the resulting product
quality. It is the task of quality management and
engineering to find suitable thresholds for evaluating
test data and to balance between too restrictive and
too permissive test models. ML has a high potential
to support these activities in order to detect errors as
early as possible. PREFERML (Proactive Error
Avoidance in Production through Machine Learning)
(Ziekow et al., 2019) is a project that investigates
challenges and holistic system solutions in this
context. Such an integrated ML and quality system
changes the roles of quality engineers and data
scientists. The objective is to minimize the need of a
data scientist or a machine learning expert who
provides individual script solutions for products. A
quality engineer should be able to overtake most of
the tasks of a data scientist and work effortless with
the ML system. The ML system should be reusable
for all products and simple to handle for non-experts.
In this paper, we present a reference model for a
corresponding solution. The developed reference
model is based on an industrial case study, which we
use to validate our general requirements. Moreover,
we focus on these requirements and their successful
use towards an effective implementation of an ML
system. These requirements were captured during
multiple requirements workshops with domain
experts from the manufacturer SICK AG (SICK AG,
Gerling, A., Schreier, U., Hess, A., Saleh, A., Ziekow, H. and Abdeslam, D.
A Reference Process Model for Machine Learning Aided Production Quality Management.
DOI: 10.5220/0009379705150523
In Proceedings of the 22nd International Conference on Enterprise Information Systems (ICEIS 2020) - Volume 1, pages 515-523
ISBN: 978-989-758-423-7
Copyright
c
2020 by SCITEPRESS – Science and Technology Publications, Lda. All rights reserved
515
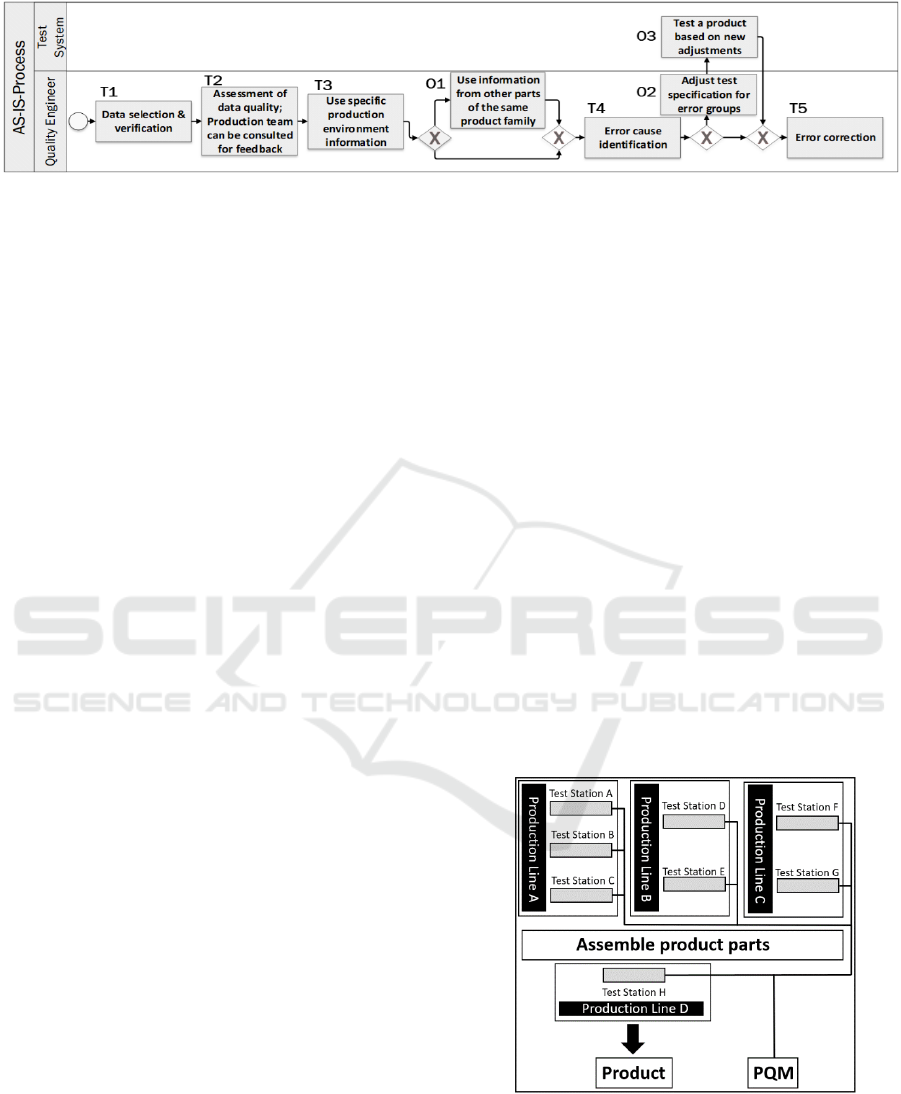
Figure 1: As-is process.
2019). The experts represented the roles of product
owner and developer of the existing quality
management system, data scientist and quality
engineer. On the other side, the current knowledge
about machine learning influences the requirements
as well. In addition to the above-mentioned points, we
illustrate the as-is process of a quality engineer who
resolves detected errors in the production line.
Building on the as-is process we introduce a to-be
process, which illustrates the adjusted procedure in
combination with several actors and ML support.
The paper is organized as follows: Section 2
describes the production environment. In section 3 we
provide an overview of similar projects or
applications in production. Section 4 summarize our
recorded general requirements. Section 5 is dedicated
for the extended tasks of the actors. In section 6 we
describe our developed to-be process. In section 7 we
validate our general requirements and name the
benefits of the to-be process. Section 8 is a summary
of our work and concludes this paper.
2 DOMAIN DESCRIPTION
In this section, we describe the manufacturing domain
and shed light on challenges, especially for the
production line.
In Figure 1 we explain the standard procedure,
how a quality engineer investigates a defect or cause
of error. As can be seen in Figure 1, the error
investigation can be done on a high level or can be
further split in little steps to specify the detailed
diagnosis. In this procedure, the quality engineer is
the main actor and is supported by the test system.
First, the quality engineer must get the data of the
specific product from a data source and verify that the
data is in fact about the correct product (T1). In the
next step, the data must be rated for the quality and
characteristics. To gain more knowledge about the
product, the production team can be consulted for
individual questions (T2). One point that should not
be ignored is the production environment. The test
results can be influenced for example by the
temperature of the production facility. Another point
could be the time of the day, which correlates
indirectly to interesting features (e.g. the sunshine
angle in the production environment) (T3). As an
optional step, a quality engineer can use related
product information. If the product belongs to a
product family, there is a chance to find related
problems or even better, the error solutions (O1).
Therefore, the insight of the potential error solution
should be also considered in T4. Next, the quality
engineer has to identify the error cause. Mathematical
tools with classical statistical functions are used in
this step to find general relationships or correlations
(T4). Optionally, the test specifications for the
specific error group can be adjusted to improve the
search for the cause of error (O2). The test system
tests a product with the adjusted settings to verify
their correctness (O3). In the last step, part design or
production processes are improved. In this regard the
quality engineer cooperates with industrial engineers
and design engineers (these classical business
processes beyond ML and QM are not included in
Figure 1) (T5).
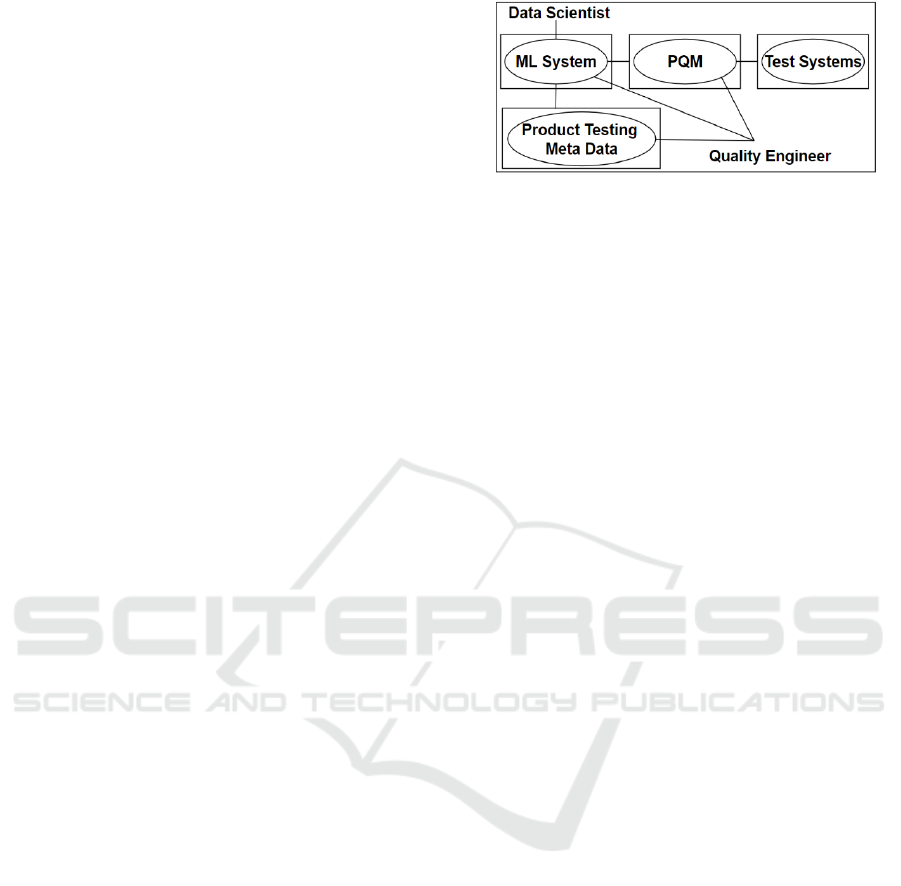
Figure 2: Production Line.
Figure 2 illustrates a typical production line in
manufacturing. There are multiple test stations over
multiple production lines to control the measurements
of the product. These are connected to a Product
ICEIS 2020 - 22nd International Conference on Enterprise Information Systems
516

Quality Management (PQM) to ensure the quality of
the products. The PQM is the central point to store the
measurements of all products in the production. The
product is built up step by step in the production line.
Dependent on the product design, the production can
comprise assembly of multiple parts and or
modification of parts. Every test station checks, if the
measurements of the product are good enough to
continue. In some cases, it is possible that a product
can pass a sub-test but fail in the final test. Normally,
the defective product part will be taken out from the
production line and get repaired in a separate station.
In the worst case, the built product is identified as a
failure and must be discarded. In any case, to reduce
corrupted parts in the product, we must set focus on
recognising errors more precisely. Understanding the
manufacturing environment is crucial to any ML
approach. There are various manufacturing process
variables to consider, like the number of the
production lines, or the nature and number of steps in
one line. A product can have various types and
versions as well as different number of components
and building steps (Hu et al., 2008). We should take
into consideration that not all production steps are
automated and the human influence of workers in
production facilities. The manual production steps
can notably impact the final product. In our scenario,
we have multiple production lines in which multiple
product types of a product family are built in various
versions. If the system recognizes a measuring error,
the product gets checked separately and repaired, if
needed. The repaired product is inserted into a
previous production step and for the sake of
correctness, the repaired product is tested again.
For our case study we are working together with
the company SICK AG, which is a manufacturer of
intelligent sensors and sensor solutions for factories,
logistics and process automation. State of the art
assembly lines are used by SICK AG to produce
various products
3 RELATED WORK
In this section we discuss other ML approaches and
how our developed requirements complement and/or
differentiate them.
One of the earliest papers (Monostori et al., 1996)
provides us with a broad overview of ML techniques.
Learning approaches get rated based on
manufacturing requirements and a list of application
domains get provided. Furthermore, applications in
manufacturing are grouped by these application
domains and the ML approaches for these are
described. We give a general description of the
necessary requirements for an ML assisted approach
on a real industrial use case.
(Wang et al., 2018) describe methods and
applications for smart manufacturing. They mention
deep learning methods and shows, where deep
learning can be used. It sheds a light on the area of
diagnostic analytics for fault assessment or predictive
analytics for defect prognosis; In both areas ML
methods and use cases are mentioned. At the end, it
starts a discussion and gives an outlook of model
selection, generic model, model visualization and
data. In this paper, no requirements are described to
implement an ML system for production; here we can
fill this gap with our paper.
(Wu et al., 2017) show the results of an ML
algorithm comparison in a smart manufacturing
environment and gives a detailed experimental setup.
In this paper, we find a lack of information about the
necessary requirements to implement a ML system
and it describes only an experiment.
Advantages, challenges and applications of ML
for the use in manufacturing can be found in (Wuest
et al., 2018). It also gives an overview of the key
challenges in the field of manufacturing. Here we get
a detailed list of manufacturing requirements, based
on the use of ML methods. To be more precise, the
abilities of a ML algorithm are described and not the
requirements to implement a ML system. In our
paper, we mention the general requirements to
implement a ML aided approach. Furthermore, we
include the to-be process to improve the error
detection in the production.
(Stanisavljevic and Spitzer, 2016) give us a broad
overview of some published papers on machine
learning in manufacturing. Further, use cases like
(Wu and Ni, 2011) for machine learning especially
for automated assembly lines are mentioned. The
most interesting part of this paper is that the author
describes requirements, which have to be fulfilled in
order to be applicable in manufacturing. The authors
reference (Pham and Afify, 2005) and describe the
following: 1) Handling different types of data
(numerical, textual, images etc.). 2) Dealing with
noise and outliers in data. 3) Real-time processing. 4)
Dealing with huge datasets and/or high dimensional
datasets. In our use case, it is not crucial to provide a
real-time processing. We set our focus on more
general requirements.
A specific use case for machine learning can be
addressed for the area of semiconductor
manufacturing. (Susto et al., 2012) show four detailed
main challenges, which are partly described and
originally from (Susto and Beghi, 2013). The
A Reference Process Model for Machine Learning Aided Production Quality Management
517
mentioned challenges can be successfully solved, by
using our recommended reference process model or
by using the Product Testing Meta Model (PTMD)
like shown in Figure 4. For example, (Susto et al.,
2012) address high dimensionality data. We can solve
this problem with our to-be process from section 6. In
the recommended to-be process we automatically
reduce unnecessary high dimensionality data and
provides only suitable data to train a ML model.
The plan-do-check-act (PDCA) cycle is a
continuous improvement process and contains four
phases: Plan, Do, Check and Act (Johnson, 2002).
The four phases can lead to new opportunities and
potentials, which can be tested, implemented,
controlled and discovered. This process is a potential
way to improve the quality of a product and is well
suited for quality managers. We accompany with our
to-be process (illustrated in Figure 5) the product only
within its life cycle (Levitt, 2014). Also, we do not
provide a plan phase in our approach or separate our
requirements in phases. Furthermore, we describe the
general requirements that must be considered for an
implementation. This could be a parallel to the do
phase. Additionally, we extend our process with the
help of ML and a specific actor.
An overview of the life cycle of a data mining
project is illustrated by the Cross Industry Standard
Process for Data Mining (CRISP-DM). The CRISP-
DM visualized the phases of a project with their
specific tasks. Further it shows the connection
between these tasks (Chapman, 2000). The six phases
of a CRISP-DM are: Business Understanding, Data
Understanding, Data Preparation, Modelling,
Evaluation, Deployment. The listed requirements
from section 4 include all the phases of the CRISP-
DM and are phase-overlapping tasks towards an
implementation. In particular, we use the phases of
Business Understanding and Data Understanding.
Further, we want to provide a generic
implementation.
Finally, it can be said that - while machine
learning is used in different areas of production - there
are hardly any recorded requirements for it. With this
paper, we can close an identified gap and provide
important prerequisites that are necessary for a
successful implementation of a ML aided system.
Also, we integrate the ML part and an additional actor
to the as-is process (Figure 1). With these new
components we created the to-be process (Figure 5).
Furthermore, it can be said that we form an interface
between the two processes CRISP-DM and PDCA-
Cycle and take a new direction with our approach.
Figure 3: Use Case Environment.
4 GENERAL REQUIREMENTS
OF THE ML SYSTEM
This section sheds light on general requirements for
the ML system and explains the relationships to the
environment, as can be seen in Figure 3. In this figure
we show all systems and use cases in one summarized
illustration. The oval circle represents all use cases
within the rectangle, which represent the system. The
lines indicate the persons or software involved in the
use cases. The Test Systems forward their test results
to the PQM and the PQM to the ML system. The meta
data about product testing (PTMD) is a repository that
directs the work of the ML System. PTMD contains
information about products, production lines, testing,
error types etc. Figure 4 is a simplified illustration of
the PTMD and is described later in more detail.
Moreover, human actors interact with the systems as
data scientists and as quality engineers. The data
scientist is responsible to control the ML system. The
quality engineer uses the ML system for the analyzing
part. Further, the quality engineer provides the
background knowledge from production for the
PTMD as long as it cannot be drawn automatically
from other systems. Of course, the quality engineer
keeps his access to the PQM. The ML system has to
satisfy the following list of constraints and
requirements:
• To improve production the application predicts
possible product errors as soon as possible. This is
one of the basic objectives. It is based on the
observation of quality management that further
processing creates only unneeded costs (Colledani
et al., 2014). Also, the results should be evaluated
and documented for future comparisons.
• A ML model should be understandable for the
quality engineer. Without any explanations about
the decision, it is problematic to trust these advises.
At least, a ML model should give some hints how it
made its decisions. Specifically, the application has
to assist the identification of features and feature
conditions that are related to the investigated errors.
ICEIS 2020 - 22nd International Conference on Enterprise Information Systems
518
It should visualize relationships between feature
value distribution and errors. This requirement is
strongly requested in interviews with quality
engineers. New approaches concerning
interpretable machine learning point out solutions
and the general demand in data science (Molnar,
2019).
• The ML system must work with a variety of product
lines and products. Every test system provides an
unknown amount of data and data types. Moreover,
to create an individual solution for every production
step or test station would be greatly time consuming
and inefficient. Additionally, the management and
maintenance of a large amount of individual
solutions is not advisable. Therefore, the concept of
automatic machine learning (AutoML) (Quanming
et al.,2018) is needed. But performance needs to be
improved by guiding knowledge represented in the
PTMD.
• Production quality is in general very good. An ML
system in this context must deal with low error rate
and unbalanced biased class values as a
consequence (Krawczyk, 2016).
• A further problem is the machine learning
knowledge gap for a quality engineer. Typically, a
quality engineer has barely any knowledge to
configure or even to tune an ML System. This
makes the quality engineer dependent on the help of
a data scientist. This is another reason why AutoML
is important.
• Concept drift has to be considered (Lu et al., 2018).
It can happen that product features and production
processes change over time. In this case the ML
system should be able to monitor and to point out
that the data changed. The quality engineer should
be informed, and the ML model must be re-trained.
• Cost sensitivity is a problem for a justifiably use of
ML. Product parts are often expensive, because of
this some correct predicted errors already are
worthwhile to use a ML model. Taking out false
positive parts is expensive, too. Therefore, a quality
engineer has to define a profitable threshold, which
represent the minimum rate to achieve. This is also
supported by literature, e.g. (Thai-Nghe et al.,
2010).
• Test data needs to be selected and prepared before
the ML training and evaluation. In order to create a
model that works over several production steps, the
number of steps must first be determined.
Afterwards, the measurements from the chosen
production steps must be joined together and a ML
model must be trained. The required join logic needs
a representation in the PTMD.
Figure 4: Product Testing Meta Data.
The ML system requires the PTMD, which we
illustrate in Figure 4 in a simplified presentation. The
structure of the PTMD is divided into four parts. Each
of these four parts represent a separate information
section. The idea behind this model is to document
important information about a product, to access them
later. Also, it can be seen as a documentation structure
for this information. Moreover, we need the PTMD to
manage the ML system. With the PTMD we define
e.g. the Data to select and prepare for the ML training.
Consequently, this model helps to replace individual
script solutions for products. The ML system can
access the PTMD and get the required information to
create datasets etc. In the Product section, we mention
the specific product and relationships to other
members of the product family (product variants).
Information about the product type and product
features must be stored in this section. Product
features could be measurements from a specific test
station or individual entries like function description
of the product. Also, gained knowledge from human
experts get stored in this section. The Product section
is linked to the Test Specification and Production
Line section. In the Production Line section, we
describe the sequence of the test stations in the
production. This sequence is important to analyse and
identify the product errors. Moreover, with the test
station we have a reference to the required features.
In the Test System section are all test station
mentioned for a product, which in turn are directly
linked to the Test Specification and Production Line
section. In the Test Specification section, the features
and specific feature boundaries are stored, which
represent the max and min value. This section is
linked to the Product and Test System section. A
quality engineer should be assigned to maintain the
PTMD. Based on the background knowledge, a
quality engineer can control the stored information
and check them for correctness. The PTMD is well
suited for an AutoML system as a knowledge base.
The AutoML system would access the PTMD to get
necessary information about the procedure to run.
A Reference Process Model for Machine Learning Aided Production Quality Management
519
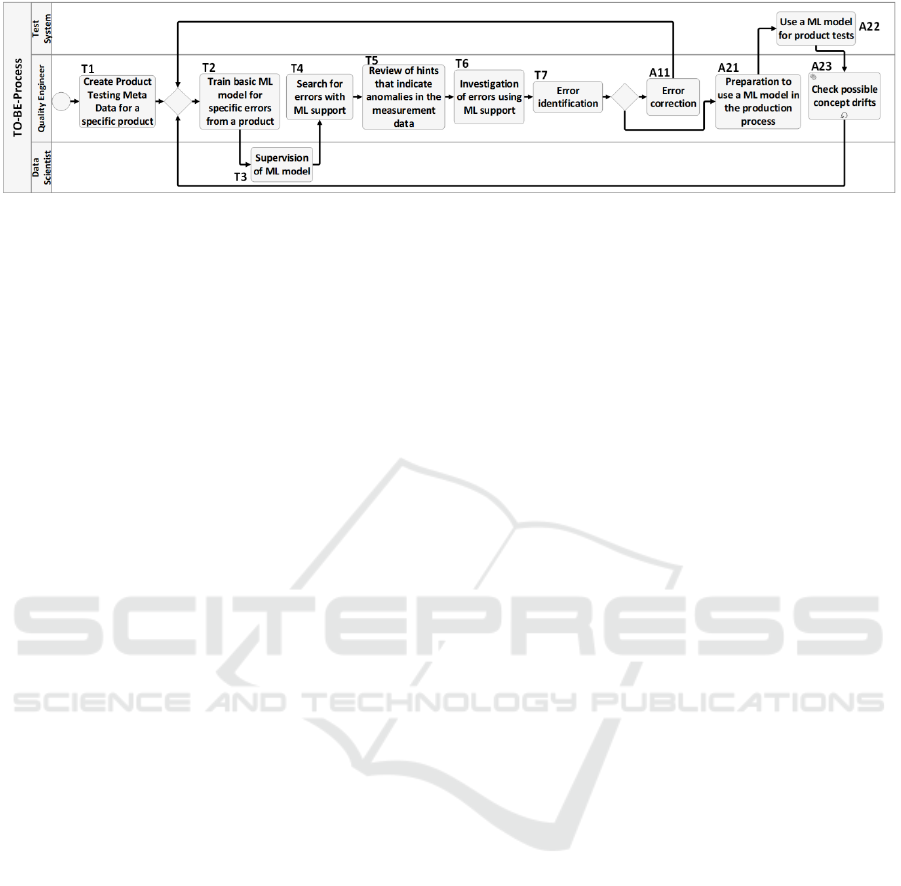
Figure 5: To-be process.
5 ACTORS
In this section we will name the actors and explain
their extended tasks in comparison to the as-is process
(Figure 1). These actors will be later used for the to-
be process (Figure 5).
QUALITY ENGINEER: The quality engineer
monitors a wide variety of products in the production
manufacturing process. Therefore, a quality engineer
controls a product as part of its product life cycle,
analyses product measurements and document the
production process. To fulfil those tasks, a quality
engineer must create the PTMD, which is filled with
background knowledge about a specific product. He
is also responsible for test specifications. With the
prepared data in the PTMD, the quality engineer is
ready to create a basic ML model. The ML model
should help the quality engineer to identify error
sources, within the context of e.g. product type,
selected malfunctions, desired duration or test station.
A quality engineer can select an error type or a group
of error types and analyse them separately or together.
As a result, the quality engineer should be able to
identify the most important features (i.e. highest
impact on the test result). This ranked feature list can
later be used for more precise investigations. It is
advisable, to analyse the highest ranked features.
Moreover, suitable plots can be generated to
investigate the malfunction causes. 2D scatter plots
can be used to illustrate a value distribution of a
feature along production time. This plot shows
correct and fault product tests in the data and in which
value range the errors occurred. A histogram is
further visualization type to illustrate the error
distribution. In a histogram, the feature values get
grouped by a defined group size in the complete value
range. With this illustration we can show statistically
how many errors in a value range occurs. The
absolute and relative number of errors should be used
for the illustration. Additionally, a 3D plot can be
used to show the correlations between two features.
A quality engineer can identify correlations among
the measurements and drop the irrelevant product
features. The gained knowledge should be used to
define new check rules to enhance the quality of the
resulted product as well as to reduce the rate of
malfunctions. A further task of the quality engineer is
to point out anomalies in measurements. This task can
be automatically performed by the ML system and
this leads to further investigation, such as over the
reasons for the wrong behaviour and checks the
correlation of those measurements and the trend of
the malfunctions. A quality engineer can also define
new product specific metrics to display error
deviations and provide a better understanding of
them. Error classes could be chosen by the quality
engineer to restrict the error space. Over time, the pre-
trained ML model might perform worse than at the
beginning of the creation of the ML model. This
could be due to a concept drift. Because of this, the
quality engineer must be informed about the
performance of a ML model. The ML system should
be able to report which parts or ML models are
influenced by a concept drift and in which production
stage the malfunction has started to appear. The
quality engineer must then check, if a new ML model
is needed for the production. Ideally, the test system
should be able to proactively warn the quality
engineer of occurring and/or rising malfunctions in
the measurements.
DATA SCIENTIST: The tasks of a data scientist
are primarily controlling tasks. Therefore, the data
scientist is responsible to supervise the trained ML
models. To do so, the created ML models should be
frequently controlled and checked, if the goodness of
the ML model is still acceptable. To support these
tasks, there are e.g. two different possibilities. A good
performance visualization to check is the ROC curve
(Metz, 1978). Based on the ROC curve and a
predefined threshold, it can be immediately
recognized whether the use of the ML model is
worthwhile. Another good comparable metric for this
task is the Matthews correlation coefficient (MCC)
(Boughorbel et al., 2017). The MCC measures the
ICEIS 2020 - 22nd International Conference on Enterprise Information Systems
520

goodness of a ML model prediction. A data scientist
can recognise any changes in the data by checking
frequently the MCC measure.
TEST SYSTEM: To the described task of Figure
1, the test system gets an extended task. A trained ML
model will be used to support the test system.
Moreover, the prediction from the ML model should
add to the decision, if a product has passed the test
station.
6 TO-BE PROCESS
In this section, we describe the tasks, which are
illustrated in Figure 5 and assign them to the actors
mentioned. The illustrated to-be process runs
throughout the complete life cycle of a product
(Levitt, 2014). As long the product is not at the end of
its life cycle, the to-be process will be repeatedly
executed. The quality engineer starts the to-be
process (Figure 5) with the creation of a PTMD for a
specific product (T1). Based on the background
knowledge for a specific product, a quality engineer
can bring all the important information together. The
ML system will later access the PTMD and pull the
necessary data. After the creation of the PTMD, the
quality engineer will train a basic ML model for
specific errors of a product (T2). In the next step, the
data scientist supervises the previous trained ML
model. Therefore, control tasks will be carried out. To
do so, the data scientist controls visualizations and
metrics (T3). Later, the quality engineer can start
searching for errors with the previously created ML
model (T4). It should be checked whether the results
found are plausible. Additionally, the quality
engineer will review the hints given by the ML
system (T5). For this, the created visualizations can
be used, and production worker can be interviewed,
to get more information. The next step for the quality
engineer would be to investigate the errors found
using ML support (T6). The objective is to investigate
the relationships between the error message and the
selected features. Afterwards, the quality engineer
must identify the error based on the previous
evaluation (T7). After this step, there are two
alternative ways to proceed. The first alternative
would be to use the collected information from the
previous steps and correct the found error in the
product (A11). To do so, he should contact the
production team and discuss the changes to
implement. To improve a product further, the quality
engineer should go back to step T2 and train a basic
ML model. This step should be done to improve the
quality of a product. The second alternative would be
to start the preparations for the use of the ML model
in the production process (A21). To do this, the
quality engineer must adapt the configuration to the
system. The test system will use the prepared ML
model in the production and document constantly the
results in the database (A22). A recurring task is to
check if any concept drifts in the data was found
(A23). This can be achieved by using a monitoring
system and should be done by a quality engineer. If a
concept drift is detected, the quality engineer will
initiate an adjusted training for a basic ML model for
specific errors (T2).
7 CONTRASTING AS-IS WITH
TO-BE PROCESS
As part of a validation of ML system requirements
and to-be process we compare it with the as-is process
as typical quality management process and with
CRISP-DM as standard data science process. With
the new process we can generally improve several
important points. One of the major improvements is
that a quality engineer will be strongly supported by
the ML System in his work. In addition, a quality
engineer is no longer dependent on the help of a data
scientist. The PTMD distinguishes the to-be process
from the standard CRISP-DM, since it is assisting
AutoML. The data scientist is still needed, but she has
only to supervise the system by controlling operating
figures like ROC curves and confusion matrices
(Hearty, 2016). Moreover, heuristic individual
mathematical tools will be obsolete. Also, even
without data science knowledge a quality engineer
can reuse the ML System and benefit from the
visualization output. These visualizations can be used
to investigate production errors. The to-be process
extends the tasks of the quality engineer and the test
system in contrast to the as-is process (Figure 1). The
quality engineer uses the ML system to investigate
features and generate plots. Also, the ML system can
be used to dive deeply into the data and get an
overview about the structure. The creation and
maintenance of the PTMD is added to the tasks of a
quality engineer. For the to-be process the test
systems will be extended by using a ML model to test
the product or parts of it. After implementing the to-
be process we improve the following points:
• Supporting tasks of a quality engineer with help of
ML. This point has significantly improved in
comparison to the as-is process. With the tasks T4,
T5, T6, T9 we help the quality engineer with a
variety of support activities.
A Reference Process Model for Machine Learning Aided Production Quality Management
521

• Use of the PTMD, which stores background
knowledge about products. T1 references this task.
The AutoML system uses the meta data.
• Regular checks of occurring concept drifts in data.
This is referenced by T9 which checks the occurring
data in regular intervals.
• Supporting decisions with multiple feature
visualizations from a ML system. In task T4 the
quality engineer can use selected histograms and 2D
- 3D scatter plots to support his investigations.
• Supporting error identifications with explainable
ML decisions. With the T6 and T7 tasks, we are
supporting the quality engineer in his investigations.
8 CONCLUSION
We have presented the necessary requirements to
successfully use a ML aided system into an industrial
based production environment. We developed the
PTMD in which the information about a product has
to be stored. These can be used for many purposes and
summarize background knowledge about a specific
product in one model. We also presented the as-is
process to clarify the procedure of malfunction
detection in the production environment for a quality
engineer. Moreover, a general description about the
actors and their tasks has been given. Additionally,
we illustrated the to-be process and described the
extended tasks with the associated actor for the
implementation of a ML aided system. At the end, we
validate our to-be process by contrasting it to the as-
is process. We have already started implementing our
auto ML system according to the developed
requirements, this will be followed up with several
tests in the production environment and in the near
future, we intend to publish our first results.
Additionally, we are going to test our system on
various product types and adjust it for a universal use
for any product.
ACKNOWLEDGEMENTS
This project was funded by the German Federal
Ministry of Education and Research, funding line
“Forschung an Fachhochschulen mit Unternehmen
(FHProfUnt)“, contract number 13FH249PX6. The
responsibility for the content of this publication lies
with the authors. Also, we want to thank the company
SICK AG for the cooperation and partial funding.
REFERENCES
Boughorbel, S., Jarray, F., & El-Anbari, M. (2017).
Optimal classifier for imbalanced data using Matthews
Correlation Coefficient metric. PloS one, 12(6),
e0177678.
Chapman, P., Clinton, J., Kerber, R., Khabaza, T., Reinartz,
T., Shearer, C., & Wirth, R. (2000). CRISP-DM 1.0:
Step-by-step data mining guide. SPSS inc, 16.
Colledani, M., Tolio, T., Fischer, A., Iung, B., Lanza, G.,
Schmitt, R., & Váncza, J. (2014). Design and
management of manufacturing systems for production
quality. CIRP Annals, 63(2), 773-796.
Hearty, J. (2016). Advanced machine learning with Python:
solve challenging data science problems by mastering
cutting-edge machine learning techniques in Python
(pp.177-179). Birmingham: Packt Publishing.
Hirsch, V., Reimann, P., & Mitschang, B. (2019, October).
Data-Driven Fault Diagnosis in End-of-Line Testing of
Complex Products. In 2019 IEEE International
Conference on Data Science and Advanced Analytics
(DSAA) (pp. 492-503). IEEE.
Hu, S. J., Zhu, X., Wang, H., & Koren, Y. (2008). Product
variety and manufacturing complexity in assembly
systems and supply chains. CIRP annals, 57(1), 45-48.
Johnson, C. N. (2002). The benefits fo PDCA. Quality
Progress, 35(5), 120.
Krawczyk, B. (2016). Learning from imbalanced data: open
challenges and future directions. Progress in Artificial
Intelligence, 5(4), 221-232.
Levitt, T. (2014, August 1). Exploit the Product Life Cycle.
Retrieved November 14, 2019, from
https://hbr.org/1965/11/exploit-the-product-life-cycle.
Lu, J., Liu, A., Dong, F., Gu, F., Gama, J., & Zhang, G.
(2018). Learning under concept drift: A review. IEEE
Transactions on Knowledge and Data Engineering.
Mehta, D., & Hamke, A. K. (n.d.). Impact of ai. In In-depth:
Artificial Intelligence 2019 (pp. 17–18).
Metz, C. E. (1978, October). Basic principles of ROC
analysis. In Seminars in nuclear medicine (Vol. 8, No.
4, pp. 283-298). WB Saunders.
Molnar, C. (2019). Interpretable machine learning: a guide
for making Black Box Models interpretable (pp.19-25).
Morisville, NC: Lulu.
Monostori, L., Márkus, A., Van Brussel, H., &
Westkämpfer, E. (1996). Machine learning approaches
to manufacturing. CIRP annals, 45(2), 675-712.
Pham, D. T., & Afify, A. A. (2005). Machine-learning
techniques and their applications in manufacturing.
Proceedings of the Institution of Mechanical Engineers,
Part B: Journal of Engineering Manufacture, 219(5),
395-412.
Quanming, Y., Mengshuo, W., Hugo, J. E., Isabelle, G., Yi-
Qi, H., Yu-Feng, L., ... & Yang, Y. (2018). Taking
human out of learning applications: A survey on
automated machine learning. arXiv preprint
arXiv:1810.13306.
SICK AG Homepage. (n.d.). Retrieved 2019, from
https://www.sick.com/de/de/.
ICEIS 2020 - 22nd International Conference on Enterprise Information Systems
522

Stanisavljevic, D., & Spitzer, M. (2016, October). A
Review of Related Work on Machine Learning in
Semiconductor Manufacturing and Assembly Lines. In
SAMI@ iKNOW.
Stübinger, V. (n.d.). Industrie 4.0: Künstliche Intelligenz
zieht in Fabrikhallen ein. Retrieved 2019, from
https://www.bitkom-
research.de/de/pressemitteilung/industrie-40-
kuenstliche-intelligenz-zieht-fabrikhallen-ein.
Susto, G. A., Pampuri, S., Schirru, A., De Nicolao, G.,
McLoone, S. F., & Beghi, A. (2012). Automatic control
and machine learning for semiconductor
manufacturing: Review and challenges. In Proceedings
of the 10th European Workshop on Advanced Control
and Diagnosis (ACD 2012).
Susto, G. A., & Beghi, A. (2013). A virtual metrology
system based on least angle regression and statistical
clustering. Applied Stochastic Models in Business and
Industry, 29(4), 362-376.
Thai-Nghe, N., Gantner, Z., & Schmidt-Thieme, L. (2010,
July). Cost-sensitive learning methods for imbalanced
data. In The 2010 International joint conference on
neural networks (IJCNN) (pp. 1-8). IEEE.
Wang, J., Ma, Y., Zhang, L., Gao, R. X., & Wu, D. (2018).
Deep learning for smart manufacturing: Methods and
applications. Journal of Manufacturing Systems, 48,
144-156.
Wu, D., Jennings, C., Terpenny, J., Gao, R. X., & Kumara,
S. (2017). A comparative study on machine learning
algorithms for smart manufacturing: tool wear
prediction using random forests. Journal of
Manufacturing Science and Engineering, 139(7),
071018.
Wu, Q., & Ni, Z. (2011). Car assembly line fault diagnosis
based on triangular fuzzy support vector classifier
machine and particle swarm optimization. Expert
Systems with Applications, 38(5), 4727-4733.
Wuest, T., Weimer, D., Irgens, C., & Thoben, K. D. (2016).
Machine learning in manufacturing: advantages,
challenges, and applications. Production &
Manufacturing Research, 4(1), 23-45.
Ziekow, H., Schreier, U., Saleh, A., Rudolph, C., Ketterer,
K., Grozinger, D., & Gerling, A. (2019). Proactive
Error Prevention in Manufacturing Based on an
Adaptable Machine Learning Environment. From
Research to Application, 113.
A Reference Process Model for Machine Learning Aided Production Quality Management
523
